D I A B E T E S & M E T A B O L I S M J O U R N A L D I A B E T E S & M E T A B O L I S M J O U R N A L
This is an Open Access article distributed under the terms of the Creative Commons At- tribution Non-Commercial License (http://creativecommons.org/licenses/by-nc/3.0/) which permits unrestricted non-commercial use, distribution, and reproduction in any medium, provided the original work is properly cited.
Is an Oral Glucose Tolerance Test Still Valid for Diagnosing Diabetes Mellitus?
Dong-Lim Kim1,*, Sun-Doo Kim2,*, Suk Kyeong Kim1, Sooyoun Park1, Kee-Ho Song1
1Division of Endocrinology and Metabolism, Department of Internal Medicine, Konkuk University School of Medicine, Seoul,
2Department of Internal Medicine, Graduate School of Medicine, Konkuk University, Seoul, Korea
Background: We evaluated the diagnostic rate of diabetes using fasting plasma glucose (FPG), 2-hour plasma glucose (2h PG) after 75 g oral glucose tolerance test (OGTT), and glycosylated hemoglobin (HbA1c) levels, and we elucidated the pathophysio- logic characteristics and risk factors that give rise to diabetes in patients with prediabetes.
Methods: The data of 236 patients who had the OGTT at Konkuk University Hospital were analyzed. Fasting, 30, and 120 min- utes blood glucose levels and insulin levels were measured. The diagnostic rate of diabetes was assessed using FPG, 2h PG, and HbA1c levels. The clinical data and insulin resistance and secretion evaluations were compared using indexes according to the fasting glucose level.
Results: Among 236 subjects, 97 (41.1%) were diabetics and 102 (43.2%) were prediabetics. The rate of diabetes diagnosis by one of the individual criteria was 56.7%, 53.6%, and 84.5% for FPG, HbA1c, and 2h PG, respectively. When two criteria were used to diagnose diabetes, 72.2% of the diabetic patients were identified by FPG and HbA1c, while 100% were identified by FPG and 2h PG, and 91.7% were identified by 2h PG and HbA1c. The HbA1c cut-off value for 2h PG ≥200 mg/dL was 6.1%, and the FPG cut-off value was 115 mg/dL. In impaired fasting glucose subjects, the HbA1c level, Matsuda index, and insulinogenic index were associated with risk of occurrence of overt diabetes (P<0.01).
Conclusion: This study suggests that performing additional OGTT for patients with FPG ≥110 mg/dL or HbA1c ≥6.1% is help- ful to reclassify their glucose tolerance status and evaluate their potential for progressing to overt diabetes.
Keywords: Diabetes mellitus; Diagnosis; Glucose tolerance test; Prediabetic state
INTRODUCTION
Diabetes mellitus (DM) and its related complications, such as cardiovascular diseases, acquired blindness, chronic kidney disease, and non-traumatic limb loss, are major causes of mor- bidity and mortality in Korea [1]. According to a recent report by the International Diabetes Federation, approximately 382 million people were diagnosed with diabetes in 2013, and it is predicted that this will increase to approximately 600 million by 2035 [2]. It was actually estimated that the number of peo-
ple suffering from diabetes will reach 382 million by 2030 in 2004, but in fact, this number was already reached by 2013, in- dicating that the number of diabetic patients is increasing much faster than estimated [3]. Such a phenomenon has also been observed in Korea, where the prevalence of diabetes has risen from 8.9% to 12.4% from 2001 to 2010 [4]. Furthermore, the prevalence of prediabetes has also been reported to be 38.3%, implying that the increasing trend of diabetes will con- tinue [4]. Additionally, more of the younger populations are now suffering from diabetes due to westernized lifestyles and http://dx.doi.org/10.4093/dmj.2016.40.2.118
pISSN 2233-6079 · eISSN 2233-6087
Corresponding author: Kee-Ho Song http://orcid.org/0000-0001-9276-6860 Division of Endocrinology and Metabolism, Department of Internal Medicine, Konkuk University School of Medicine, 120-1 Neungdong-ro, Gwangjin-gu, Seoul 05030, Korea
E-mail: [email protected]
* Dong-Lim Kim and Sun-Doo Kim contributed equally to this study as first
eating habits, and there is an increasing rate of obesity, which suggests that diabetes will remain as a public health burden [5].
It has already been proven by multiple studies that strict blood glucose control is essential to prevent chronic complications of diabetes. Tight glycemic control through active intervention soon after diagnosis has been shown to prevent microvascular complications as well as macrovascular complications, denot- ing that early and active treatment is important [6,7]. In addi- tion, identifying patients with impaired glucose tolerance (IGT) or impaired fasting glucose (IFG), which is a previous stage of diabetes, and inhibiting their further progression by taking preventive measures can also be another method to re- lieve the socioeconomic burden caused by diabetes [8].
The currently used methods to identify diabetes include the fasting plasma glucose (FPG) level test, oral glucose tolerance test (OGTT), and glycosylated hemoglobin (HbA1c) level test [9]. OGTT used to be the gold standard for diagnosing diabe- tes and prediabetes; however, it is now being used less because of its low reproducibility and time-consuming disadvantages [10]. However, the diagnostic value of OGTT now requires a re-evaluation considering the fact that diabetic patients with increasing postprandial glucose can be omitted due to the low concordance rate of the standards for diagnosing diabetes be- tween FPG, 2-hour plasma glucose (2h PG) after 75 g OGTT, and HbA1c levels, while OGTT can reveal insulin resistance and β-cell dysfunction that are the fundamental pathophysiol- ogy of the state of diabetes [11]. Furthermore, it has been re- ported that the diagnosis of diabetes is difficult solely based on FPG and HbA1c levels because postprandial glucose increases before fasting glucose in Korean diabetic patients aged more than 60 years [12].
Here, we re-evaluated the diagnostic value of OGTT for dia- betes and prediabetes with patients who underwent OGTT be- tween September 2010 and September 2014. The necessity of OGTT for further classification of glucose dysregulation status was determined by investigating the differences in pathophysi- ologic characteristics of the occurrence of diabetes in patients with IFG according to their fasting glucose level.
METHODS
Study population
The data of patients who were reported to have a problem with FPG (≥100 mg/dL) during regular medical checkups and re- ceived an OGTT from September 2010 to September 2014 in
the division of Endocrinology, Department of Internal Medi- cine, Konkuk University Hospital, were collected. Additional- ly, the data of 23 healthy volunteers who took the OGTT and 18 patients who received gestational diabetes mellitus treat- ment and subsequently took the OGTT at 6 to 8 weeks post- partum were included. Patients with a history of diabetes or currently undergoing medical therapy were excluded. Female patients who continued to use insulin syringes after gestation- al diabetes were also excluded. Informed consent was obtained from healthy volunteers, and the protocols were approved by the Konkuk University Hospital Institutional Review Board.
Measurements
Systolic and diastolic blood pressures were measured on the left upper arm after 5 minutes of rest in a sitting position using an automatic blood pressure monitor (HEM-907-E; OMROM, Tokyo, Japan). Abdominal circumference was measured in a standing position at the midway between the lower costal mar- gin and the iliac crest. After fasting for 8 hours or more, blood was drawn from the antecubital vein of each participant. The samples were properly processed, refrigerated at 2°C to 8°C, and analyzed within 24 hours of transportation. Fasting glu- cose was measured using a Hitachi Automatic Analyzer 7600 (Hitachi, Tokyo, Japan). High-performance liquid chromatog- raphy-723G7 (Tosoh, Tokyo, Japan) was used to check HbA1c.
Insulin concentrations were estimated using an electrochemi- luminescence method (COBAS E 411; Roche Diagnostics, Mannheim, Germany). The intra-assay and interassay coeffi- cients of variation for the biochemical assays ranged between 3.1% and 7.6%. The blood levels of total cholesterol, triglycer- ides, high density lipoprotein, and low density lipoprotein cholesterol levels were measured using a Toshiba 200FR Auto- analyser (Toshiba Medical Systems Co. Ltd., Tokyo, Japan).
High-sensitivity C-reactive protein was measured with an im- munoturbidimetric method (CRP II Latex X2; Denka Seiken Co. Ltd., Tokyo, Japan) using an autoanalyzer (Toshiba).
Calculations
For evaluation of insulin resistance, the homeostasis model as- sessment of insulin resistance (HOMA-IR), the modified Mat- suda index for whole body insulin sensitivity, and the Gutt in- sulin sensitivity index (ISI) were estimated as follows [13-16]:
HOMA-IR= Ins0×Glc0
405
Matsuda index=
10,000 (Ins0×Glc0)×(mean OGTT glucose×mean OGTT insulin)
Gutt ISI= 75,000+(Glc0–Glc120)×0.19×body weight 120×log([Ins0+Ins120]/2×[Glc0+Glc120]/20) β-Cell function was measured using the homeostasis model assessment of pancreatic β-cell function (HOMA-B), the insu- linogenic index (IGI), and the oral disposition index (DI) by calculating as follows [13,17]:
HOMA-B= Ins0×360 Glc0–63
IGI= Ins30–Ins0
Glc30–Glc0
DI= Matsuda index×IGI
Ins0, fasting plasma insulin (μIU/mL); Ins30, plasma insulin 30 minutes after glucose intake (μIU/mL); Ins120, plasma insulin 120 minutes after glucose intake (μIU/mL); Glc0, fasting plas- ma glucose (mg/dL); Glc30, plasma glucose 30 minutes after glucose intake (mg/dL); and Glc120, plasma glucose 120 min- utes after glucose intake (mg/dL).
Total area under the curve (AUC) for insulin and AUC for glucose were calculated using the trapezoidal rule, and a ratio of the two was created (AUCins/glu). The glycemic status out- comes for this study were defined by the following American Diabetes Association criteria [9]: diabetes as FPG ≥126 mg/
dL or 2h PG ≥200 mg/dL, or both; isolated IFG (iIFG) as FPG 100 to 125 mg/dL and 2h PG <140 mg/dL; isolated IGT (iIGT) as 2h PG after 75 g OGTT 140 to 199 mg/dL and FPG
<100 mg/dL; NGT as FPG <100 mg/dL and 2h PG <140 mg/
dL; and combined IFG and IGT (IFG+IGT) as FPG 100 to 125 mg/dL and 2h PG 140 to 199 mg/dL. Prediabetes was defined as iIFG, iIGT, or combined IFG and IGT.
Statistical analysis
All analyses were conducted using SPSS version 19.0 (IBM Co., Armonk, NY, USA). Data were presented as the mean±
standard deviation for the continuous variables and the num- ber of cases and as a percentage of the nominal variables. Sta-
tistical significance for comparisons between two groups was tested using the Mann-Whitney U test for continuous vari- ables. Analysis of variance was used to compare the mean of three or more groups. Categorical variables were compared using Pearson chi-square test or Fisher exact test. The point- wise area under the receiver operating characteristic (ROC) curve was used to define the FPG, 2h PG, and A1c cut-off val- ues for diagnosing diabetes. To identify the factors involved in overt diabetes mellitus in the subgroup whose FPG was be- tween 100 and 125 mg/dL, logistic-regression models adjusted for body mass index (BMI), FPG, HbA1c, C-peptide, free fatty acid, triglycerides, Matsuda index, and IGI were used. Statisti- cal significance was defined as a 2-tailed P<0.05.
RESULTS
Baseline characteristics
The baseline characteristics and metabolic parameters of the subjects are shown in Table 1. The study subjects included 122 men and 114 women. The subjects were divided into five groups according to the glucose tolerance state: NGT, iIFG, iIGT, IFG+
IGT, and overt DM.
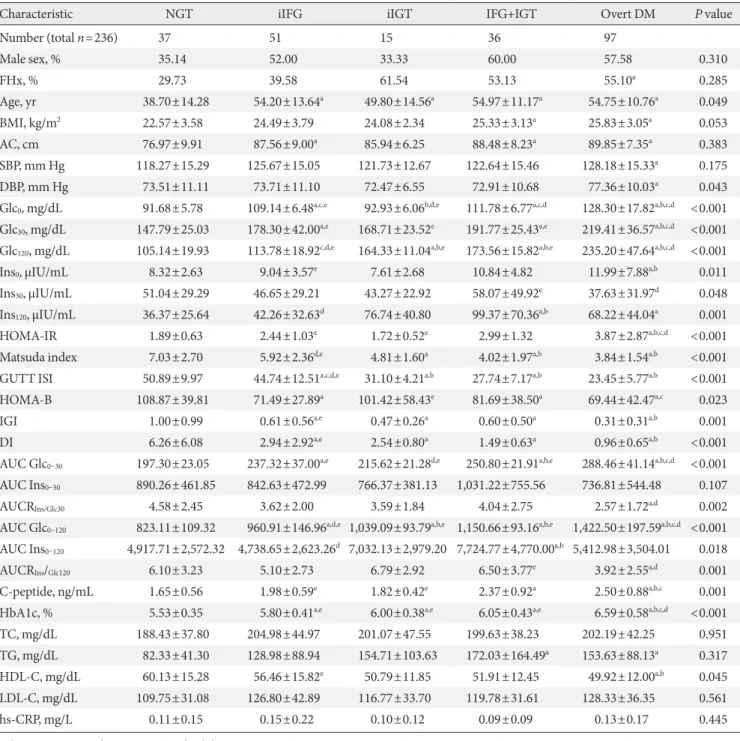
Among 236 subjects, 97 (41.1%) were diabetics, 102 (43.2%) were prediabetics (iIFG, iIGT, and IFG+IGT groups), and 37 (15.7%) had normal glucose tolerance. The mean age was high- er in the prediabetes and overt DM group compared with the NGT group (P<0.05). BMI was high in the IFG plus IGT and overt DM groups compared with the NGT group (22.57±3.58, 25.33±3.13, and 25.83±3.05, respectively). The systolic and di- astolic blood pressures were high in the overt DM group com- pared to the NGT group (P<0.05). The mean HbA1c levels in NGT, iIFG, iIGT, IFG+IGT, and overt DM subjects were 5.53±
0.35, 5.80±0.41, 6.00±0.38, 6.05±0.43, and 6.59±0.58, respec- tively (P<0.001).
Insulin resistance (HOMA-IR, Matsuda index, Gutt ISI) and β-cell function (HOMA-B, IGI, DI) parameters showed significant differences in the prediabetes and overt diabetes groups compared with controls (NGT). The Matsuda index and Gutt ISI were lower in the combined IFG+IGT group and overt DM group compared with the iIFG group (Table 1).
Concordance rate among FPG, 2h PG, and HbA1c criteria for the diagnosis of diabetes
Among 97 diabetic patients, 30 patients (30.9%) satisfied all of the FPG, HbA1c, and 2h PG standards; 41.2% satisfied the FPG
Table 1. Baseline characteristics and metabolic parameters of the subjects according to glucose tolerance status
Characteristic NGT iIFG iIGT IFG+IGT Overt DM P value
Number (total n=236) 37 51 15 36 97
Male sex, % 35.14 52.00 33.33 60.00 57.58 0.310
FHx, % 29.73 39.58 61.54 53.13 55.10a 0.285
Age, yr 38.70±14.28 54.20±13.64a 49.80±14.56a 54.97±11.17a 54.75±10.76a 0.049
BMI, kg/m2 22.57±3.58 24.49±3.79 24.08±2.34 25.33±3.13a 25.83±3.05a 0.053
AC, cm 76.97±9.91 87.56±9.00a 85.94±6.25 88.48±8.23a 89.85±7.35a 0.383
SBP, mm Hg 118.27±15.29 125.67±15.05 121.73±12.67 122.64±15.46 128.18±15.33a 0.175
DBP, mm Hg 73.51±11.11 73.71±11.10 72.47±6.55 72.91±10.68 77.36±10.03a 0.043
Glc0, mg/dL 91.68±5.78 109.14±6.48a,c,e 92.93±6.06b,d,e 111.78±6.77a,c,d 128.30±17.82a,b,c,d <0.001 Glc30, mg/dL 147.79±25.03 178.30±42.00a,e 168.71±23.52e 191.77±25.43a,e 219.41±36.57a,b,c,d <0.001 Glc120, mg/dL 105.14±19.93 113.78±18.92c,d,e 164.33±11.04a,b,e 173.56±15.82a,b,e 235.20±47.64a,b,c,d <0.001
Ins0, μIU/mL 8.32±2.63 9.04±3.57e 7.61±2.68 10.84±4.82 11.99±7.88a,b 0.011
Ins30, μIU/mL 51.04±29.29 46.65±29.21 43.27±22.92 58.07±49.92e 37.63±31.97d 0.048 Ins120, μIU/mL 36.37±25.64 42.26±32.63d 76.74±40.80 99.37±70.36a,b 68.22±44.04a 0.001
HOMA-IR 1.89±0.63 2.44±1.03e 1.72±0.52e 2.99±1.32 3.87±2.87a,b,c,d <0.001
Matsuda index 7.03±2.70 5.92±2.36d,e 4.81±1.60a 4.02±1.97a,b 3.84±1.54a,b <0.001 GUTT ISI 50.89±9.97 44.74±12.51a,c,d,e 31.10±4.21a,b 27.74±7.17a,b 23.45±5.77a,b <0.001 HOMA-B 108.87±39.81 71.49±27.89a 101.42±58.43e 81.69±38.50a 69.44±42.47a,c 0.023
IGI 1.00±0.99 0.61±0.56a,e 0.47±0.26a 0.60±0.50a 0.31±0.31a,b 0.001
DI 6.26±6.08 2.94±2.92a,e 2.54±0.80a 1.49±0.63a 0.96±0.65a,b <0.001
AUC Glc0–30 197.30±23.05 237.32±37.00a,e 215.62±21.28d,e 250.80±21.91a,b,e 288.46±41.14a,b,c,d <0.001 AUC Ins0–30 890.26±461.85 842.63±472.99 766.37±381.13 1,031.22±755.56 736.81±544.48 0.107
AUCRIns/Glc30 4.58±2.45 3.62±2.00 3.59±1.84 4.04±2.75 2.57±1.72a,d 0.002
AUC Glc0–120 823.11±109.32 960.91±146.96a,d,e 1,039.09±93.79a,b,e 1,150.66±93.16a,b,e 1,422.50±197.59a,b,c,d <0.001 AUC Ins0–120 4,917.71±2,572.32 4,738.65±2,623.26d 7,032.13±2,979.20 7,724.77±4,770.00a,b 5,412.98±3,504.01 0.018
AUCRIns/Glc120 6.10±3.23 5.10±2.73 6.79±2.92 6.50±3.77e 3.92±2.55a,d 0.001
C-peptide, ng/mL 1.65±0.56 1.98±0.59e 1.82±0.42e 2.37±0.92a 2.50±0.88a,b,c 0.001 HbA1c, % 5.53±0.35 5.80±0.41a,e 6.00±0.38a,e 6.05±0.43a,e 6.59±0.58a,b,c,d <0.001
TC, mg/dL 188.43±37.80 204.98±44.97 201.07±47.55 199.63±38.23 202.19±42.25 0.951
TG, mg/dL 82.33±41.30 128.98±88.94 154.71±103.63 172.03±164.49a 153.63±88.13a 0.317 HDL-C, mg/dL 60.13±15.28 56.46±15.82e 50.79±11.85 51.91±12.45 49.92±12.00a,b 0.045 LDL-C, mg/dL 109.75±31.08 126.80±42.89 116.77±33.70 119.78±31.61 128.33±36.35 0.561
hs-CRP, mg/L 0.11±0.15 0.15±0.22 0.10±0.12 0.09±0.09 0.13±0.17 0.445
Values are presented as mean±standard deviation.
NGT, normal glucose tolerance; iIFG, isolated impaired fasting glucose; iIGT, isolated impaired glucose tolerance (FPG <100 mg/dL, 140 mg/
dL≤2h PG<200 mg/dL); DM, diabetes mellitus; FHx, family history of diabetes; BMI, body mass index; AC, abdominal circumference; SBP, systolic blood pressure; DBP, diastolic blood pressure; Glc0, fasting plasma glucose; Glc30, plasma glucose 30 minutes after glucose intake; Glc120, plasma glucose 120 minutes after glucose intake; Ins0, fasting plasma insulin; Ins30, plasma insulin 30 minutes after glucose intake; Ins120, plas- ma insulin 120 minutes after glucose intake; HOMA-IR, homeostasis model assessment of insulin resistance; Gutt ISI, Gutt insulin sensitivity index; HOMA-B, homeostasis model assessment of pancreatic β-cell function; IGI, insulinogenic index; DI, oral disposition index; AUC Glc, area under the curve for glucose; AUC Ins, area under the curve for insulin; AUCRIns/Glc, a ratio of the AUC Ins/AUC Glc; HbA1c, glycosylated hemoglobin; TC, total cholesterol; TG, triglyceride; HDL-C, high density lipoprotein cholesterol; LDL-C, low density lipoprotein cholesterol;
hs-CRP, high sensitivity C-reactive protein.
aP<0.05 vs. NGT, bP<0.05 vs. iIFG, cP<0.05 vs. iIGT, dP<0.05 vs. IFG+IGT, eP<0.05 vs. overt DM.
and 2h PG standards; 38.1% satisfied the FPG and HbA1c stan- dards; and 46.4% satisfied the 2h PG and HbA1c standards.
When only one of the individual criteria was used to diagnose diabetes, the rate of diabetes diagnosis was 56.7%, 53.6%, and 84.5% by FPG, HbA1c, and 2h PG, respectively (Fig. 1). When two of these criteria were used to diagnosis diabetes, 72.2% of diabetic patients were identified by FPG and HbA1c, while 100% were identified by FPG and 2h PG, and 91.7% were iden- tified by 2h PG and HbA1c.
Optimal cut-off values of FPG, 2h PG, and HbA1C for detecting diabetes
For the diagnosis of diabetes with criteria of FPG ≥126 mg/dL, an HbA1c cut-off value of 6.2% and 2h PG value of 190 mg/dL were required. For the diagnosis of diabetes with criteria of 2h PG ≥200 mg/dL, an HbA1c cut-off value of 6.1% and FPG val- ue of 115 mg/dL were required. For the diagnosis of diabetes with criteria of HbA1c ≥6.5%, an FPG cut-off value of 117 mg/
dL and 2h PG value of 188 mg/dL were required (Fig. 2).
The differences in demographic and metabolic
characteristics between each group after subdivision of IFG subjects according to FPG level
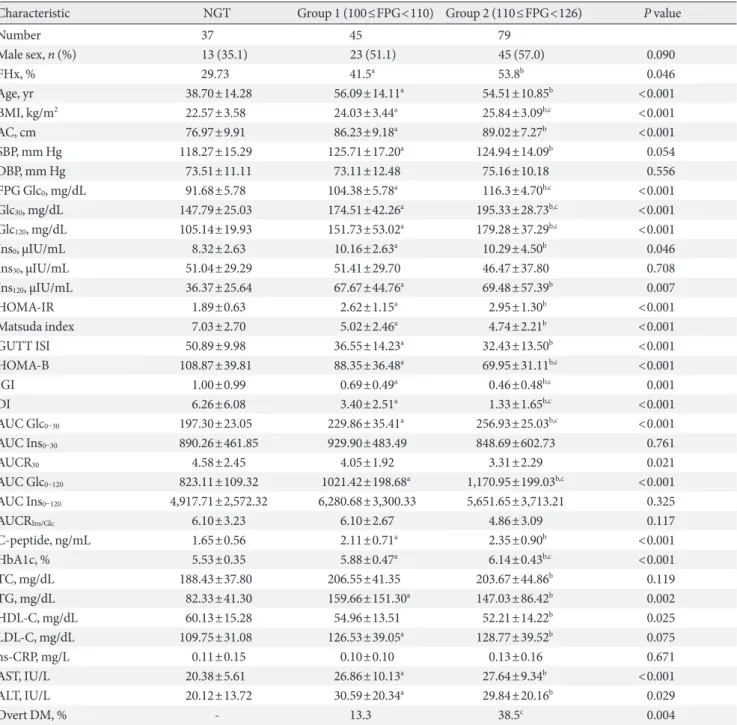
The IFG groups were subdivided into group 1 (100≤FPG<110) and group 2 (110≤FPG<126) according to previous Korean epidemiologic data [18] and were compared with the control group. Glucose dysregulation status, degree of insulin resis-
tance, and β-cell dysfunction were worse in groups 1 and 2 compared with the normal controls. In the case of group 2, whose FPG level was higher than group 1, the postload 30 and 120 minutes glucose and HbA1c levels were higher; the portion of overt DM was also higher in group 2, with 38.5% compared with the 13.3% of group 1 (P=0.004) (Table 2). When compar- ing groups 1 and 2 from the point of view of the two basic pathophysiologies of the state of diabetes, insulin resistance represented by the HOMA-IR, Matsuda index, and Gutt ISI, did not show any difference. However, HOMA-B, IGI, and DI, which represent β-cell function, were statistically significantly lower in group 2 compared with group 1 (Table 2).
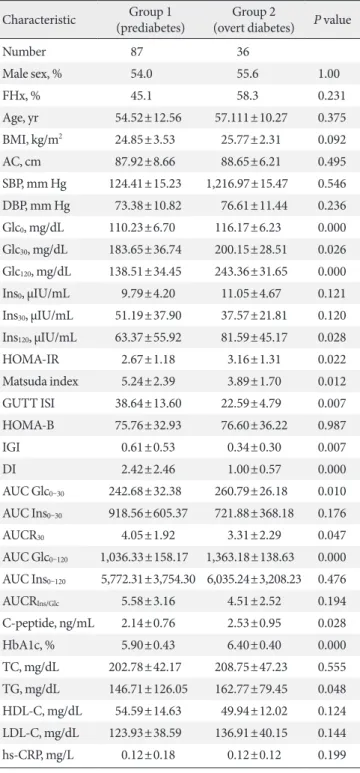
Risk factors associated with overt DM in a subgroup with FPG 100 to 125 mg/dL.
Patients who were diagnosed with prediabetes with a fasting glu- cose of 100 to 125 mg/dL and patients who were diagnosed with diabetes were compared for risk factors of diabetes (Table 3). We found that high HbA1c, high HOMA-IR, low IGI, and low DI were associated with the occurrence of diabetes even if the pa- tients were within the same fasting glucose range (Table 3).
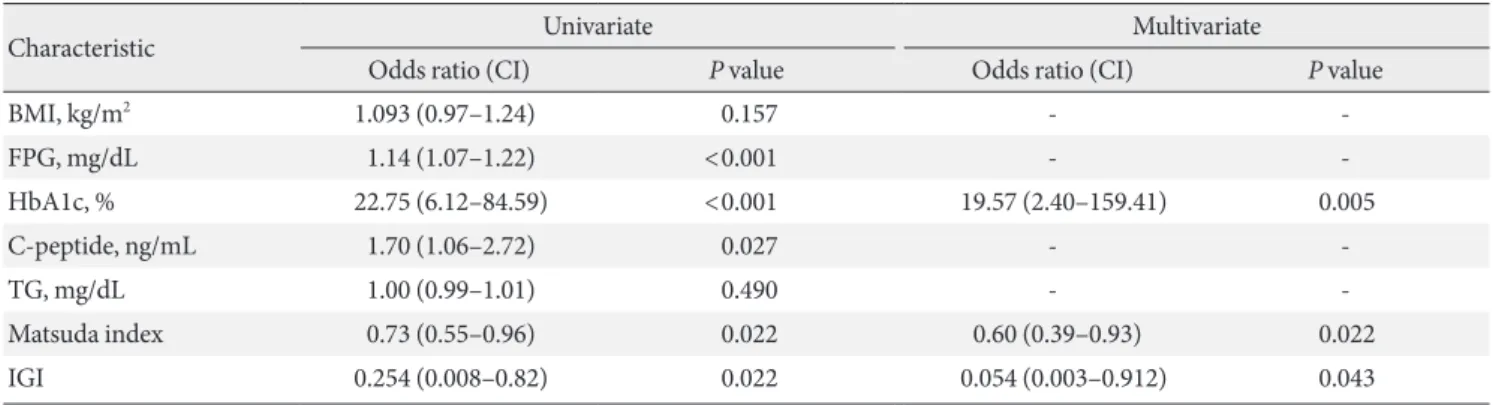
To uncover the variables related to overt diabetes in the IFG group, we performed a multiple logistic regression analysis and discovered that the levels of HbA1c, Matsuda Index, and IGI were statistically significantly correlated with overt diabetes (Table 4).
DISCUSSION
The results showed that it is significantly more accurate to use OGTT in addition to FPG and HbA1c tests when diagnosing diabetes. In addition, we also showed that even if the blood glucose level is within the IFG range, β-cell dysfunction pro- gresses with increasing FPG levels, which in turn raises the possibility of having overt diabetes. Furthermore, we found that the level of HbA1c, Matsuda index, and IGI are associated factors that increase the risk of having overt diabetes.
In this study, we confirmed the results of previous studies that claimed the low concordance rate between the standards of the three methods used to diagnose diabetes [18-20]. This low concordance rate may be partly due to low mean HbA1c levels (6.5%±0.58%). In diabetic patients with more than a 9%
HbA1c level, the diagnostic concordance rate between FPG, 2h PG, and HbA1c level has been reported to be relatively high [21]. However, we could not assess the concordance rate of the 27 (27.8%)
2h PG HbA1c
FPG 10 (10.3%)
30 (30.9%) 15 (15.5%) 0 (0%)
7 (7.2%)
8 (8.3%)
Fig. 1. The concordance rate between the three diagnostic crite- ria of diabetes: fasting plasma glucose (FPG) ≥126 mg/dL;
2-hour plasma glucose (2h PG) after 75 g oral glucose tolerance test ≥200 mg/dL; and glycosylated hemoglobin (HbA1c) ≥6.5%.
three methods according to HbA1c levels because of the low number of patients with an HbA1c level >7%.
A total of 97 diabetic patients who were diagnosed by either FPG or 2h PG with OGTT were analyzed, and within these subjects, only 41.2% were diagnosed with diabetes by both FPG and 2h PG, which is similar to the results from a pooled analysis in a previous Korean epidemiological study that re- ported 46%. Additionally, only 30.9% (n=30) of the patients matched the criteria for all three methods, which was similar to the 31.9% reported in previous research based on a Korean population [12]. These results directly indicated the low con- cordance rate of the criteria of the three methods; therefore, diagnosing patients with diabetes based on only one of these
methods will lead to omitting a large portion of other diabetic patients. In another point of view, when diabetes was classified based on FPG and HbA1c without 2h PG, 27.8% of the pa- tients were misclassified as non-diabetic patients, which was much higher than the 0% or 8.3% misclassification by 2h PG and FPG or 2h PG and HbA1c, respectively, denoting the im- portance of OGTT for a more accurate diagnosis. It was previ- ously reported that an increase in 2h PG after 75 g OGTT was observed before an increase in fasting glucose levels in old- aged diabetic patients in Korea [12]. Considering this, al- though the convenience for diabetic patients is important, OGTT will likely be required in certain cases.
To identify differences in diagnostic values, we used a ROC 100
80 60 40 20 0
Sensitivity
0 20 40 60 80 100 100-Specificity
Sensitivity: 85.5 Specificity: 72.2 Criterion : 6.2 AUC : 0.851
HbA1C
ROC curves of HbA1c for diagnosis of diabetes with criteria of FPG ≥126 mg/dL
100 80 60 40 20 0
Sensitivity
0 20 40 60 80 100 100-Specificity
Sensitivity: 85.4 Specificity: 71.9 Criterion : 6.1 AUC : 0.861
HbA1C
ROC curves of HbA1c for diagnosis of diabetes with criteria of 2h PG ≥200 mg/dL
100 80 60 40 20 0
Sensitivity
0 20 40 60 80 100 100-Specificity
Sensitivity: 77.8 Specificity: 77.5 Criterion : 117 AUC : 0.828
FPG
ROC curves of FPG for diagnosis of diabetes with criteria of HbA1c ≥6.5%
A B C
100 80 60 40 20 0
Sensitivity
0 20 40 60 80 100 100-Specificity
Sensitivity: 75.6 Specificity: 78.1 Criterion : 115 AUC : 0.817
FPG
ROC curves of FPG for diagnosis of diabetes with criteria of 2h PG ≥200 mg/dL
100 80 60 40 20 0
Sensitivity
0 20 40 60 80 100 100-Specificity
Sensitivity: 78.2 Specificity: 74.0 Criterion: 190 AUC: 0.816
2h PG
ROC curves of 2h PG for diagnosis of diabetes FPG with criteria of ≥126 mg/dL
100 80 60 40 20 0
Sensitivity
0 20 40 60 80 100 100-Specificity
Sensitivity: 77.9 Specificity: 75.0 Criterion: 188 AUC: 0.834
2h PG
ROC curves of 2h PG for diagnosis of diabetes with criteria of HbA1c ≥6.5%
D E F
Fig. 2. Receiver operating characteristic (ROC) curve of (A, B) glycosylated hemoglobin (HbA1c) and (C, D) fasting plasma glu- cose (FPG) levels for the diagnosis of diabetes with criteria of FPG ≥126 mg/dL or (E, F) 2-hour plasma glucose (2h PG) after 75 g oral glucose tolerance test ≥200 mg/dL or HbA1c ≥6.5%. AUC, area under the curve.
Table 2. Demographic and metabolic characteristics of the subjects with fasting plasma glucose between 100 and 125 mg/dL subdivided into two groups according to glucose level
Characteristic NGT Group 1 (100≤FPG<110) Group 2 (110≤FPG<126) P value
Number 37 45 79
Male sex, n (%) 13 (35.1) 23 (51.1) 45 (57.0) 0.090
FHx, % 29.73 41.5a 53.8b 0.046
Age, yr 38.70±14.28 56.09±14.11a 54.51±10.85b <0.001
BMI, kg/m2 22.57±3.58 24.03±3.44a 25.84±3.09b,c <0.001
AC, cm 76.97±9.91 86.23±9.18a 89.02±7.27b <0.001
SBP, mm Hg 118.27±15.29 125.71±17.20a 124.94±14.09b 0.054
DBP, mm Hg 73.51±11.11 73.11±12.48 75.16±10.18 0.556
FPG Glc0, mg/dL 91.68±5.78 104.38±5.78a 116.3±4.70b,c <0.001
Glc30, mg/dL 147.79±25.03 174.51±42.26a 195.33±28.73b,c <0.001
Glc120, mg/dL 105.14±19.93 151.73±53.02a 179.28±37.29b,c <0.001
Ins0, μIU/mL 8.32±2.63 10.16±2.63a 10.29±4.50b 0.046
Ins30, μIU/mL 51.04±29.29 51.41±29.70 46.47±37.80 0.708
Ins120, μIU/mL 36.37±25.64 67.67±44.76a 69.48±57.39b 0.007
HOMA-IR 1.89±0.63 2.62±1.15a 2.95±1.30b <0.001
Matsuda index 7.03±2.70 5.02±2.46a 4.74±2.21b <0.001
GUTT ISI 50.89±9.98 36.55±14.23a 32.43±13.50b <0.001
HOMA-B 108.87±39.81 88.35±36.48a 69.95±31.11b,c <0.001
IGI 1.00±0.99 0.69±0.49a 0.46±0.48b,c 0.001
DI 6.26±6.08 3.40±2.51a 1.33±1.65b,c <0.001
AUC Glc0–30 197.30±23.05 229.86±35.41a 256.93±25.03b,c <0.001
AUC Ins0–30 890.26±461.85 929.90±483.49 848.69±602.73 0.761
AUCR30 4.58±2.45 4.05±1.92 3.31±2.29 0.021
AUC Glc0–120 823.11±109.32 1021.42±198.68a 1,170.95±199.03b,c <0.001
AUC Ins0–120 4,917.71±2,572.32 6,280.68±3,300.33 5,651.65±3,713.21 0.325
AUCRIns/Glc 6.10±3.23 6.10±2.67 4.86±3.09 0.117
C-peptide, ng/mL 1.65±0.56 2.11±0.71a 2.35±0.90b <0.001
HbA1c, % 5.53±0.35 5.88±0.47a 6.14±0.43b,c <0.001
TC, mg/dL 188.43±37.80 206.55±41.35 203.67±44.86b 0.119
TG, mg/dL 82.33±41.30 159.66±151.30a 147.03±86.42b 0.002
HDL-C, mg/dL 60.13±15.28 54.96±13.51 52.21±14.22b 0.025
LDL-C, mg/dL 109.75±31.08 126.53±39.05a 128.77±39.52b 0.075
hs-CRP, mg/L 0.11±0.15 0.10±0.10 0.13±0.16 0.671
AST, IU/L 20.38±5.61 26.86±10.13a 27.64±9.34b <0.001
ALT, IU/L 20.12±13.72 30.59±20.34a 29.84±20.16b 0.029
Overt DM, % - 13.3 38.5c 0.004
Values are presented as mean±standard deviation.
NGT, normal glucose tolerance; FPG, fasting plasma glucose; FHx, family history of diabetes; BMI, body mass index; AC, abdominal circum- ference; SBP, systolic blood pressure; DBP, diastolic blood pressure; Glc30, plasma glucose 30 minutes after glucose intake; Glc120, plasma glucose 120 minutes after glucose intake; Ins0, fasting plasma insulin; Ins30, plasma insulin 30 minutes after glucose intake; Ins120, plasma insulin 120 minutes after glucose intake; HOMA-IR, homeostasis model assessment of insulin resistance; Gutt ISI, Gutt insulin sensitivity index; HOMA- B, homeostasis model assessment of pancreatic β-cell function; IGI, insulinogenic index; DI, oral disposition index; AUC Glc, area under the curve for glucose; AUC Ins, area under the curve for insulin; AUCRIns/Glc, a ratio of the AUC Ins/AUC Glc; HbA1c, glycosylated hemoglobin;
TC, total cholesterol; TG, triglyceride; HDL-C, high density lipoprotein cholesterol; LDL-C, low density lipoprotein cholesterol; hs-CRP, high sensitivity C-reactive protein; AST, aspartate aminotransferase; ALT, alanine aminotransferase; DM, diabetes mellitus.
aP<0.05 NGT vs. group 1, bP<0.05 NGT vs. group 2, cP<0.05 group 1 vs. group 2.
Table 3. Comparison of risk factors between prediabetes and overt diabetes in a subgroup whose fasting glucose was 100 to 125 mg/dL
Characteristic Group 1
(prediabetes) Group 2
(overt diabetes) P value
Number 87 36
Male sex, % 54.0 55.6 1.00
FHx, % 45.1 58.3 0.231
Age, yr 54.52±12.56 57.111±10.27 0.375
BMI, kg/m2 24.85±3.53 25.77±2.31 0.092
AC, cm 87.92±8.66 88.65±6.21 0.495
SBP, mm Hg 124.41±15.23 1,216.97±15.47 0.546 DBP, mm Hg 73.38±10.82 76.61±11.44 0.236 Glc0, mg/dL 110.23±6.70 116.17±6.23 0.000 Glc30, mg/dL 183.65±36.74 200.15±28.51 0.026 Glc120, mg/dL 138.51±34.45 243.36±31.65 0.000 Ins0, μIU/mL 9.79±4.20 11.05±4.67 0.121 Ins30, μIU/mL 51.19±37.90 37.57±21.81 0.120 Ins120, μIU/mL 63.37±55.92 81.59±45.17 0.028
HOMA-IR 2.67±1.18 3.16±1.31 0.022
Matsuda index 5.24±2.39 3.89±1.70 0.012 GUTT ISI 38.64±13.60 22.59±4.79 0.007
HOMA-B 75.76±32.93 76.60±36.22 0.987
IGI 0.61±0.53 0.34±0.30 0.007
DI 2.42±2.46 1.00±0.57 0.000
AUC Glc0–30 242.68±32.38 260.79±26.18 0.010 AUC Ins0–30 918.56±605.37 721.88±368.18 0.176
AUCR30 4.05±1.92 3.31±2.29 0.047
AUC Glc0–120 1,036.33±158.17 1,363.18±138.63 0.000 AUC Ins0–120 5,772.31±3,754.30 6,035.24±3,208.23 0.476
AUCRIns/Glc 5.58±3.16 4.51±2.52 0.194
C-peptide, ng/mL 2.14±0.76 2.53±0.95 0.028
HbA1c, % 5.90±0.43 6.40±0.40 0.000
TC, mg/dL 202.78±42.17 208.75±47.23 0.555 TG, mg/dL 146.71±126.05 162.77±79.45 0.048 HDL-C, mg/dL 54.59±14.63 49.94±12.02 0.124 LDL-C, mg/dL 123.93±38.59 136.91±40.15 0.144
hs-CRP, mg/L 0.12±0.18 0.12±0.12 0.199
Values are presented as mean±standard deviation.
FHx, family history of diabetes; BMI, body mass index; AC, abdomi- nal circumference; SBP, systolic blood pressure; DBP, diastolic blood pressure; FPG Glc0, fasting plasma glucose; Glc30, plasma glucose 30 minutes after glucose intake; Glc120, plasma glucose 120 minutes after (Continued to the next)
glucose intake; Ins0, fasting plasma insulin; Ins30, plasma insulin 30 minutes after glucose intake; Ins120, plasma insulin 120 minutes after glucose intake; HOMA-IR, homeostasis model assessment of insulin resistance; Gutt ISI, Gutt insulin sensitivity index; HOMA-B, homeo- stasis model assessment of pancreatic β-cell function; IGI, insulino- genic index; DI, oral disposition index; AUC Glc, area under the curve for glucose; AUC Ins, area under the curve for insulin; AU-
CRIns/Glc, a ratio of the AUC Ins/AUC Glc; HbA1c, glycosylated he-
moglobin; TC, total cholesterol; TG, triglyceride; HDL-C, high den- sity lipoprotein cholesterol; LDL-C, low density lipoprotein choles- terol; hs-CRP, high sensitivity C-reactive protein.
Table 3. Continued
curve to calculate the optimal cut-off values for each diabetes diagnosis method. The appropriate HbA1c thresholds for FPG
≥126 mg/dL and 2h PG ≥200 mg/dL were 6.2% and 6.1%, re- spectively, which are both lower than the currently used thresh- old of 6.5%. These data are in agreement with previous Korean or American data [12,19,22]. Thus, the current HbA1c criteria have high specificity but low sensitivity, leading to approxi- mately one-third of the patients being misclassified. Conse- quently, individuals with HbA1c levels higher than 6.1% should additionally have the OGTT to more precisely determine their glucose regulation status and receive more appropriate treat- ments. In the case of FPG, the appropriate thresholds for HbA1c ≥6.5% and 2h PG ≥200 mg/dL were 117 and 115 mg/
dL, respectively, which are both ~10 mg/dL lower than the cur- rently used 126 mg/dL. This implies that even if the FPG level is within the IFG range, a further HbA1c check or OGTT is re- quired if the FPG level is on the edge.
Previously, we showed that the appropriate FPG threshold for 2h PG of 200 mg/dL was 110 mg/dL by a previous pooled analysis of Korean epidemiology data [23] and that when the IFG group was further subdivided into stage 1 IFG (FPG 100 to 109 mg/dL) and stage 2 IFG (FPG 110 to 125 mg/dL), stage 2 IFG had a poorer metabolic profile and a higher percentage of people with diabetes by OGTT [18]. Based on this method, we also subdivided the IFG in this study into subgroup 1 (FPG 100 to 109 mg/dL) and subgroup 2 (FPG 110 to 125 mg/dL) and compared them with each other and the normal control group.
We found that in subgroup 2, which had a higher FPG level, the prevalence of diabetes was higher (38.5% vs. 13.3%, P=
0.004). In addition, although there were no significant differ- ences in insulin resistance parameters, HOMA-B, IGI, and DI, which represent β-cell function, were statistically significantly worse in subgroup 2. This indicated that β-cell function, which is the fundamental basis for the progression of diabetes and
Table 4. Logistic regression of risk factors associated with overt diabetes mellitus in the subgroup whose fasting pasma glucose was 100 to 125 mg/dL
Characteristic Univariate Multivariate
Odds ratio (CI) P value Odds ratio (CI) P value
BMI, kg/m2 1.093 (0.97–1.24) 0.157 - -
FPG, mg/dL 1.14 (1.07–1.22) <0.001 - -
HbA1c, % 22.75 (6.12–84.59) <0.001 19.57 (2.40–159.41) 0.005
C-peptide, ng/mL 1.70 (1.06–2.72) 0.027 - -
TG, mg/dL 1.00 (0.99–1.01) 0.490 - -
Matsuda index 0.73 (0.55–0.96) 0.022 0.60 (0.39–0.93) 0.022
IGI 0.254 (0.008–0.82) 0.022 0.054 (0.003–0.912) 0.043
BMI, body mass index; FPG, fasting plasma glucose; HbA1c, glycosylated hemoglobin; TG, triglyceride; IGI, insulinogenic index.
plays an important pathophysiologic role in Asians, including Koreans, can be different between individuals depending on their level of FPG despite being in the IFG range [24,25]. Con- sequently, different diagnostic and treatment approaches could be required for subgroups 1 and 2.
By performing a multiple logistic regression analysis in the IFG group for the potential risk factors included in overt DM criteria after having an OGTT, we showed that HbA1c, the Matsuda index, and IGI showed significant correlations. Thus, OGTT can be utilized to measure a patient’s insulin resistance status and β-cell function to predict the possibility of further diabetes progression and plan a suitable follow-up schedule and education for each patient.
Several limitations exist for this study. First, the number of study participants was low and data were collected from only one hospital, so the applicability of this study to the general population can be narrow. Therefore, further studies should be undertaken to confirm that it is more accurate to use OGTT in addition to FPG or HbA1c tests when diagnosing diabetes.
Second, it is very likely that an IFG patient will additionally have an OGTT due to the customary scheme of a regular medi- cal checkup. This leads to the possibility of a selection bias where patients in an isolated IGT or overt diabetes group with normal FPG and high 2h PG might not be included. In our study, when diabetes was classified based on OGTT, no patient or only 8.3% of the patients, were misclassified as non-diabetic patients by 2h PG and FPG or 2h PG and HbA1c, respectively.
The consequence of this is that it underestimates the percent- age of diabetic patients diagnosed with OGTT, so we speculat- ed that it would have little impact on the overall conclusion of this study.
Third, we did not check hemoglobin (Hb) and hematocrit levels in all subjects. While iron deficiency anemia can increase HbA1c levels in subjects with NGT or prediabetes, hemolytic anemia may decrease the HbA1c value [26,27]. Thus, the Hb level may affect the diagnosis of diabetes based on the HbA1c level.
In conclusion, the concordance rate of the criteria between each method that is used to diagnose diabetes is low. Therefore, considering the risk of chronic diabetic complications due to delayed detection, performing an additional OGTT during regular check-ups for patients with high FPG or HbA1c (FPG
≥110 mg/dL, HbA1c ≥6.1%) to reclassify their glucose regula- tion status and further evaluate their potential of progressing to overt diabetes in order to provide a more suitable individual- ized management is required.
CONFLICTS OF INTEREST
No potential conflict of interest relevant to this article was re- ported.
REFERENCES
1. Task Force Team for Basic Statistical Study of Korean Diabetes Mellitus of Korean Diabetes Association, Park Ie B, Kim J, Kim DJ, Chung CH, Oh JY, Park SW, Lee J, Choi KM, Min KW, Park JH, Son HS, Ahn CW, Kim H, Lee S, Lee IB, Choi I, Baik SH. Diabetes epidemics in Korea: reappraise nationwide survey of diabetes “diabetes in Korea 2007”. Diabetes Metab J 2013;37:
233-9.
2. Guariguata L, Whiting DR, Hambleton I, Beagley J, Linnen-
kamp U, Shaw JE. Global estimates of diabetes prevalence for 2013 and projections for 2035. Diabetes Res Clin Pract 2014;
103:137-49.
3. Wild S, Roglic G, Green A, Sicree R, King H. Global prevalence of diabetes: estimates for the year 2000 and projections for 2030.
Diabetes Care 2004;27:1047-53.
4. Jeon JY, Ko SH, Kwon HS, Kim NH, Kim JH, Kim CS, Song KH, Won JC, Lim S, Choi SH, Jang MJ, Kim Y, Oh K, Kim DJ, Cha BY; Taskforce Team of Diabetes Fact Sheet of the Korean Diabe- tes Association. Prevalence of diabetes and prediabetes accord- ing to fasting plasma glucose and HbA1c. Diabetes Metab J 2013;
37:349-57.
5. Chen L, Magliano DJ, Zimmet PZ. The worldwide epidemiolo- gy of type 2 diabetes mellitus: present and future perspectives.
Nat Rev Endocrinol 2012;8:228-36.
6. Holman RR, Paul SK, Bethel MA, Matthews DR, Neil HA. 10- year follow-up of intensive glucose control in type 2 diabetes.
N Engl J Med 2008;359:1577-89.
7. Gaede P, Lund-Andersen H, Parving HH, Pedersen O. Effect of a multifactorial intervention on mortality in type 2 diabetes.
N Engl J Med 2008;358:580-91.
8. Herman WH, Hoerger TJ, Brandle M, Hicks K, Sorensen S, Zhang P, Hamman RF, Ackermann RT, Engelgau MM, Ratner RE; Diabetes Prevention Program Research Group. The cost- effectiveness of lifestyle modification or metformin in prevent- ing type 2 diabetes in adults with impaired glucose tolerance.
Ann Intern Med 2005;142:323-32.
9. American Diabetes Association. (2) Classification and diagno- sis of diabetes. Diabetes Care 2015;38(Suppl 1):S8-16.
10. Genuth S, Alberti KG, Bennett P, Buse J, Defronzo R, Kahn R, Kitzmiller J, Knowler WC, Lebovitz H, Lernmark A, Nathan D, Palmer J, Rizza R, Saudek C, Shaw J, Steffes M, Stern M, Tu- omilehto J, Zimmet P; Expert Committee on the Diagnosis and Classification of Diabetes Mellitus. Follow-up report on the di- agnosis of diabetes mellitus. Diabetes Care 2003;26:3160-7.
11. Bartoli E, Fra GP, Carnevale Schianca GP. The oral glucose tol- erance test (OGTT) revisited. Eur J Intern Med 2011;22:8-12.
12. Lee H, Oh JY, Sung YA, Kim DJ, Kim SH, Kim SG, Moon S, Park Ie B, Rhee EJ, Chung CH, Kim BJ, Ku BJ. Optimal hemo- globin A1C cutoff value for diagnosing type 2 diabetes mellitus in Korean adults. Diabetes Res Clin Pract 2013;99:231-6.
13. Matthews DR, Hosker JP, Rudenski AS, Naylor BA, Treacher DF, Turner RC. Homeostasis model assessment: insulin resis- tance and beta-cell function from fasting plasma glucose and insulin concentrations in man. Diabetologia 1985;28:412-9.
14. Matsuda M, DeFronzo RA. Insulin sensitivity indices obtained from oral glucose tolerance testing: comparison with the eug- lycemic insulin clamp. Diabetes Care 1999;22:1462-70.
15. DeFronzo RA, Matsuda M. Reduced time points to calculate the composite index. Diabetes Care 2010;33:e93.
16. Gutt M, Davis CL, Spitzer SB, Llabre MM, Kumar M, Czar- necki EM, Schneiderman N, Skyler JS, Marks JB. Validation of the insulin sensitivity index (ISI(0,120)): comparison with oth- er measures. Diabetes Res Clin Pract 2000;47:177-84.
17. Utzschneider KM, Prigeon RL, Faulenbach MV, Tong J, Carr DB, Boyko EJ, Leonetti DL, McNeely MJ, Fujimoto WY, Kahn SE. Oral disposition index predicts the development of future diabetes above and beyond fasting and 2-h glucose levels. Dia- betes Care 2009;32:335-41.
18. Oh JY, Lim S, Kim DJ, Kim NH, Kim DJ, Moon SD, Jang HC, Cho YM, Song KH, Ahn CW, Sung YA, Park JY, Shin C, Lee HK, Park KS; Committee of the Korean Diabetes Association on the Diagnosis and Classification of Diabetes Mellitus. A re- port on the diagnosis of intermediate hyperglycemia in Korea:
a pooled analysis of four community-based cohort studies. Di- abetes Res Clin Pract 2008;80:463-8.
19. Kramer CK, Araneta MR, Barrett-Connor E. A1C and diabe- tes diagnosis: the Rancho Bernardo Study. Diabetes Care 2010;
33:101-3.
20. Lu ZX, Walker KZ, O’Dea K, Sikaris KA, Shaw JE. A1C for screening and diagnosis of type 2 diabetes in routine clinical practice. Diabetes Care 2010;33:817-9.
21. World Health Organization. Use of glycated haemoglobin (HbA1c) in the diagnosis of diabetes mellitus: abbreviated report of a WHO consultation. Geneva: World Health Organization;
2011.
22. Kim JM, Hong JW, Won JC, Noh JH, Ko KS, Rhee BD, Kim DJ.
Glycated hemoglobin value for fasting plasma glucose of 126 mg/dL in Korean: the 2011 Korea National Health and Nutri- tion Examination Survey. Diabetes Metab J 2014;38:480-3.
23. Oh JY, Lim S, Kim DJ, Kim NH, Kim DJ, Moon SD, Jang HC, Cho YM, Song KH, Park KS; Committee of the Korean Diabe- tes Association on the Diagnosis and Classification of Diabetes Mellitus. The diagnosis of diabetes mellitus in Korea: a pooled analysis of four community-based cohort studies. Diabet Med 2007;24:217-8.
24. Yoon KH, Lee JH, Kim JW, Cho JH, Choi YH, Ko SH, Zimmet P, Son HY. Epidemic obesity and type 2 diabetes in Asia. Lan- cet 2006;368:1681-8.
25. Nolan CJ, Damm P, Prentki M. Type 2 diabetes across genera-
tions: from pathophysiology to prevention and management.
Lancet 2011;378:169-81.
26. English E, Idris I, Smith G, Dhatariya K, Kilpatrick ES, John WG. The effect of anaemia and abnormalities of erythrocyte indices on HbA1c analysis: a systematic review. Diabetologia 2015;58:1409-21.
27. Hong JW, Ku CR, Noh JH, Ko KS, Rhee BD, Kim DJ. Association between the presence of iron deficiency anemia and hemoglobin A1c in Korean adults: the 2011-2012 Korea National Health and Nutrition Examination Survey. Medicine (Baltimore) 2015;94:
e825.