D I A B E T E S & M E T A B O L I S M J O U R N A L
This is an Open Access article distributed under the terms of the Creative Commons Attribution Non-Commercial License (https://creativecommons.org/licenses/by-nc/4.0/) which permits unrestricted non-commercial use, distribution, and reproduction in any medium, provided the original work is properly cited.
Body Fat Is Related to Sedentary Behavior and Light Physical Activity but Not to Moderate-Vigorous
Physical Activity in Type 2 Diabetes Mellitus
Keun Hee An1,*, Kyung Ah Han2,*, Tae Seo Sohn3, Ie Byung Park4, Hae Jin Kim5, Sung Dae Moon6, Kyung Wan Min2
1Department of Sports Science, Daejin University, Pocheon,
2Department of Internal Medicine, Eulji University School of Medicine, Daejeon,
3Department of Internal Medicine, College of Medicine, The Catholic University of Korea, Seoul,
4Department of Endocrinology of Metabolism, Gachon University College of Medicine, Incheon,
5Department of Endocrinology and Metabolism, Ajou University School of Medicine, Suwon,
6Division of Endocrinology and Metabolism, Department of Internal Medicine, College of Medicine, The Catholic University of Korea, Seoul, Korea
Background: Sedentary behavior (SB) has emerged as a new risk factor for cardiovascular accidents. We investigated whether physical activity levels or SB were related to percent body fat (%BF) in type 2 diabetes mellitus (T2DM).
Methods: In this cross sectional study, we measured the duration of SB, light physical activity (LPA), moderate to vigorous physi- cal activity (MVPA), total energy expenditure, and step counts using a wireless activity tracker (Fitbit HR; FB) for 7 days in free- living conditions, along with %BF using a bio impedance analyzer (Inbody; Biospace) in 120 smartphone users with T2DM. Sub- jects were divided into exercise (Exe, n=68) and non-exercise (nonExe, n=52) groups based on self-reports of whether the rec- ommended exercises (30 min/day, 3 days/week for 3 months) were performed. SBt, LPAt, MVPAt were transformed from SB, LPA, MVPA for normally distributed variables.
Results: Participants were: female, 59.2%; age, 59.3±8.4 years; body mass index, 25.5±3.4 kg/m2; glycosylated hemoglobin (HbA1c), 7.6%±1.2%; %BF, 30.4%±7.1%. They performed SB for 15.7±3.7 hr/day, LPA for 4.4±1.7 hr/day, and MVPA for 0.9±0.8 hr/day. The %BF was related to SBt and LPAt, but not to MVPA after adjustments for age, gender, and HbA1c. VPA was significantly higher in the Exe group than in the nonExe group, but SB, LPA, and moderate physical activity were not different.
Predicted %BF was 89.494 to 0.105 (age), –13.047 (gender), –0.507 (HbA1c), –7.655 (LPAt) (F[4, 64]=62.929, P<0.001), with an R2 of 0.785 in multiple linear regression analysis.
Conclusion: Reduced body fat in elderly diabetic patients might be associated with reduced inactivity and increased LPA.
Keywords: Body fat distribution; Diabetes mellitus, type 2; Exercise; Sedentary behavior
Corresponding author: Kyung Wan Min https://orcid.org/0000-0003-2266-9795 Department of Internal Medicine, Eulji University School of Medicine, 77 Gyeryong-ro 771beon-gil, Jung-gu, Daejeon 34824, Korea
E-mail: [email protected]
INTRODUCTION
Consensus exists regarding type 2 diabetes mellitus (T2DM) that increased physical activity (PA) is an essential component in the prevention of weight gain and managing obesity [1].
Fatty acid oxidation during exercise is associated with insulin sensitivity, metabolic flexibility, and body fat mass [2,3]. Re-
searchers have continuously been interested in identifying the exercise level at which effective fat oxidation occurs. Irving et al. [4] reported that 16-week of high-intensity exercise reduced visceral fat in overweight patients with metabolic syndrome, and that fatty acid metabolism occurs during moderate-inten- sity, rather than high-intensity, exercise. Accordingly, moder- ate to vigorous physical activity (MVPA) for more than 150 https://doi.org/10.4093/dmj.2019.0029
pISSN 2233-6079 · eISSN 2233-6087
minutes per week for T2DM patients was recommended in 2010 [5]. However, it was found that peripheral lipolysis occurs even at 25% of VO2 max [6] and thus, it is difficult to identify the exercise intensity level at which lipolysis occurs.
According to a report by National Health and Nutrition Ex- amination Survey, the average duration of MVPA is less than an hour per day, and people spend 15 to 16 hours a day (ex- cluding sleep hours) performing light physical activity (LPA) or have sedentary behavior (SB) [7]. Since that report was pub- lished, researchers have developed interests in LPA and SB, the activities that people spend most of their active time on. Sed- entary Behavior Research Network [8] views that not only PA volume and intensity, but also all physical activities including SB are linked to metabolic syndrome, and suggests the need to conduct research on physical inactivity. The network defines SB as behavior with energy expenditure under 1.5 metabolic equivalents (METs) like watching TV and laying down, and argues that an increase in physical inactivity including SB is a critical risk factor for obesity and T2DM. However, most of the aforementioned studies were conducted on people without di- abetes.
Recently, the American Diabetes Association (ADA) [9]
identified SB as a risk factor for cardiovascular disease and rec- ommended a reduction in SB in daily life. Clinical recommen- dations in another study [10] stressed that SB is a factor inde- pendent of exercise and a plan to reduce SB should be included for adiposity and glycemic control.
Most studies on the SB of T2DM patients found that SB is associated with abnormal glucose metabolism and metabolic risk factors and concluded that SB has a high correlation with the risk of cardiovascular disease mortality [11-13]. A study reported that SB was significantly correlated with body mass index (BMI) and waist circumference [14], and another study emphasized that the number of breaks in sedentary time (ST) should be increased to prevent central obesity [15]. However, these studies did not measure percent body fat (%BF) but used BMI or waist circumference as a risk factor. %BF is a better predictor of cardiovascular risk factors than BMI [16]. It would be of significance to investigate whether ST is an effective in- dex associated with %BF even after adjusting for MVPA, and whether LPA independently influences %BF.
To evaluate ST, PA data should be collected for 24 hours. In most previous studies, PA was measured using self-reported data, which primarily recorded PA of moderate or higher in- tensity. However, in self-reports, it is difficult to precisely dis-
tinguish between SB and LPA [17]. More recent studies have used PA trackers to accurately measure activity level as well as volume [18]. Among wearable devices, wristbands connected to a smartphone are simple to wear and can be utilized as an effective research tool to identify PA patterns over an entire day [19]. Research using bio impedance analyzer, one of the methods for measuring body fat, is actively being conducted, and its validity and reliability are being verified [20,21].
Accordingly, the present study was conducted to examine whether adult T2DM patients perform sufficient amount of exercise, based on self-reported survey-data and cross-section- al analysis. Further, we investigated PA in free-living condi- tions of daily life using wearable devices as a research tool to extensively classify PA into different types, identify PA pat- terns, and analyze its correlations with %BF. The PA categories used in this study were LPA, moderate physical activity (MPA), and VPA.
METHODS
Ethics approval and consent to participate
The study was approved by the Institutional Review Boards of Eulji University and Catholic University School of Medicine (reference number: 16-62). Subjects were informed of the study plan, and they signed a written consent form prior to participating.
Study subjects
Study subjects were 120 diabetes patients aged between 40 and 82 years, treated at the diabetes center of one of the three uni- versity hospitals. The following patients were excluded from the study: those who had gait difficulty, who exercised in water causing difficulties in wearing a wearable device, who mostly exercised for the upper body (e.g., table tennis), and those who performed the type of PA which are difficult to measure with an accelerometer for various reasons. Additionally, patients with the following histories were excluded: myocardial infarc- tion, type 1 diabetes mellitus, gestational diabetes, diabetic ke- toacidosis, osteoporosis, degenerative arthritis, cancer, or un- controlled high blood pressure (BP >160/90 mm Hg).
Investigation of PA
For self-reports, subjects were instructed to create daily records of the type, time, and frequency of PAs they regularly per- formed, as well as waking-up and sleep times. Those who re-
sponded that they performed regular PAs for at least 30 min- utes per day for three or more times per week in the past 3 months were classified in the exercise group and those who did not were classified in the non-exercise group; PA was com- pared between the groups.
To monitor PA, subjects were instructed to wear Fitbit ChargeHR (Fitbit Inc., San Francisco, CA, USA), a triaxial ac- celerometer-based wearable device, in the non-dominant wrist for 7 days (24 hours a day) continuously to measure PA levels throughout the period. The rate of omission was computed for cases in which data were omitted by disconnecting the smart- phone from bluetooth [22,23].
In this study, SB included sleeping and the number of sleep hours was based on self-reports. PA type was defined using ab- solute intensity. Specifically, SB was defined as <1.5 METs, LPA as 1.5 METs or higher but lower than 3, MPA as 3 METs or higher but lower than 6, and VPA as 6 METs or higher [24].
The duration of time spent in each PA type was automatically recorded by the device, as along with total PA volume, total en- ergy expenditure (TEE), and the step counts. Relative intensity of activity measured on the basis of heart rate was automatical- ly categorized into 50% to 69% maximal heart rate (HRmax), 70% to 84% HRmax, and ≥85% HRmax, and the duration of time spent in each category was recorded. MVPA was calculat- ed as the sum of MPA and VPA.
Anthropometric measurements and body composition Subjects were given medical history taking and examinations to assess combined illnesses. Their height and weight were measured while the subjects were wearing a thinlayer of cloth- ing; waist circumference was measured using a tape measure- around the thinnest part between the bottom of rib cage and il- iac crest, with participants standing in a comfortable position.
BMI was calculated in kg/m2. Subjects stood barefoot and with light clothing on top of the base components of a bio imped- ance analyzer (Inbody; Biospace, Seoul, Korea) with both feet and both thumbs positioned on the electrodes and the arms away from the body approximately at 15°. Subjects maintained the posture until the measurements were completed in about 3 to 5 minutes. The measured fat mass (kg) was automatically di- vided by body weight to compute %BF.
Fasting plasma glucose was measured by a method assessing glucose oxidation (COBAS intra800; Roche, Basel, Switzer- land) after the subjects fasted for 8 hours following dinner the previous night, and glycosylated hemoglobin (HbA1c) was
also evaluated. BP was measured using a mercury sphygmo- manometer (Yamasu; Kenzmedico, Saitama, Japan) after sub- jects rested for 10 minutes while sitting.
Statistical analysis
Statistical analysis was performed using SPSS for windows ver- sion 20.0 (IBM Co., Armonk, NY, USA). For each variable, the mean and standard deviation were computed. Differences in gender ratios between exercise and non-exercise groups were examined using crosstabs, and between-group comparisons were made by analysis of covariance (ANCOVA), with age, gender, and HbA1c as covariates. Normality of the distribu- tions of %BF, SB, and LPA was tested with the Kolmogorov- Smirnov test. The normality assumption was not met in SB and LPA. Thus, SB values were transformed using reflect and square root transformation and LPA and MVPA values were log-transformed. Transformed SB, LPA, and MVPA were not- ed as SBt, LPAt, and MVPAt, respectively.
The correlation between %BF and each of SB, LPA, and MVPA was evaluated by computing partial correlation coeffi- cients after controlling age, gender, and HbA1c. Additionally, hierarchical multiple linear regression was performed with age, gender, and HbA1c as confounding variables (Model 1).
To predict %BF, various combinations of PA types were added to the regression model and changes in R2 were inspected. In addition, the un-standardized (B) and standardized (β) coeffi- cients, as well as significance of the predictor variables were computed.
Prior to conducing hierarchical multiple regression, the rele- vant assumptions of this statistical analysis were tested. Signifi- cant multicollinearity was found between SB and LPA. Statisti- cal significance was determined by P values less than 0.05.
RESULTS
General participant characteristics
The total number of subjects was 120, with 49 men (40.8%) and 71 women (59.2%). Sixteen subjects (13.3%) were in their 40’s, 47 (39.3%) in 50’s, 43 (35.8%) in 60’s, 13 (10.8%) in 70’s, and one (0.8%) in 80’s. The mean age of study subjects was 59.3 years. In our study, 47.5% of subjects were aged >60 years. The most common age group was 50’s and 60’s, constituting 75.1%
of the study sample. The mean BMI was 25.5 kg/m2; 68.7% of subjects had a BMI ≥23 kg/m2, the criterion for obesity used in Korea. Further, 58.3% had a BMI ≥25 kg/m2 and 8.7% had a
BMI ≥30 kg/m2.
Regarding treatment approaches to control blood sugar lev- els, 75.8% used oral anti-diabetic drugs, 9.2% used insulin only, 6.7% used insulin in combination with oral anti-diabetic drugs, and 8.3% controlled diabetes with diet and exercise only. With respect to risk factors for macrovascular complications of dia- betes, 46.2% had hypertension, 44.5% hyperlipidemia.
Comparisons of SB, PA, and body composition between self-reported exercise and non-exercise groups
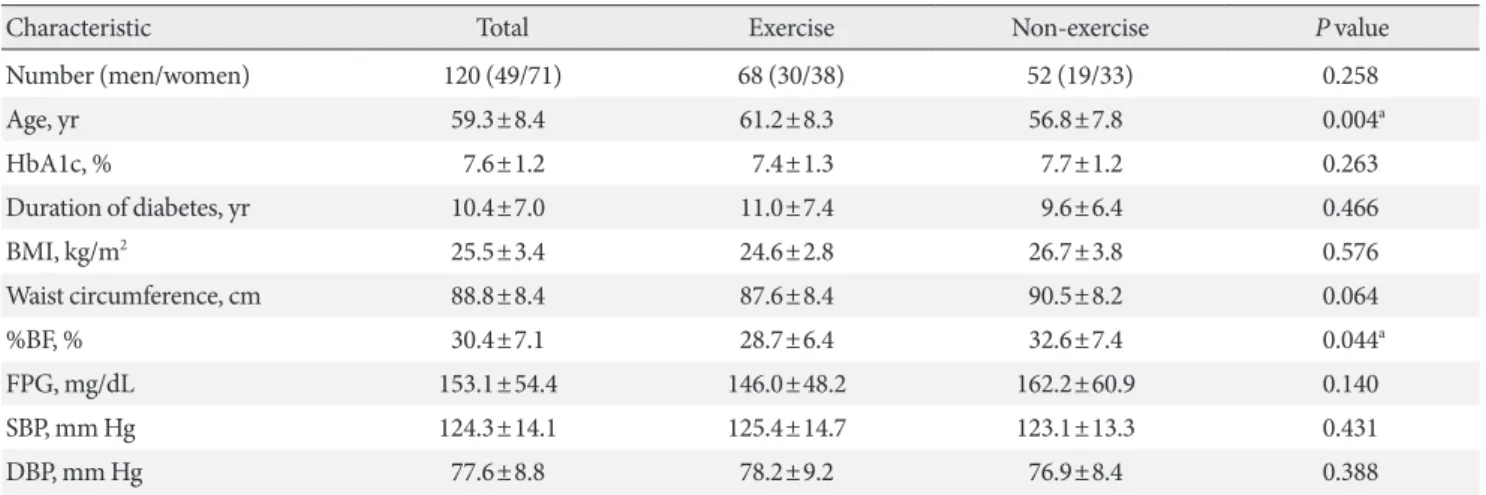
Of the 120 T2DM patients, 68 (56.7%) self-reported that they exercised for at least 30 minutes per day for 3 days per week for the past 3 months or longer and they were categorized in the exercise group. The remaining 52 (43.3%) were categorized in the non-exercise group. Gender ratio was not different be- tween the two groups (P=0.258) (Table 1). Age was higher in the exercise group, but there was no between-group difference in BMI, HbA1c, or the duration of disease. %BF was slightly lower in the exercise group (P=0.044) (Table 1).
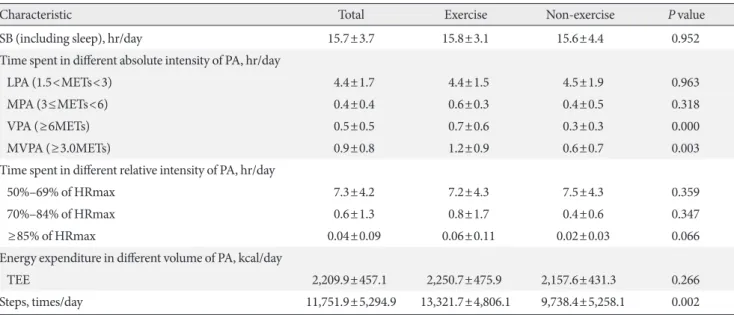
Mean rate of omission due to device failure was 23.1%. SB, which included sleep hours, did not show a significant differ- ence between the exercise and non-exercise groups. LPA and MPA were also not different between the groups. However, VPA was significantly higher in the exercise group (P<0.001), and so was MVPA as well as the sum of MPA and VPA (P=0.003). Rel- ative intensity measured using heart rate (% HRmax) was not
significantly different between the groups. Daily mean step count (steps/day) was significantly higher in the exercise group (P=0.002) (Table 2).
Correlations between %BF and SB or PA
After age, gender, and HbA1c were controlled, SBt was found to be negatively correlated with body fat (R=–0.651, P<0.001) (Fig. 1). This finding suggests that higher the SB, higher the body fat, because SB was transformed using reflect and square root transformation. LPAt was also negatively correlated with body fat (R=–0.697, P<0.001), indicating that higher the LPA, the higher the body fat (Fig. 1). Neither MVPA nor TEE were correlated with body fat.
SBt and LPAt strongly correlated with each other (R=0.908, P<0.001), suggesting that an increase in SB is closely related to a decrease in LPA.
Predictor modeling for %BF
Significant multicollinearity between SBt and LPAt was ob- served in the initial analysis of hierarchical multiple linear re- gression (Table 3). Hence, the two variables were not simulta- neously included in subsequent models, and were entered in Model 1 with gender, age, and HbA1c as predictors (a control model), one at a time. In Model 2, in which SBt was added to Model 1, SBt had a significant negative relationship with %BF (β=–0.416, P<0.001), and R2 changed by 0.167. In other words,
Table 1. Physical and biochemical characteristics of the subjects
Characteristic Total Exercise Non-exercise P value
Number (men/women) 120 (49/71) 68 (30/38) 52 (19/33) 0.258
Age, yr 59.3±8.4 61.2±8.3 56.8±7.8 0.004a
HbA1c, % 7.6±1.2 7.4±1.3 7.7±1.2 0.263
Duration of diabetes, yr 10.4±7.0 11.0±7.4 9.6±6.4 0.466
BMI, kg/m2 25.5±3.4 24.6±2.8 26.7±3.8 0.576
Waist circumference, cm 88.8±8.4 87.6±8.4 90.5±8.2 0.064
%BF, % 30.4±7.1 28.7±6.4 32.6±7.4 0.044a
FPG, mg/dL 153.1±54.4 146.0±48.2 162.2±60.9 0.140
SBP, mm Hg 124.3±14.1 125.4±14.7 123.1±13.3 0.431
DBP, mm Hg 77.6±8.8 78.2±9.2 76.9±8.4 0.388
Values are presented as mean±standard deviation. Chi-square test was used for analyzing gender differences between groups. Age and HbA1c were analyzed using independent t-test. Main effect of BMI, %BF, waist circumference, FPG, SBP, and DBP were analyzed using analysis of co- variance (ANCOVA) after adjustment for age, gender, and HbA1c.
HbA1c, glycosylated hemoglobin; BMI, body mass index; %BF, percent body fat; FPG, fasting plasma glucose; SBP, systolic blood pressure; DBP, diastolic blood pressure.
aStatistical significance, P<0.05.
the addition of SBt increased model prediction by 16.7%. In Model 3, in which LPAt was added to Model 1, LPAt had a sig- nificant negative relationship with %BF (β=–0.452, P<0.001).
The magnitude of change in R2 was similar to that when SBt was added to Model 1.
In Model 4, in which MVPAt was added to Model 3, R2 did not change at a statistically significant level. A multiple linear
regression from Model 3 was calculated to predict %BF based on their age, gender, HbA1c, SB, and LPA. A significant regres- sion equation was found (F [4, 64]=62.929, P<0.001), with an R2 of 0.785. The predicted %BF was equal to 89.494–0.105 (age), –13.047 (gender), –0.507 (HbA1c), –7.655 (LPAt), wheregend- er was coded as 1=men, 2=women, and LPAt was calculated by log transformation of LPA in minutes.
Table 2. Activity monitoring derived (in)activity characteristics of participants
Characteristic Total Exercise Non-exercise P value
SB (including sleep), hr/day 15.7±3.7 15.8±3.1 15.6±4.4 0.952
Time spent in different absolute intensity of PA, hr/day
LPA (1.5<METs<3) 4.4±1.7 4.4±1.5 4.5±1.9 0.963
MPA (3≤METs<6) 0.4±0.4 0.6±0.3 0.4±0.5 0.318
VPA (≥6METs) 0.5±0.5 0.7±0.6 0.3±0.3 0.000
MVPA (≥3.0METs) 0.9±0.8 1.2±0.9 0.6±0.7 0.003
Time spent in different relative intensity of PA, hr/day
50%–69% of HRmax 7.3±4.2 7.2±4.3 7.5±4.3 0.359
70%–84% of HRmax 0.6±1.3 0.8±1.7 0.4±0.6 0.347
≥85% of HRmax 0.04±0.09 0.06±0.11 0.02±0.03 0.066
Energy expenditure in different volume of PA, kcal/day
TEE 2,209.9±457.1 2,250.7±475.9 2,157.6±431.3 0.266
Steps, times/day 11,751.9±5,294.9 13,321.7±4,806.1 9,738.4±5,258.1 0.002
Values are presented as mean±standard deviation. P<0.05 with analysis of covariance (ANCOVA), main effect after age, gender, and glycosylat- ed hemoglobin adjustments.
SB, sedentary behavior; PA, physical activity; LPA, light physical activity; MET, metabolic equivalent; MPA, moderate physical activity; VPA, vigorous physical activity; MVPA, moderate to vigorous physical activity; HRmax, maximal heart rate (220–age); TEE, total energy expenditure.
Fig. 1. Correlation between percent body fat (%BF) and (A) sedentary behavior (SB) and (B) light physical activity (LPA) trans- formed SB was calculated by reflect and square root. LPA was transformed by logarithm.
50 40 30 20 10 0
50 40 30 20 10 0
%BF %BF
4.5 5.0 5.5 6.0 6.5 7.0 4.5 5.0 5.5 6.0 6.5
Transformed SB minutes A Logarithmic transformed LPA B
DISCUSSION
One of major causes of death in T2DM patients is cardiovascu- lar disease. Many studies have reported that among everyday habits, exercising regularly and decreasing SB help in prevent- ing cardiovascular disease. It is also reported that among vari- ous body components, body fat is associated with the develop- ment of cardiovascular disease. However, research on the rela- tionship between the level of SB and %BF is very limited, and most previous studies were conducted on healthy people who did not have diabetes [18,25]. T2DM patients may lose weight, as blood sugar is eliminated through urination when the sugar level is extremely high, and anti-diabetic drugs can also affect weight and %BF. Therefore, the results of studies conducted with healthy people cannot be generalized to T2DM patients.
Accordingly, the present study aimed to investigate the rela- tionship between %BF and the PA duration of various intensi- ties (including SB) in T2DM patients.
In our study, 68.7% of subjects had a BMI ≥23 kg/m2, the cri- terion for obesity used in Korea. Further, most subjects were obese, but their blood sugar level was relatively under control.
Further, the daily mean of SB including sleep, was 15.7 hr/day in (64.1% of 24 hours in a day) and was not significantly different between the two gender groups (Table 2). A journal with wake and sleep times was maintained by 33 subjects, and their daily mean sleep duration was 7.5 hr/day. Thus, the daily mean of SB excluding sleep is estimated to be approximately 8.2 hr/day. In
a study conducted on T2DM patients with a methodology similar to the present study, Guo et al. [26] reported that the daily mean of SB, not including sleep (8.2 to 8.4 hr/day), was 10.5 to 11.1 hr/day, which is higher than the present study’s finding. We speculate that SB volume was higher in their study because their SB criterion (under 1.8 MET) was somewhat higher than the criterion used in this study. Other studies have reported a daily mean SB in T2DM patients of 8.1 [15], 8.9 [27], 10.1 [28], and 11.6 hr/day (accelerometer) [10], respec- tively. These findings are similar or higher compared to the present study’s finding, suggesting that the subjects in our study had a tendency of reduced SB.
Literature on the relationship between SB and %BF is very limited, and studies that did examine the relationship were conducted in healthy people. In a study conducted with non- DM elderly people, LPA of 1.5 to 2 METs and SB under 1.5 METs were associated with BMI but activity of over 2 METs was not [18]. In contrast, a study conducted on children and adolescents found that non-ST spent doing activities over 2 METs was negatively correlated with body fat mass [25]. These findings suggest that in young people, activity of moderate or higher intensity is associated with body fat, whereas in elderly, lower-intensity activity is linked with obesity.
With aging, activity volume generally decreases and accord- ing to a study, SB increases by 2 hours in people aged 70 years or older compared to people in their 30’s [29]. As low-intensity activity volume increases with aging, it is critical to evaluate Table 3. Summary of hierarchical regression analysis for variables predicting %BF
Variable Model 1 Model 2 Model 3 Model 4
B Beta P value B Beta P value B Beta P value B Beta P value
Age 0.058 0.064 0.428 0.036 0.040 0.581 –0.105 –0.118 0.040 –0.094 –0.106 0.066
Gender –12.476 0.790 0.000 –12.353 –0.782 0.000 –13.047 –0.871 0.000 –12.871 –0.860 0.000 HbA1c 0.699 –0.123 0.124 –0.779 –0.137 0.056 –0.507 –0.086 0.135 –0.554 –0.094 0.101
SBt –5.602 –0.293 0.000
LPAt –7.655 –0.452 0.000 –7.535 –0.445 0.000
MVPAt –0.172 –0.083 0.153
R2 0.606 0.773 0.797 0.804
Change in R2 0.167 0.167 2.087
Sig F change 0.000 0.000 0.186
Predictors in Model 1: age, gender, HbA1c; Predictors in Model 2: age, gender, HbA1c, SBt; Predictors in Model 3: age, gender, HbA1c, LPAt;
Predictors in Model 4: age, gender, HbA1c, LPAt, MVPAt.
%BF, percent body fat; HbA1c, glycosylated hemoglobin; SBt, transformed sedentary behavior; LPAt, transformed light physical activity;
MVPAt, transformed moderate to vigorous physical activity.
whether the time is spent on light exercise or on being seden- tary. In a study that investigated the effects of reduced SB on the risks of obesity and diabetes [30], it was found that as SB increased by 2 hours, obesity risk (BMI ≥30 kg/m2) increased by 23% and T2DM risk by 14%, whereas behaviors breaking SB (such as standing and walking in the house) decreased obe- sity risk by 9% and T2DM risk by 12%. Thus, reducing SB would lower the risks of obesity and T2DM. The present study showed that with an increase in body fat, the level of SB also increased, after adjusting for factors affecting %BF (age, gen- der, and HbA1c).
The American College of Sports Medicine [31] recommends slow walking in the house, store, and office (2.0 METs), light work (2.0 to 2.5 METs), walking at an average speed of 4.8 km/hr or less (<3.0 METs), and house cleaning and car washing (3.0 METs), as examples of LPA. This recommendation suggests that LPA can not only be performed as exercise, but physical movement in daily life is also regarded as LPA. Daily mean LPA of the subjects in the present study was 4.4 hr/day, constituting 18.3% of 24 hours in a day. This finding is relatively lower than what Hansen et al. [32] reported (5.4 hr/day) (Table 2). LPA and %BF were inversely correlated with each other. Thus, more the amount of time spent on light physical movement, lower the body fat. Daily mean MVPA (i.e., PA of moderate or higher intensity that have generally been defined as exercise) was 0.9 hr/day, indicating that the subjects had sufficient exercise vol- ume in accordance with the ADA guidelines (150 minutes or more per week). Of various PA levels, MVPA was higher in this study than in a previous study conducted on T2DM patients [10] (MVPA 12.4 min/day) and another study conducted on overweight or obese T2DM patients [14] (MVPA 17.9 min/day), suggesting that the subjects were engaged in MVPA at suffi- cient levels. Analysis of data obtained through the wearable device also showed that even people in the non-exercise group, who self-reported that they did not exercise enough, per- formed MVPA (the criterion used to determine exercise vs.
non-exercise group) for 30 min/day or longer. This finding may be interpreted in several ways. First, diabetes education services provided at hospitals such as individualized recom- mendations regarding exercise and diet, and one or more ses- sions of diabetes education in a small-group setting may have increased PA, even though all subjects were advised to perform activities as they normally would. In addition, being monitored by the hospital may have further motivated the subjects to be active and perform more exercise while wearing a PA tracker.
Hence it was likely that subjects may have been more active in daily activities and exercises [33]. It should also be considered that the type of PA tracker used in the present study tends to misidentify LPA as MVPA compared to other device types [34].
Although MVPA volume was higher in the present study than in the previous studies conducted on T2DM patients, it did not correlate with %BF. Rather, SB and LPA were signifi- cantly correlated with it. The reasons why %BF was different according to LPA level but not according to MPA level are speculated as follows.
Harrington et al. [35] demonstrated that total and regional adiposity are associated with MVPA but not with SB in T2DM patients aged between 37 and 75, while it is associated with SB, but not MVPA in the elderly people aged over 65 years, sug- gesting an age-dependent difference. Their finding is similar to that of the present study in that subjects were on average 60.1 years old and the age group of 50’s and 60’s was the most com- mon. The device used in the present study was a triaxial accel- erometer to measure acceleration of the subject. The measure- ment was not based on heart rate, a conventional approach of measuring acceleration, rather, the intensity of activity mea- sured via the triaxial accelerometer is the absolute intensity. If activity intensity was based on heart rate, it may have been es- timated to be higher. In other words, actual energy expendi- ture could have been higher compared to the low level of PA measured by the accelerometer. Moreover, a study reported that older people with gait or joint problems expend more en- ergy than healthy young people when performing PA at the same absolute intensity level [36]. Scheer et al. [37] reported a significant correlation between %BF and MVPA, a result dif- ferent from the present study’s finding. However, their subjects were, on average, in their 40’s (younger than the present study’s subjects) and did not have DM, while their MVPA on the job and during leisure was higher (2.56 to 3.18 hr/day) than that of the present study’s subjects. In the present study, daily volume of MVPA constituted 6.7% of the time in a day excluding sleep hours (a daily mean of 13.4 hours), while SB and LPA consti- tuted the remaining 93.3%. Given the relatively small volume of MVPA, we speculate that the types of MVPA in the present study were not diverse enough to show differences in body fat.
At the same intensity level of PA, carbohydrate oxidation was higher by 35% and free fatty acid appearance rate, suggesting fat oxidation, was higher by 85% in the elderly compared to young adults [38]. These findings are believed to have to do
with the present study subjects tending to be older, and may explain the influence of relatively low-intensity PA on %BF.
Both LPA and SB showed strong collinearity with %BF. It does not seem that %BF was affected by each activity type indepen- dently. Rather, %BF was determined according to how a day was spent, excluding about 1 hour for exercise, i.e., whether the remaining time in a day was spent performing light movement or sitting and laying down. In general, the survey is used to fol- low-up on whether individuals perform exercise as they were advised. However, in the present study, the analysis of activities of the subjects perceiving themselves as exercising diligently showed that the volume of VPA was higher in the exercise group but there were no between-group differences in SB, LPA, or MPA. In other words, it seemed that patients tended to re- gard VPA as exercise and did not have proper recognition of LPA or SB, the components found to be critical in this study.
Accordingly, an objective approach is required to assess PA in daily life, such as activity monitoring via a wearable device, rather than subjective approaches relying on self-reported sur- veys.
CONFLICTS OF INTEREST
No potential conflict of interest relevant to this article was re- ported.
AUTHOR CONTRIBUTIONS
Conception or design: K.H.A., K.A.H., S.T.S., P.I.B., H.J.K., S.D.M., K.W.M.
Acquisition, analysis, or interpretation of data: K.H.A., K.A.H., S.T.S., P.I.B., H.J.K., S.D.M., K.W.M.
Drafting the work or revising: K.H.A., K.A.H., K.W.M.
Final approval of the manuscript: K.H.A., K.A.H., K.W.M.
ORCID
Keun Hee An https://orcid.org/0000-0002-1540-4708 Kyung Ah Han https://orcid.org/0000-0001-6436-1938 Kyung Wan Min https://orcid.org/0000-0003-2266-9795
ACKNOWLEDGMENTS
None
REFERENCES
1. Stamatakis E, Hirani V, Rennie K. Moderate-to-vigorous physi- cal activity and sedentary behaviours in relation to body mass index-defined and waist circumference-defined obesity. Br J Nutr 2009;101:765-73.
2. Zurlo F, Lillioja S, Esposito-Del Puente A, Nyomba BL, Raz I, Saad MF, Swinburn BA, Knowler WC, Bogardus C, Ravussin E. Low ratio of fat to carbohydrate oxidation as predictor of weight gain: study of 24-h RQ. Am J Physiol 1990;259:E650-7.
3. Robinson SL, Hattersley J, Frost GS, Chambers ES, Wallis GA.
Maximal fat oxidation during exercise is positively associated with 24-hour fat oxidation and insulin sensitivity in young, healthy men. J Appl Physiol (1985) 2015;118:1415-22.
4. Irving BA, Davis CK, Brock DW, Weltman JY, Swift D, Barrett EJ, Gaesser GA, Weltman A. Effect of exercise training intensi- ty on abdominal visceral fat and body composition. Med Sci Sports Exerc 2008;40:1863-72.
5. Colberg SR, Albright AL, Blissmer BJ, Braun B, Chasan-Taber L, Fernhall B, Regensteiner JG, Rubin RR, Sigal RJ; American College of Sports Medicine; American Diabetes Association.
Exercise and type 2 diabetes: American College of Sports Med- icine and the American Diabetes Association: joint position statement. Exercise and type 2 diabetes. Med Sci Sports Exerc 2010;42:2282-303.
6. Romijn JA, Coyle EF, Sidossis LS, Gastaldelli A, Horowitz JF, Endert E, Wolfe RR. Regulation of endogenous fat and carbo- hydrate metabolism in relation to exercise intensity and dura- tion. Am J Physiol 1993;265:E380-91.
7. Young DR, Hivert MF, Alhassan S, Camhi SM, Ferguson JF, Katzmarzyk PT, Lewis CE, Owen N, Perry CK, Siddique J, Yong CM; Physical Activity Committee of the Council on Life- style and Cardiometabolic Health; Council on Clinical Cardi- ology; Council on Epidemiology and Prevention; Council on Functional Genomics and Translational Biology; and Stroke Council. Sedentary behavior and cardiovascular morbidity and mortality: a science advisory from the American Heart Associ- ation. Circulation 2016;134:e262-79.
8. Sedentary Behaviour Research Network. Letter to the editor:
standardized use of the terms “sedentary” and “sedentary be- haviours”. Appl Physiol Nutr Metab 2012;37:540-2.
9. American Diabetes Association. 4. Lifestyle management. Dia- betes Care 2017;40:S33-43.
10. Balducci S, D’Errico V, Haxhi J, Sacchetti M, Orlando G, Cardelli P, Di Biase N, Bollanti L, Conti F, Zanuso S, Nicolucci
A, Pugliese G; Italian Diabetes and Exercise Study 2 (IDES_2) Investigators. Level and correlates of physical activity and sed- entary behavior in patients with type 2 diabetes: a cross-sec- tional analysis of the Italian Diabetes and Exercise Study 2.
PLoS One 2017;12:e0173337.
11. Brazeau AS, Hajna S, Joseph L, Dasgupta K. Correlates of sit- ting time in adults with type 2 diabetes. BMC Public Health 2015;15:793.
12. Hamasaki H, Noda M, Moriyama S, Yoshikawa R, Katsuyama H, Sako A, Mishima S, Kakei M, Ezaki O, Yanai H. Daily physi- cal activity assessed by a triaxial accelerometer is beneficially associated with waist circumference, serum triglycerides, and insulin resistance in Japanese patients with prediabetes or un- treated early type 2 diabetes. J Diabetes Res 2015;2015:526201.
13. Sardinha LB, Magalhaes JP, Santos DA, Judice PB. Sedentary patterns, physical activity, and cardiorespiratory fitness in asso- ciation to glycemic control in type 2 diabetes patients. Front Physiol 2017;8:262.
14. Healy GN, Winkler EA, Brakenridge CL, Reeves MM, Eakin EG. Accelerometer-derived sedentary and physical activity time in overweight/obese adults with type 2 diabetes: cross- sectional associations with cardiometabolic biomarkers. PLoS One 2015;10:e0119140.
15. Cooper AR, Sebire S, Montgomery AA, Peters TJ, Sharp DJ, Jackson N, Fitzsimons K, Dayan CM, Andrews RC. Sedentary time, breaks in sedentary time and metabolic variables in peo- ple with newly diagnosed type 2 diabetes. Diabetologia 2012;
55:589-99.
16. Garcia-Pastor T, Salinero JJ, Sanz-Frias D, Pertusa G, Del Coso J. Body fat percentage is more associated with low physical fit- ness than with sedentarism and diet in male and female ado- lescents. Physiol Behav 2016;165:166-72.
17. Shephard RJ. Limits to the measurement of habitual physical activity by questionnaires. Br J Sports Med 2003;37:197-206.
18. Bann D, Hire D, Manini T, Cooper R, Botoseneanu A, McDer- mott MM, Pahor M, Glynn NW, Fielding R, King AC, Church T, Ambrosius WT, Gill TM; LIFE Study Group. Light intensity physical activity and sedentary behavior in relation to body mass index and grip strength in older adults: cross-sectional findings from the Lifestyle Interventions and Independence for Elders (LIFE) study. PLoS One 2015;10:e0116058.
19. Paul SS, Tiedemann A, Hassett LM, Ramsay E, Kirkham C, Chagpar S, Sherrington C. Validity of the Fitbit activity tracker for measuring steps in community-dwelling older adults. BMJ Open Sport Exerc Med 2015;1:e000013.
20. Wang H, Hai S, Cao L, Zhou J, Liu P, Dong BR. Estimation of prevalence of sarcopenia by using a new bioelectrical imped- ance analysis in Chinese community-dwelling elderly people.
BMC Geriatr 2016;16:216.
21. Kim H, Kim CH, Kim DW, Park M, Park HS, Min SS, Han SH, Yee JY, Chung S, Kim C. External cross-validation of bioelectri- cal impedance analysis for the assessment of body composition in Korean adults. Nutr Res Pract 2011;5:246-52.
22. Chowdhury EA, Western MJ, Nightingale TE, Peacock OJ, Thompson D. Assessment of laboratory and daily energy ex- penditure estimates from consumer multi-sensor physical ac- tivity monitors. PLoS One 2017;12:e0171720.
23. Sasaki JE, Hickey A, Mavilia M, Tedesco J, John D, Kozey Ke- adle S, Freedson PS. Validation of the Fitbit wireless activity tracker for prediction of energy expenditure. J Phys Act Health 2015;12:149-54.
24. Byun W, Lee JM, Kim Y, Brusseau TA. Classification accuracy of a wearable activity tracker for assessing sedentary behavior and physical activity in 3-5-year-old children. Int J Environ Res Public Health 2018;15.
25. Collings PJ, Westgate K, Vaisto J, Wijndaele K, Atkin AJ, Haa- pala EA, Lintu N, Laitinen T, Ekelund U, Brage S, Lakka TA.
Cross-sectional associations of objectively-measured physical activity and sedentary time with body composition and cardio- respiratory fitness in mid-childhood: the PANIC Study. Sports Med 2017;47:769-80.
26. Guo VY, Brage S, Ekelund U, Griffin SJ, Simmons RK; ADDI- TION-Plus study team. Objectively measured sedentary time, physical activity and kidney function in people with recently diagnosed type 2 diabetes: a prospective cohort analysis. Dia- bet Med 2016;33:1222-9.
27. Bakrania K, Edwardson CL, Khunti K, Henson J, Stamatakis E, Hamer M, Davies MJ, Yates T. Associations of objectively mea- sured moderate-to-vigorous-intensity physical activity and sedentary time with all-cause mortality in a population of adults at high risk of type 2 diabetes mellitus. Prev Med Rep 2017;5:285-8.
28. van der Berg JD, Stehouwer CD, Bosma H, van der Velde JH, Willems PJ, Savelberg HH, Schram MT, Sep SJ, van der Kallen CJ, Henry RM, Dagnelie PC, Schaper NC, Koster A. Associa- tions of total amount and patterns of sedentary behaviour with type 2 diabetes and the metabolic syndrome: The Maastricht Study. Diabetologia 2016;59:709-18.
29. Matthews CE, Chen KY, Freedson PS, Buchowski MS, Beech BM, Pate RR, Troiano RP. Amount of time spent in sedentary
behaviors in the United States, 2003-2004. Am J Epidemiol 2008;167:875-81.
30. Hu FB, Li TY, Colditz GA, Willett WC, Manson JE. Television watching and other sedentary behaviors in relation to risk of obesity and type 2 diabetes mellitus in women. JAMA 2003;
289:1785-91.
31. Agiovlasitis S, Riebe D, Ehrman JK, Liguori G, Magal M;
American College of Sports Medicine, Wolters Kluwer Health.
ACSM’s guidelines for exercise testing and prescription. 10th ed. Philadelphia: Lippincott Williams & Wilkins; 2018. p3.
32. Hansen AL, Carstensen B, Helge JW, Johansen NB, Gram B, Christiansen JS, Brage S, Lauritzen T, Jorgensen ME, Aadahl M, Witte DR; ADDITION-Denmark Steering Committee.
Combined heart rate- and accelerometer-assessed physical ac- tivity energy expenditure and associations with glucose ho- meostasis markers in a population at high risk of developing diabetes: the ADDITION-PRO study. Diabetes Care 2013;36:
3062-9.
33. Hagstromer M, Oja P, Sjostrom M. Physical activity and inac- tivity in an adult population assessed by accelerometry. Med Sci Sports Exerc 2007;39:1502-8.
34. Gusmer RJ, Bosch TA, Watkins AN, Ostrem JD, Dengel DR.
Comparison of FitBit ultra to ActiGraph GT1M for assessment of physical activity in young adults during treadmill walking.
Open Sports Med J 2014;8:11-5.
35. Harrington DM, Edwardson CL, Henson J, Khunti K, Yates T, Davies MJ. Moderate to vigorous physical activity, not seden- tary time, is associated with total and regional adiposity in a sample of UK adults at risk of type 2 diabetes. Physiol Meas 2016;37:1862-71.
36. Dronkers JJ, Lamberts H, Reutelingsperger IM, Naber RH, Dronkers-Landman CM, Veldman A, van Meeteren NL. Pre- operative therapeutic programme for elderly patients sched- uled for elective abdominal oncological surgery: a randomized controlled pilot study. Clin Rehabil 2010;24:614-22.
37. Scheers T, Philippaerts R, Lefevre J. Objectively-determined intensity- and domain-specific physical activity and sedentary behavior in relation to percent body fat. Clin Nutr 2013;32:
999-1006.
38. Sial S, Coggan AR, Carroll R, Goodwin J, Klein S. Fat and car- bohydrate metabolism during exercise in elderly and young subjects. Am J Physiol 1996;271:E983-9.