Nationwide statistical analysis of myeloid malignancies in Korea:
incidence and survival rate from 1999 to 2012
Eun-Hye Park
1#, Hyewon Lee
2#, Young-Joo Won
1,4, Hee Young Ju
3, Chang-Mo Oh
1, Cecile Ingabire
1,4, Hyun-Joo Kong
1, Byung-Kiu Park
3, Ju Young Yoon
3, Hyeon-Seok Eom
2,5, Eunyoung Lee
2, Hyeon Jin Park
31The Korea Central Cancer Registry, Division of Cancer Registration and Surveillance, 2Hematologic Oncology Clinic, 3Center for Pediatric Oncology, 4Department of Cancer Control and Policy, and 5Department of System Cancer Science, Graduate School of Cancer Science and Policy, National Cancer Center, Goyang, Korea
p-ISSN 2287-979X / e-ISSN 2288-0011 http://dx.doi.org/10.5045/br.2015.50.4.204 Blood Res 2015;50:204-17.
Received on October 12, 2015 Revised on November 6, 2015 Accepted on December 7, 2015
Background
Large-scale epidemiologic analysis for hematologic malignancies will be helpful to under- stand the trends in incidence and survival.
Methods
The Korea Central Cancer Registry (KCCR) updated the nationwide analysis on the in- cidence and survival of myeloid malignancies, from the Korean National Cancer Incidence Database between 1999 and 2012. Myeloid malignancies were classified based on the International Classification of Diseases for Oncology 3rd edition (ICD-O-3).
Results
Overall 3,771 cases of myeloid diseases, which was 1.7% of all cancers, were identified in 2012. The highest incidence of myeloid malignancies was observed in age 70s and male predominance was noted (1.3:1). Acute myeloid leukemia (AML) was the most frequent subtype, followed by myeloproliferative neoplasms (MPN), myelodysplastic syndrome (MDS) and MDS/MPN: age-standardized incidence rates (ASR) in 2012 for each disease were 2.02, 1.95, 1.13, and 0.12 per 100,000 persons, respectively. The ASR for all myeloid malignancies was increased from 3.31 in 1999 to 5.70 in 2012 with the annual percentage change (APC) of 5.4 %. Five-year relative survival rate (RS) for myeloid malignancies has gradually improved for decades. RS changed from 26.3% to 34.8% in AML, specifically from 51.6% to 69.6% in acute promyelocytic leukemia (APL) and from 23.8% to 29.9%
in non-APL AML, between 1996‒2000 and 2008‒2012. RS also increased from 81.8% to 87.1% in MPN, with a significant improvement in CML (from 74.5% to 85.5%), and from 27.3% to 31.7% in MDS/MPN between 2001‒2005 and 2008‒2012. However, there was no survival improvement in MDS during the study period (45.6% in 2001‒2005 to 44.4%
in 2008‒2012).
Conclusion
This report updated the nationwide statistical analysis on myeloid malignancies since 2008, showing increasing incidence and improving trends in survival.
Key Words Myeloid malignancy, Incidence, Survival, Korea
#These authors are equally contributed to this work.
*This work was supported by a research grant from the National Cancer Center (No. 1310220).
Correspondence to Hyeon Jin Park, M.D., Ph.D.
Center for Pediatric Oncology, National Cancer Center, 323 Ilsan-ro, Ilsandong-gu, Goyang 10408, Korea
Tel: +82-31-920-1654 E-mail: [email protected]
Ⓒ 2015 Korean Society of Hematology
INTRODUCTION
Hematologic malignancies are classified on the basis of the morphology, immunophenotype, cytogenetics, and clin- ical characteristics. The most recent classification suggested by the World Health Organization (WHO) have grouped
myeloid malignancies into five categories: acute myeloid leukemia (AML), myelodysplastic syndromes (MDS), myelo- proliferative neoplasms (MPN), myelodysplastic and myelo- proliferative (MDS/MPN) neoplasms, and other rare diseases associated with eosinophilia and abnormalities of growth factor receptors derived from platelets or fibroblasts [1, 2].
The classification of these diseases has been modified to
Table 1. Incident cases of myeloid malignancies and trend in crude incidence rates and age-standardized incidence rates in Korea from 1999 to 2012.
Year
1999 2000 2001 2002 2003 2004 2005 2006 2007 2008 2009 2010 2011 2012 APC
AML Cases 880 833 936 1,033 1,034 1,070 1,073 1,104 1,113 1,224 1,292 1,246 1,311 1,257 CR 1.87 1.75 1.96 2.15 2.14 2.21 2.20 2.26 2.27 2.48 2.60 2.50 2.62 2.50 ASR 1.88 1.75 1.94 2.10 2.06 2.09 2.06 2.07 2.03 2.17 2.22 2.09 2.20 2.02 1.0b) Non-APL AML Cases 796 749 867 941 956 980 943 996 991 1,091 1,135 1,082 1,150 1,104
CR 1.69 1.58 1.81 1.96 1.98 2.02 1.94 2.04 2.02 2.21 2.29 2.17 2.29 2.19 ASR 1.70 1.58 1.79 1.91 1.90 1.91 1.80 1.85 1.79 1.92 1.94 1.79 1.91 1.76 0.6
APL Cases 84 84 69 92 78 90 130 108 122 133 157 164 161 153
CR 0.18 0.18 0.14 0.19 0.16 0.19 0.27 0.22 0.25 0.27 0.32 0.33 0.32 0.30 ASR 0.18 0.18 0.14 0.19 0.16 0.18 0.26 0.21 0.24 0.25 0.28 0.30 0.29 0.27 5.2b) MPNa) Cases - - - - 681 746 851 867 985 1,070 1,138 1,215 1,301 1,274
CR - - - - 1.41 1.54 1.75 1.77 2.00 2.17 2.29 2.44 2.60 2.53 ASR - - - - 1.34 1.42 1.58 1.56 1.73 1.82 1.86 1.96 2.03 1.95 4.7b)
CML Cases - - - - 322 383 345 371 364 399 377 448 478 458
CR - - - - 0.67 0.79 0.71 0.76 0.74 0.81 0.76 0.90 0.95 0.91 ASR - - - - 0.64 0.75 0.66 0.69 0.68 0.72 0.66 0.78 0.80 0.76 1.7b) Non-CML MPN Cases - - - - 359 363 506 496 621 671 761 767 823 816
CR - - - - 0.74 0.75 1.04 1.01 1.26 1.36 1.53 1.54 1.64 1.62 ASR - - - - 0.69 0.67 0.92 0.87 1.05 1.10 1.19 1.18 1.23 1.19 7.1b)
MDSa) Cases - - - - 393 414 467 482 555 635 713 763 855 813
CR - - - - 0.81 0.85 0.96 0.99 1.13 1.29 1.44 1.53 1.71 1.61 ASR - - - - 0.76 0.77 0.85 0.84 0.93 1.03 1.11 1.13 1.25 1.13 5.8b)
MDS/MPNa) Cases - - - - 32 36 2 25 37 42 48 60 77 86
CR - - - - 0.07 0.07 0.05 0.05 0.08 0.09 0.10 0.12 0.15 0.17 ASR - - - - 0.06 0.07 0.05 0.04 0.06 0.07 0.08 0.09 0.11 0.12 9.3b) Unknown myeloid
neoplasms Cases 375 357 348 377 335 343 341 341 351 310 326 345 341 341
CR 0.80 0.75 0.73 0.78 0.69 0.71 0.70 0.70 0.71 0.63 0.66 0.69 0.68 0.68 ASR 0.81 0.75 0.71 0.75 0.65 0.64 0.62 0.61 0.60 0.52 0.51 0.53 0.51 0.48 −3.8b) All myeloid
malignancies Cases 1,255 1,190 1,284 1,410 2,475 2,609 2,758 2,819 3,041 3,281 3,517 3,629 3,885 3,771 CR 2.66 2.50 2.68 2.93 5.12 5.38 5.67 5.77 6.19 6.64 7.08 7.28 7.75 7.49 ASR 2.70 2.50 2.65 2.85 4.86 5.00 5.16 5.13 5.35 5.61 5.78 5.80 6.10 5.70 7.4b)
a)Official registration employing ICD-O-3 began in 2003 at KCCR. b)The annual percent change is statistically significantly different from zero (P<0.05).
Abbreviations: CR, crude incidence rate; ASR, age-standardized incidence rate; APC, annual percentage change; APL, acute promyelocytic leukemia; AML, acute myeloid leukemia; CML, chronic myelogenous leukemia; MPN, myeloproliferative neoplasia; MDS, myelodysplastic syndrome.
include recent advances in cytogenetics and molecular genet- ics for hematologic malignancies.
In cancer registries, the International Classification of Diseases for Oncology (ICD-O) has been widely used since 1976, for coding the tumor site and histology. The most recent publication of ICD-O is the third edition (ICD-O-3), published in 2000 and revised in 2013 [3]. This updated version of ICD-O-3 includes the new terms and code changes suggested by the updated WHO classification on tumors of hematopoietic and lymphoid tissues in 2008. Recent cancer registry reports adopted this ICD-O-3 classification, as it was considered to better reflect our current understanding of diseases [4-6].
In Korea, the Ministry of Health and Welfare started the Korea Central Cancer Registry (KCCR), a nationwide hospi- tal-based cancer registry in 1980. The KCCR expanded to include the entire population under the population-based
cancer registry program since 1999 [7]. ICD-O-3 was applied to all incident cases for neoplastic diseases since the year 2003.
The KCCR and the Korean Society of Hematology (KSH) reported the first nationwide statistics of hematologic malig- nancies 4 years ago, covering the incident cases from 1999 to 2008 [8]. In the previous analysis, disease entities were defined based on the International Classification of Diseases 10th edition (ICD-10) and calculated incidence and survival according to broad disease groups such as non-Hodgkin lym- phoma (C82–C85, C96), myeloid leukemia (C92–C94), and lymphoid leukemia (C91).
The main objective of the current study is to update the statistical data on hematologic malignancies, focusing on myeloid malignancies, with the most recent database of KCCR in 2012. Incidence and survival estimates were ana- lyzed according to more detailed disease groups compared
Fig. 1. Incident cases of myeloid malignancies in men (B) and women (C) in Korea, 2012. a)AML cases include 153 cases of APL in both genders (77 cases in men, and 76 cases in women); b)MPN cases include 458 cases of CML in both genders (288 cases in men, and 170 cases in women);
c)Unknown cases include 15 cases of acute leukemia, ambiguous lineage in both genders (7 cases in men, 8 cases in women).
Abbreviations: AML, acute myeloid leukemia; MPN, myeloproliferative neoplasms; MDS, myelodysplastic syndrome; MDS/MPN, myelodys- plastic/myeloproliferative neoplasms.
to the previous report, using the ICD-O-3 codes. We also investigated recent epidemiologic changes of myeloid malig- nancies for decades in Korea with database from 1999 to 2012.
MATERIALS AND METHODS
Incident cases of myeloid malignancies between 1999 and 2012 were obtained from the Korean National Cancer Incidence Database (KNCIDB) [9]. Myeloid malignancies were defined according to the revised version of ICD-O-3 (2013) and each code was categorized as shown in Supple- mentary Table 1, taking into account the clinical relevance.
Myeloid malignancies were grouped into five categories:
AML, MPN, MDS, MDS/MPN, and unknown myeloid neoplasms. AML and MPN were further divided into two subgroups as shown in Table 1, in consideration with acute promyelocytic leukemia (APL) and chronic myelogenous leukemia (CML), those have unique characteristics, treat- ments, and clinical outcomes separated from non-APL AML and non-CML MPN. For MPN, MDS, and MDS/MPN, in- cident cases between 1999 and 2002 were not included in this analysis because official registration by KCCR employing ICD-O-3 began in 2003. Codes for these categories by ICD-O-3 had significantly changed, but it could not be con- verted from old data.
Crude incidence rates (CRs) and age-specific incidence rates of each myeloid malignancy were calculated. The CRs per 100,000, an incidence rate based on the frequency of cancer in the entire population, were calculated by dividing the total number of events (N) by the total number of per- son-year of observation (P) and multiplying the result by 100,000. The age-specific incidence rates per 100,000 within
age group i, were calculated by dividing the number of in- cidence observed in the age group (Ni) by the number of corresponding person-year of observation (Pi) and multi- plying the result by 100,000. Age-standardized incidence rates (ASRs), weighted average of crude age-specific rates, were determined by using the mid-year population in Korea in 2000 as the standard population. Both age-specific in- cidence rates and ASRs were calculated according to age group: <14, 15–34, 35–49, 50–64, 65–79, and ≥80 years.
Changes in the annual ASRs were examined by calculating the annual percentage change (APC) over a time period as (exp(b)-1)×100, where b is the slope of the regression of log(ASR) on a calendar year using the following linear regression equation [10]:
For the survival analysis, five-year relative survival rates were calculated. To find any changes for recent decades, KNCIDB data from 1996 to 2012 were included. The survival status of these patients was followed until December 31, 2013. Five-year relative survival (RS) rates for AML, and unknown myeloid neoplasms were calculated according to four periods of diagnosis: 1996–2000, 2001–2005, 2006–2010, and 2008–2012. RS for MPN, MDS, and MDS/MPN were calculated according to three periods of diagnosis (2001–2005, 2006–2010, and 2008–2012) since data before 2003 for these entities were not reliable. RS rates were developed by com- paring the observed survival in the cancer patient group with the expected survival of the general population [11].
Five- year RS rates using the Ederer II method were based on an algorithm written by Paul Dickman in SAS [12, 13].
All analyses were performed using SAS version 9.2.
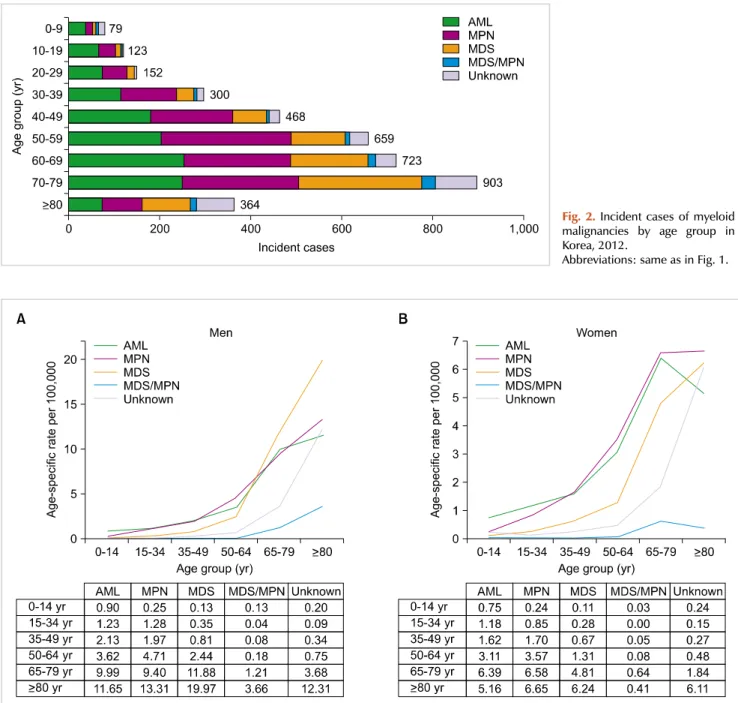
Fig. 2. Incident cases of myeloid malignancies by age group in Korea, 2012.
Abbreviations: same as in Fig. 1.
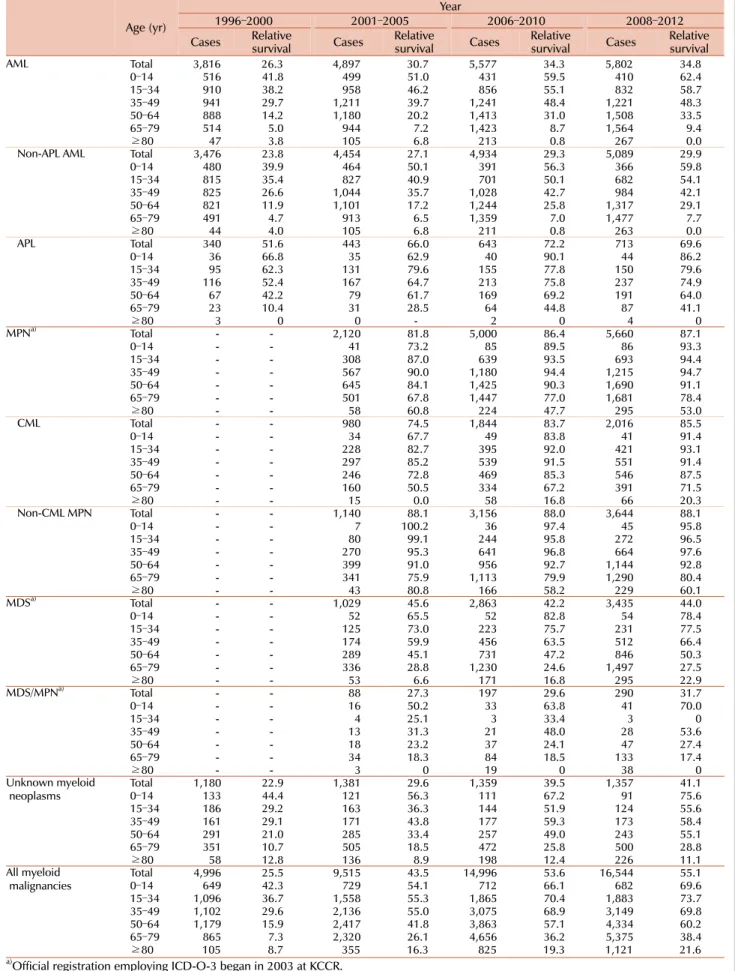
Fig. 3. Age-specific incidence rates of myeloid malignancies in men (A) and in women (B) in Korea, 2012.
Abbreviations: same as in Fig. 1.
RESULTS
Incidence
The overall number of incident cases for all neoplastic diseases in 2012 was 224,177. Myeloid malignancies occurred in 3,771 patients, which was 1.7% of all cancers (Fig. 1).
It occurred in 2,138 men and 1,633 women, with a ratio of 1.3:1. Among all myeloid malignancies, AML (33.3%) was the most frequent, followed by MPN (33.8%), and MDS (21.6%). There was no significant difference between men and women.
Crude rates and age-specific incidence of myeloid malig-
nancies by age group in 2012 were shown in Fig. 2 and 3, respectively. Patients with ages between 70 and 79 showed the highest CR of myeloid malignancies followed by ages 60 to 69, and ages 50 to 59. AML was most prevalent in patients who were less than 49 years old and those aged 60 to 69, while MPN and MDS were most prevalent in patients 50 to 59 years old and older than 70 years, re- spectively (Fig. 2). For age-specific incidence rates in 2012, AML was the most common myeloid disease in men patients younger than 50 years old. However, MDS surpassed AML in elderly patients with an age of 65 or more. In women, AML showed the highest incidence rate in patients up to 34 years old, and MPN substituted AML in ages above 35
Table 2. Five-year relative survival rates of myeloid malignancies by age group in Korea.
Age (yr)
Year
1996–2000 2001–2005 2006–2010 2008–2012
Cases Relative
survival Cases Relative
survival Cases Relative
survival Cases Relative survival
AML Total 3,816 26.3 4,897 30.7 5,577 34.3 5,802 34.8
0–14 516 41.8 499 51.0 431 59.5 410 62.4
15–34 910 38.2 958 46.2 856 55.1 832 58.7
35–49 941 29.7 1,211 39.7 1,241 48.4 1,221 48.3
50–64 888 14.2 1,180 20.2 1,413 31.0 1,508 33.5
65–79 514 5.0 944 7.2 1,423 8.7 1,564 9.4
≥80 47 3.8 105 6.8 213 0.8 267 0.0
Non-APL AML Total 3,476 23.8 4,454 27.1 4,934 29.3 5,089 29.9
0–14 480 39.9 464 50.1 391 56.3 366 59.8
15–34 815 35.4 827 40.9 701 50.1 682 54.1
35–49 825 26.6 1,044 35.7 1,028 42.7 984 42.1
50–64 821 11.9 1,101 17.2 1,244 25.8 1,317 29.1
65–79 491 4.7 913 6.5 1,359 7.0 1,477 7.7
≥80 44 4.0 105 6.8 211 0.8 263 0.0
APL Total 340 51.6 443 66.0 643 72.2 713 69.6
0–14 36 66.8 35 62.9 40 90.1 44 86.2
15–34 95 62.3 131 79.6 155 77.8 150 79.6
35–49 116 52.4 167 64.7 213 75.8 237 74.9
50–64 67 42.2 79 61.7 169 69.2 191 64.0
65–79 23 10.4 31 28.5 64 44.8 87 41.1
≥80 3 0 0 - 2 0 4 0
MPNa) Total - - 2,120 81.8 5,000 86.4 5,660 87.1
0–14 - - 41 73.2 85 89.5 86 93.3
15–34 - - 308 87.0 639 93.5 693 94.4
35–49 - - 567 90.0 1,180 94.4 1,215 94.7
50–64 - - 645 84.1 1,425 90.3 1,690 91.1
65–79 - - 501 67.8 1,447 77.0 1,681 78.4
≥80 - - 58 60.8 224 47.7 295 53.0
CML Total - - 980 74.5 1,844 83.7 2,016 85.5
0–14 - - 34 67.7 49 83.8 41 91.4
15–34 - - 228 82.7 395 92.0 421 93.1
35–49 - - 297 85.2 539 91.5 551 91.4
50–64 - - 246 72.8 469 85.3 546 87.5
65–79 - - 160 50.5 334 67.2 391 71.5
≥80 - - 15 0.0 58 16.8 66 20.3
Non-CML MPN Total - - 1,140 88.1 3,156 88.0 3,644 88.1
0–14 - - 7 100.2 36 97.4 45 95.8
15–34 - - 80 99.1 244 95.8 272 96.5
35–49 - - 270 95.3 641 96.8 664 97.6
50–64 - - 399 91.0 956 92.7 1,144 92.8
65–79 - - 341 75.9 1,113 79.9 1,290 80.4
≥80 - - 43 80.8 166 58.2 229 60.1
MDSa) Total - - 1,029 45.6 2,863 42.2 3,435 44.0
0–14 - - 52 65.5 52 82.8 54 78.4
15–34 - - 125 73.0 223 75.7 231 77.5
35–49 - - 174 59.9 456 63.5 512 66.4
50–64 - - 289 45.1 731 47.2 846 50.3
65–79 - - 336 28.8 1,230 24.6 1,497 27.5
≥80 - - 53 6.6 171 16.8 295 22.9
MDS/MPNa) Total - - 88 27.3 197 29.6 290 31.7
0–14 - - 16 50.2 33 63.8 41 70.0
15–34 - - 4 25.1 3 33.4 3 0
35–49 - - 13 31.3 21 48.0 28 53.6
50–64 - - 18 23.2 37 24.1 47 27.4
65–79 - - 34 18.3 84 18.5 133 17.4
≥80 - - 3 0 19 0 38 0
Unknown myeloid
neoplasms Total 1,180 22.9 1,381 29.6 1,359 39.5 1,357 41.1
0–14 133 44.4 121 56.3 111 67.2 91 75.6
15–34 186 29.2 163 36.3 144 51.9 124 55.6
35–49 161 29.1 171 43.8 177 59.3 173 58.4
50–64 291 21.0 285 33.4 257 49.0 243 55.1
65–79 351 10.7 505 18.5 472 25.8 500 28.8
≥80 58 12.8 136 8.9 198 12.4 226 11.1
All myeloid
malignancies Total 4,996 25.5 9,515 43.5 14,996 53.6 16,544 55.1
0–14 649 42.3 729 54.1 712 66.1 682 69.6
15–34 1,096 36.7 1,558 55.3 1,865 70.4 1,883 73.7
35–49 1,102 29.6 2,136 55.0 3,075 68.9 3,149 69.8
50–64 1,179 15.9 2,417 41.8 3,863 57.1 4,334 60.2
65–79 865 7.3 2,320 26.1 4,656 36.2 5,375 38.4
≥80 105 8.7 355 16.3 825 19.3 1,121 21.6
a)Official registration employing ICD-O-3 began in 2003 at KCCR.
Abbreviations: same as in Table 1.
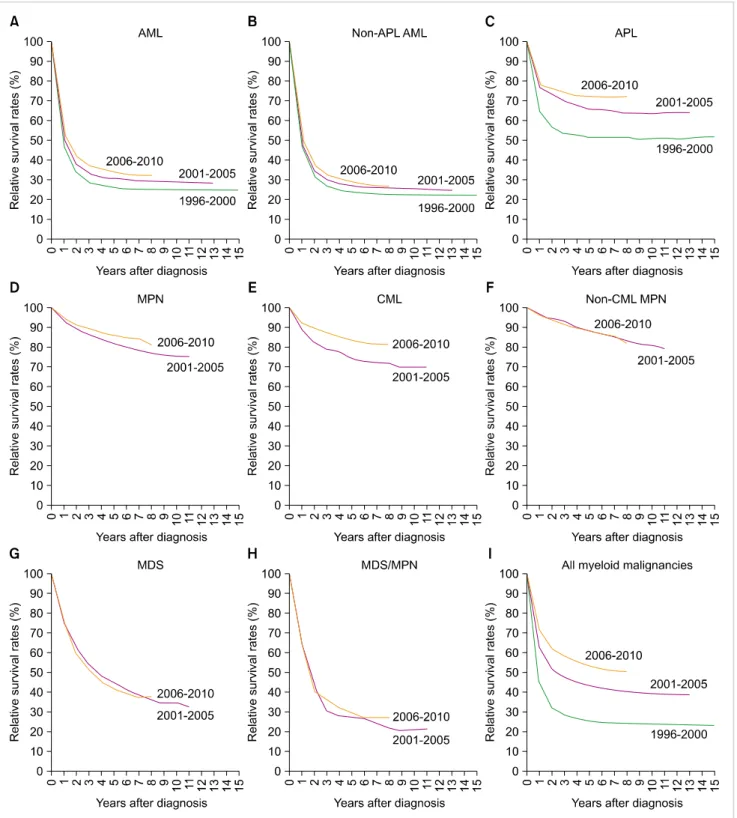
Fig. 4. Trend in relative survival rate of myeloid malignances between 1996 and 2010 in Korea.
Abbreviations: same as in Fig. 1.
years (Fig. 3).
The incident cases of myeloid malignancies and trend in CR and ASR between 1999 and 2012 was shown briefly in Table 1 (for detailed data, see Supplementary Table 2).
During the study period, 36,924 cases of myeloid malig- nancies occurred. The overall ASR of all myeloid malig- nancies increased from 2.7 in 1999 to 5.7 in 2012. The APC
was 7.4% between 1999 and 2012, which was higher than the APC of 3.5% for all cancers, and it was statistically significant. The ASRs increased from 1.88 to 2.02 in AML (APC=1.0%, P<0.05), from 1.70 to 1.76 in non-APL AML (APC=0.6%, not significant), from 0.18 to 0.27 in APL (APC=5.2%, P<0.05) from 1999 to 2012. The ASRs in MPN also increased from 1.34 to 1.95 (APC=4.7%, P<0.05), from
0.64 to 0.76 in CML (APC=1.7%, P<0.05), from 0.69 to 1.19 in non-CML MPN (APC=7.1%, P<0.05), from 2003 to 2012. Similar increasing trends were observed both in MDS and MDS/MPN, from 0.76 to 1.13 in MDS (APC=5.8%, P<0.05) and from 0.06 to 0.12 in MDS/MPN (APC=9.3%, P<0.05) between 2003 and 2012, respectively. The number of unknown myeloid neoplasms had decreased, but still counted up to 341 cases in 2012.
Survival rates
Five-year RS rates for patients with myeloid malignancies for four intervals (1996–2000, 2001–2005, 2006–2010, and 2008–2012) stratified by years and age are described in Table 2. RS varied between the disease entities: being 34.8% for AML (29.9 % for non-APL AML and 69.6% for APL), 87.1%
for MPN (85.5% for CML and 88.1% for non-CML MPN), 44% for MDS, and 31.7% for MDS/MPN in 2008–2012.
More detailed survival data for subcategories are described in Supplementary Table 3. Polycythemia vera showed the most favorable outcome with a 5-year relative survival rate of 99.7%, followed by essential thrombocythemia with a rate of 90.3%. Poor survival in some disease entities, such as AML with multilineage dysplasia or transformed AML from MDS (17.8%), acute panmyelosis with fibrosis (13.9%), MDS-refractory anemia with excess blasts (24.3%), and chronic myelomonocytic leukemia (23.2%), was noted. In most cases, the RS of the patients with myeloid malignancies decreased as their age increased.
Five-year RS for all myeloid malignancies has gradually improved recently, from 25.5% in 1996–2000 to 55.1% in 2008–2012, with an increase of 29.6%. For last few decades, survival rates for most myeloid malignancies improved ex- cept for non-CML MPN, and MDS. Specifically, 5-year RS rates changed from 26.3% to 34.8% in AML from 1996–2000 to 2008–2012 (from 23.8% to 29.9% in non-APL AML, and 51.6% to 69.6% in APL). The 5-year RS rates increased from 81.8% to 87.1% in MPN, with significant improvement in CML (from 74.5% to 85.5%), from 2001–2005 to 2008–
2012. Survival in MDS/MPN also increased from 27.3% to 31.7% from 2001–2005 to 2008–2012. However, there was no improvement of relative survival in MDS during the study period (45.6% in 2001–2005 to 44.4% in 2008–2012).
Changes in survival curves for myeloid diseases are shown in Fig. 4.
DISCUSSION
We showed the epidemiologic data for myeloid malig- nancies in Korea between 1996 and 2012, updating the pre- vious report [8], which had focused on analyzing the basic characteristics and past survival rates of domestic hemato- logic malignancies roughly classified according to ICD-10 code [14]. In this study, we adopted the latest ICD-O-3 codes [3] and the WHO classifications [1] to distinguish many different subcategories based on the cell lineage, histo- logic/genetic characteristics, and clinical prognosis, to avoid
grouping clinically different diseases together as a single vague entity such as ‘myeloid leukemia’. Analysis with sub- categories enriched this study with data closely related to real-life practice, although it caused some artifacts in survival estimates owing to the small number of rare diseases.
Calculating population-based relative survival can measure survival improvement in each myeloid malignancy, which can be more easy compared to conventional cohort ap- proaches or clinical trials. In Korea, the KNCIDB includes entire annual population diagnosed with malignant diseases, which is enough to truly represent the nationwide status.
Consistent with the first report by KCCR [8], we found an increasing incidence of most myeloid malignancies by age and year at diagnosis. Furthermore, increasing incidences in MDS, MPN, MDS/MPN were also detected, which could not be calculated in the previous report. Age and environ- mental factors [15-17] can be considered a potential cause of inflated incidence. A similar change was observed in the European HAEMACARE project [18], but Korean ASRs of MDS and MPN are much lower than that of European, prob- ably because of ethnic or regional differences. The increased number of cancer survivors owing to the improvements in overall cancer survival [19] also needs to be considered be- cause the risk of myeloid malignancies increases after chemo- or radiotherapy [20], although the exact effect would be difficult to validate.
The relative survival for most myeloid malignancies was comparable to other country. Five-year survival of patients with AML (non-APL AML) was 29.9% in 2008–2012 and this is better than or comparable to European data (15%
in 2006–2008) [21] and US data (25.9% in 2005–2011) [6].
Because the conventional chemotherapy with anthracycline and cytarabine has been widely applied for AML without significant change for years, prolonged survival may be due to the improvement in transplantation and supportive care such as anti-infective agents and immunosuppressive agents [22-24]. Best supportive care might influence on reduced early mortality in APL, with an introduction of arsenic triox- ide for relapsed disease or frail patients to anthracycline.
For MDS, relative survival was significantly different be- tween the subtypes, ranging from 24.3% for refractory ane- mia with excess blasts to 68.1% for MDS with 5q deletion.
This is the first time that survival analysis according to the subtypes of MDS was performed.
Poor survival of patients with AML and high-risk MDS was more apparent in patients over 65 years old. It is well known that elderly AML or MDS patients are associated with unfavorable tumor biology compared to younger pa- tients, but they also tend to be too frail to undergo intensive treatments, including hematopoietic stem cell trans- plantation required to induce the potential cure [25, 26].
Survival improvements in elderly AML and MDS were not apparent compared to younger patients so far. In Korea, hypomethylating agents were approved for elderly patients with AML [27]. We should find the effect of this noble treatment in the future analysis
In the presented data, relative survival of CML strikingly
increased in the 2000s, and became more apparent in the late 2000s. The main cause of such improvement is attributed to the introduction of tyrosine kinase inhibitors, as expected.
In Korea, imatinib, the first tyrosine kinase inhibitor, was introduced in 2001 as a phase III clinical trial for approval.
After its formal approval in 2006, this effective treatment has been prescribed widely. Five-year relative survival for patients with CML in our data (69.4% in 2001–2005 and 83.7% in 2006–2010) seems to be higher than in data from western countries (SEER database: 63.2% in 2005–2011 and EUROCARE data: 46% in 2003–2005) [6, 21], although direct comparison between the databases has many limitations.
In terms of unknown myeloid malignancies, acute leuke- mia with ambiguous lineage and other vague entities (leukemia, acute leukemia, and myeloid leukemia) that can- not be classified to any categories of the WHO classification.
The proportion of cases reported with vague terms among all myeloid malignancies has decreased from 24.2% in 1999 to 8.6% in 2012. To reduce this proportion further, we should make an effort to diagnose the disease using exact terms and codes. Annual education and update of recent changes in classification of hematologic diseases should be provided for medical record administrators.
In summary, we found an increasing incidence according to age and year at diagnosis for most myeloid malignancies.
Patient survival was also improved over the study periods, mainly because of a notable increase in survival of patients with APL and CML owing to the widespread use of more effective and less toxic treatments and supportive care. Serial reports of population-based cancer registry data enable us to monitor the improvements in survival associated with recent advances in diagnosis and treatment for hematologic malignancies. To perform this essential task, maintaining the quality of cancer registries through comprehensive data collection and monitoring, adequate education programs, and recruiting stable investment for resources are prerequisites.
A qualified registry would provide more amount of in- formative evidence as to whether the recent changes in treat- ment do lead to improved survival.
AuthorsÊ Disclosures of Potential Conflicts of Interest
No potential conflicts of interest relevant to this article were reported.
REFERENCES
1. Swerdlow SH, Campo E, Harris NL, et al, eds. WHO classification of tumours of haematopoietic and lymphoid tissues. 4th ed. Lyon, France: IARC Press, 2008.
2. Vardiman JW, Thiele J, Arber DA, et al. The 2008 revision of the World Health Organization (WHO) classification of myeloid neoplasms and acute leukemia: rationale and important changes.
Blood 2009;114:937-51.
3. Percy CL, Fritz AG, Jack A, et al, eds. International classification
of diseases for oncology (ICD-O). 3rd ed. Geneva, Switzerland:
World Health Organization, 2013.
4. Marcos-Gragera R, Allemani C, Tereanu C, et al. Survival of European patients diagnosed with lymphoid neoplasms in 2000-2002: results of the HAEMACARE project. Haematologica 2011;96:720-8.
5. Sant M, Allemani C, Tereanu C, et al. Incidence of hematologic malignancies in Europe by morphologic subtype: results of the HAEMACARE project. Blood 2010;116:3724-34.
6. National Cancer Institute. Surveillance, Epidemiology, and End Results (SEER) Program Research Data (1973-2012). Bethesda, MD: National Cancer Institute, 2015. (Accessed October 2, 2015, at http://seer.cancer.gov/data/)
7. Shin HR, Won YJ, Jung KW, et al. Nationwide cancer incidence in Korea, 1999∼2001; First result using the national cancer incidence database. Cancer Res Treat 2005;37:325-31.
8. Park HJ, Park EH, Jung KW, et al. Statistics of hematologic malignancies in Korea: incidence, prevalence and survival rates from 1999 to 2008. Korean J Hematol 2012;47:28-38.
9. Korea Central Cancer Registry, National Cancer Center. Annual report of cancer statistics in Korea in 2012. Seoul, Korea: Ministry of Health and Welfare, 2014.
10. Howlader N, Noone AM, Krapcho M, et al. SEER cancer statistics review, 1975-2010. Bethesda, MD: National Cancer Institute, 2015. (Accessed October 2, 2015, at http://seer.cancer.gov/csr/
1975_2010/)
11. Ederer F, Axtell LM, Cutler SJ. The relative survival rate: a statistical methodology. Natl Cancer Inst Monogr 1961;6:101-21.
12. Ederer F, Heise H. Instructions to IBM 650 programmers in processing survival computations, technical, end results evalua- tion section. Bethesda, MD: National Cancer Institute, 1959.
13. Dickman PW, Sloggett A, Hills M, Hakulinen T. Regression models for relative survival. Stat Med 2004;23:51-64.
14. World Health Organization. International statistical classifica- tion of diseases and related health problems (ICD-10) in occupa- tional health. Geneva, Switzerland: World Health Organization, 1999.
15. Eden T. Aetiology of childhood leukaemia. Cancer Treat Rev 2010;36:286-97.
16. Alexander FE. The search for causes of the leukaemias. Eur J Cancer 1995;31A:863-7.
17. Gorini G, Stagnaro E, Fontana V, et al. Alcohol consumption and risk of leukemia: A multicenter case-control study. Leuk Res 2007;31:379-86.
18. Maynadié M, De Angelis R, Marcos-Gragera R, et al. Survival of European patients diagnosed with myeloid malignancies: a HAEMACARE study. Haematologica 2013;98:230-8.
19. Jung KW, Won YJ, Kong HJ, Oh CM, Lee DH, Lee JS. Cancer statistics in Korea: incidence, mortality, survival, and prevalence in 2011. Cancer Res Treat 2014;46:109-23.
20. Larson RA. Therapy-related myeloid neoplasms. Haematologica 2009;94:454-9.
21. Sant M, Minicozzi P, Mounier M, et al. Survival for haematological malignancies in Europe between 1997 and 2008 by region and age:
results of EUROCARE-5, a population-based study. Lancet Oncol 2014;15:931-42.
22. Gooley TA, Chien JW, Pergam SA, et al. Reduced mortality after
allogeneic hematopoietic-cell transplantation. N Engl J Med 2010;363:2091-101.
23. Higby DJ, Cohen E, Holland JF, Sinks L. The prophylactic treatment of thrombocytopenic leukemic patients with platelets:
a double blind study. Transfusion 1974;14:440-6.
24. Walsh TJ, Finberg RW, Arndt C, et al. Liposomal amphotericin B for empirical therapy in patients with persistent fever and neutropenia. National Institute of Allergy and Infectious Diseases Mycoses Study Group. N Engl J Med 1999;340:764-71.
25. Appelbaum FR, Gundacker H, Head DR, et al. Age and acute
myeloid leukemia. Blood 2006;107:3481-5.
26. Kantarjian H, O'brien S, Cortes J, et al. Results of intensive chemotherapy in 998 patients age 65 years or older with acute myeloid leukemia or high-risk myelodysplastic syndrome:
predictive prognostic models for outcome. Cancer 2006;106:
1090-8.
27. Medeiros BC, Satram-Hoang S, Hurst D, Hoang KQ, Momin F, Reyes C. Big data analysis of treatment patterns and outcomes among elderly acute myeloid leukemia patients in the United States. Ann Hematol 2015;94:1127-38.
Supplementary Table 1. Classification of myeloid malignancies (ICD-O-3).
Site ICD-O-3 code Description
Acute myeloid leukemia
Non-APL AML 9840 Acute erythroid leukemia
9861 AML, NOS
9867 Acute myelomonocytic leukemia 9870 Acute basophilic leukemia 9872 AML, minimal differentiation 9873 AML without maturation 9874 AML with maturation 9891 Acute monocytic leukemia 9910 Acute megakaryoblastic leukemia 9930 Myeloid sarcoma
9871 AML with abnormal marrow eosinophils 9896 AML, t(8,21) (q22,q22)
9897 AML, 11q23 abnormalities 9895 AML, with multilineage dysplasia
9984 Refractory anemia with excess blasts in transformation (obsolete) 9931 Acute panmyelosis with myelofibrosis
9920 Therapy-related myeloid neoplasms
Acute promyelocytic leukemia 9866 Acute promyelocytic leukemia t(15; 17) (q22;q11-12)
Myeloproliferative neoplsms
Chronic myelogenous leukemia 9863 CML, NOS
9875 Chronic myelogenous leukemia, BCR/ABL positive
Non-CML MPN 9950 Polycythemia vera
9961 Myelosclerosis with myeloid metaplasia 9962 Essential thrombocythemia
9963 Chronic neutrophilic leukemia 9964 Hypereosinophilic syndrome
9960 Chronic myeloproliferative disease, NOS 9740 Mast cell sarcoma
9741 Malignant mastocytosis 9742 Mast cell leukemia
Myelodysplastic syndrome 9980 Refractory anemia
9982 Refractory anemia with sideroblasts 9983 Refractory anemia with excess blasts
9985 Refractory cytopenia with multilineage dysplasia 9986 Myelodysplastic syndrome 5q deletion
9987 Therapy-related myelodysplastic syndrome, NOS
9989 Myelodysplastic syndrome, NOS
Myelodysplastic/myeloproliferative neoplasms 9945 Chronic myelomonocytic leukemia 9876 Atypical CML, BCR/ABL-1 negative 9946 Juvenile myelomonocytic leukemia
9975 Myelodysplastic/myeloproliferative neoplasm, unclassifiable
Unknown myeloid neoplasms 9800 Leukemia, NOS
9801 Acute leukemia, NOS 9860 Myeloid leukemia, NOS
9805 Acute leukemia, ambiguous lineage
Abbreviation: NOS, not otherwise specified.
Supplementary Table 2. Incident cases of myeloid malignancies and trend in crude incidence rates and age-standardized incidence rates in Korea from 1999 to 2012 (in detail).
ICD-O-3
code ICD-O-3 description Year
1999 2000 2001 2002 2003 2004 2005 2006 2007 2008 2009 2010 2011 2012 APC
Acute myeloid leukemia: Non-APL AML
9840 Acute erythroid leukemia Cases 791 740 861 927 900 944 886 941 928 1,033 1,088 1,028 1,075 1,007 9861 AML, NOS CR 1.68 1.56 1.80 1.93 1.86 1.95 1.82 1.92 1.89 2.09 2.19 2.06 2.15 2.00 9867 Acute myelomonocytic leukemia ASR 1.69 1.56 1.78 1.88 1.78 1.84 1.69 1.75 1.68 1.82 1.87 1.71 1.80 1.61 0.1
9870 Acute basophilic leukemia - - - - - - - - - - - - - -
9872 AML, minimal differentiation - - - - - - - - - - - - - -
9873 AML without maturation - - - - - - - - - - - - - -
9874 AML with maturation - - - - - - - - - - - - - -
9891 Acute monocytic leukemia - - - - - - - - - - - - - -
9910 Acute megakaryoblastic leukemia - - - - - - - - - - - - - -
9930 Myeloid sarcoma - - - - - - - - - - - - - -
9871 AML with abnormal marrow eosinophils - - - - - - - - - - - - - -
9896 AML, t(8,21) (q22,q22) - - - - - - - - - - - - - -
9897 AML, 11q23 abnormalities - - - - - - - - - - - - - -
9895 AML, with multilineage dysplasia Cases <5 <5 0 8 49 27 39 43 44 43 31 40 53 63 9984 Refractory anemia with excess blasts CR 0.00 0.00 0.00 0.02 0.10 0.06 0.08 0.09 0.09 0.09 0.06 0.08 0.11 0.13
in transformation (obsolete) ASR 0.00 0.00 0.00 0.02 0.10 0.05 0.07 0.08 0.08 0.07 0.05 0.06 0.08 0.09 25.2b) 9931 Acute panmyelosis with myelofibrosis Cases <5 7 6 6 7 9 15 10 18 13 10 9 19 21
CR 0.01 0.01 0.01 0.01 0.01 0.02 0.03 0.02 0.04 0.03 0.02 0.02 0.04 0.04 ASR 0.01 0.01 0.01 0.01 0.01 0.02 0.03 0.02 0.03 0.02 0.02 0.02 0.03 0.03 6.8b) Acute myeloid leukemia: APL
9866 Acute promyelocytic leukemia t(15; 17) Cases 84 84 69 92 78 90 130 108 122 133 157 164 161 153 (q22;q11-12) CR 0.18 0.18 0.14 0.19 0.16 0.19 0.27 0.22 0.25 0.27 0.32 0.33 0.32 0.30 ASR 0.18 0.18 0.14 0.19 0.16 0.18 0.26 0.21 0.24 0.25 0.28 0.30 0.29 0.27 5.2b) Myeloproliferative neoplasms: CMLa)
9863 CML, NOS Cases - - - - 322 383 345 371 364 399 377 448 478 458
9875 Chronic myelogenous leukemia, CR - - - - 0.67 0.79 0.71 0.76 0.74 0.81 0.76 0.90 0.95 0.91 BCR/ABL Positive ASR - - - - 0.64 0.75 0.66 0.69 0.68 0.72 0.66 0.78 0.80 0.76 1.7b) Myeloproliferative neoplasms: Non-CML MPNa)
9950 Polycythemia vera Cases - - - - 118 125 165 149 196 178 221 228 202 218
CR - - - - 0.24 0.26 0.34 0.30 0.40 0.36 0.45 0.46 0.40 0.43 ASR - - - - 0.23 0.23 0.30 0.26 0.33 0.29 0.35 0.35 0.30 0.33 4.0b) 9961 Myelosclerosis with myeloid metaplasia Cases - - - - 37 38 53 51 67 77 88 73 76 88
CR - - - - 0.08 0.08 0.11 0.10 0.14 0.16 0.18 0.15 0.15 0.17 ASR - - - - 0.07 0.07 0.09 0.09 0.11 0.12 0.13 0.11 0.10 0.12 5.8b) 9962 Essential thrombocythemia Cases - - - - 105 125 188 202 213 283 319 342 423 403
CR - - - - 0.22 0.26 0.39 0.41 0.43 0.57 0.64 0.69 0.84 0.80 ASR - - - - 0.20 0.23 0.34 0.36 0.36 0.46 0.50 0.52 0.64 0.59 12.9b)
9963 Chronic neutrophilic leukemia Cases - - - - 5 <5 6 <5 5 6 <5 <5 <5 <5
CR - - - - 0.01 0.00 0.01 0.00 0.01 0.01 0.01 0.01 0.01 0.00
ASR - - - - 0.01 0.00 0.01 0.00 0.01 0.01 0.01 0.00 0.00 0.00 −11.5
9964 Hypereosinophilic syndrome Cases - - - - 34 22 27 28 56 74 74 70 53 35
CR - - - - 0.07 0.05 0.06 0.06 0.11 0.15 0.15 0.14 0.11 0.07
ASR - - - - 0.07 0.04 0.05 0.05 0.10 0.13 0.13 0.12 0.09 0.06 7.2
9960 Chronic myeloproliferative disease, Cases - - - - 43 37 53 61 78 40 45 40 64 52
NOS CR - - - - 0.09 0.08 0.11 0.12 0.16 0.08 0.09 0.08 0.13 0.10
ASR - - - - 0.08 0.07 0.09 0.10 0.13 0.06 0.07 0.06 0.09 0.07 −2.1
Myelodysplastic syndromea)
9980 Refractory anemia Cases - - - - 76 56 77 73 60 84 61 55 50 59
9982 Refractory anemia with sideroblasts CR - - - - 0.16 0.12 0.16 0.15 0.12 0.17 0.12 0.11 0.10 0.12 ASR - - - - 0.15 0.11 0.14 0.13 0.10 0.14 0.10 0.08 0.08 0.08 −6.4b) 9983 Refractory anemia with excess blasts Cases - - - - 73 84 91 79 131 150 166 167 188 211
CR - - - - 0.15 0.17 0.19 0.16 0.27 0.30 0.33 0.33 0.38 0.42 ASR - - - - 0.14 0.16 0.17 0.14 0.22 0.24 0.25 0.24 0.27 0.29 8.9b) 9985 Refractory cytopenia with multilineage Cases - - - - 18 43 55 55 70 111 133 177 193 148
Dysplasia CR - - - - 0.04 0.09 0.11 0.11 0.14 0.22 0.27 0.35 0.39 0.29
ASR - - - - 0.04 0.08 0.10 0.10 0.12 0.19 0.22 0.27 0.30 0.21 21.7b)
9986 Myelodysplastic syndrome 5q deletion Cases - - - - 0 <5 <5 <5 <5 <5 5 7 <5 6 CR - - - - 0.00 0.00 0.01 0.00 0.00 0.00 0.01 0.01 0.00 0.01
ASR - - - - 0.00 0.00 0.01 0.00 0.00 0.00 0.01 0.01 0.00 0.01 8.9
Supplementary Table 2. Continued.
ICD-O-3
code ICD-O-3 description Year
1999 2000 2001 2002 2003 2004 2005 2006 2007 2008 2009 2010 2011 2012 APC
Myelodysplastic/myeloproliferative neoplasmsa)
9945 Chronic myelomonocytic leukemia Cases - - - - 26 27 22 21 30 25 33 45 54 60
CR - - - - 0.05 0.06 0.05 0.04 0.06 0.05 0.07 0.09 0.11 0.12
ASR - - - - 0.05 0.05 0.04 0.04 0.05 0.04 0.05 0.06 0.07 0.08 5.9b)
9876 Atypical CML, BCR/ABL-1 negative Cases - - - - <5 <5 0 <5 <5 7 5 8 12 14
CR - - - - 0.00 0.00 0.00 0.00 0.00 0.01 0.01 0.02 0.02 0.03 ASR - - - - 0.00 0.00 0.00 0.00 0.00 0.01 0.01 0.01 0.02 0.02 30.8b)
9946 Juvenile myelomonocytic leukemia Cases - - - - 5 7 <5 <5 5 10 9 7 10 5
CR - - - - 0.01 0.01 0.01 0.01 0.01 0.02 0.02 0.01 0.02 0.01
ASR - - - - 0.01 0.02 0.01 0.01 0.01 0.02 0.02 0.02 0.03 0.01 8.5
9975 Myelodysplastic/myeloproliferative Cases - - - - 0 0 0 0 0 0 <5 0 <5 7
neoplasm, Unclassifiable CR - - - - 0.00 0.00 0.00 0.00 0.00 0.00 0.00 0.00 0.00 0.01 ASR - - - - 0.00 0.00 0.00 0.00 0.00 0.00 0.00 0.00 0.00 0.01 71.6 Unknown myeloid neoplasms
9800 Leukemia, NOS Cases 349 338 329 351 291 301 298 293 302 255 290 298 285 300
9801 Acute leukemia, NOS CR 0.74 0.71 0.69 0.73 0.60 0.62 0.61 0.60 0.61 0.52 0.58 0.60 0.57 0.60
ASR 0.76 0.71 0.67 0.69 0.56 0.55 0.53 0.51 0.51 0.41 0.44 0.45 0.41 0.42 −4.8b)
9860 Myeloid leukemia, NOS Cases 25 17 18 8 12 14 17 12 20 13 10 31 27 26
CR 0.053 0.036 0.038 0.017 0.025 0.029 0.035 0.025 0.041 0.026 0.02 0.062 0.054 0.052 ASR 0.054 0.036 0.037 0.016 0.023 0.026 0.033 0.022 0.033 0.022 0.015 0.047 0.041 0.036 −0.4 9805 Acute leukemia, ambiguous lineage Cases <5 <5 <5 18 32 28 26 36 29 42 26 16 29 15
CR 0.00 0.00 0.00 0.04 0.07 0.06 0.05 0.07 0.06 0.09 0.05 0.03 0.06 0.03
ASR 0.00 0.00 0.00 0.04 0.07 0.06 0.05 0.07 0.06 0.09 0.06 0.03 0.06 0.03 21.9b)
All myeloid malignanciesC) Cases 1,255 1,190 1,284 1,410 2,475 2,609 2,758 2,819 3,041 3,281 3,517 3,629 3,885 3,771
CR 2.66 2.50 2.68 2.93 5.12 5.38 5.67 5.77 6.19 6.64 7.08 7.28 7.75 7.49
ASR 2.70 2.50 2.65 2.85 4.86 5.00 5.16 5.13 5.35 5.61 5.78 5.80 6.10 5.70 7.4b)
a)Official registration employing ICD-O-3 began in 2003 at KCCR, b)The annual percent change is statistically significantly different from zero (P<0.05), c)ICD-O-3 codes 9920, 9740, 9741, 9742, 9987, and 9989 were included in all myeloid malignancies.
Abbreviations: CR, crude incidence rate; ASR, age-standardized incidence rate; APC, annual percentage change; APL, acute promyelocytic leukemia; AML, acute myeloid leukemia; CML, chronic myelogenous leukemia; MPN, myeloproliferative neoplasms; NOS, not otherwise specified.