Corresponding author: Kim, Sun Ae https://orcid.org/0000-0002-6896-7459
Department of Nursing, Korea National University of Transportation, 61 Daehak-ro, Jeungpyeong 27909, Korea.
Tel: +82-43-820-5178, Fax: +82-43-820-5173, E-mail: [email protected] Received: Dec 12, 2018 / Revised: Jan 10, 2019 / Accepted: Jan 27, 2019
This is an open access article distributed under the terms of the Creative Commons Attribution Non-Commercial License (http://creativecommons.org/licenses/
by-nc/3.0), which permits unrestricted non-commercial use, distribution, and reproduction in any medium, provided the original work is properly cited.
ORIGINAL ARTICLE Open Access
Systematic Review on the Relationship between Depressive Symptoms and Activities of Daily Living in Cognitively Intact Older Adults
Kwon, Myoungjin
1· Kim, Sun-Ae
2· Seo, Kawoun
31Assistant Professor, Department of Nursing, Daejeon University, Daejeon, Korea
2Assistant Professor, Department of Nursing, Korea National University of Transportation, Jeungpyeong, Korea
3Visiting Professor, Department of Nursing, Hoseo University, Chungnam, Korea, Korea.
Purpose: The purpose of this study was to examine the direction and strength of the relationships between depressive symptoms and Activities of Daily Living (ADLs) among older, cognitively intact adults as reported in observational studies. Methods: A systematic review and meta-analysis were conducted to search the existing published observational studies in five electronic databases. PubMed, EMBASE, PsycINFO, the Cochrane library, CINAHL, and Medline were used from June 2005 to June 2015. The search strategies all used MeSH terms. Studies reporting r-values between depressive symptoms and the ADLs of older adults were included in the meta-analysis.
Overall effect size was computed, and subgroup/moderation analysis was then performed. Results: 16 studies involving 7,184 older adults were identified, and no publication bias was found. The overall effect size was moderate, with a value of -.28. The strength of the effect size was moderated by sample residence type. Conclusion: From the meta-analysis results, it was concluded that the strength of the relationship between depressive symptoms and ADLs was significant. The relationship showed a negative direction in all included studies. Therefore, various nursing intervention programs should be developed to increase the ADL related to depression according to the cognitive status and the residence status of the elderly by nurses.
Key Words: Meta-analysis; Aged; Depression; Activities of daily living
INTRODUCTION
Depression is a major public health concern that not only leads to personal sufferings but also a national eco- nomic burden, as it is related to increased morbidity and mortality. In particular, late-life depressive symptoms are the most prevalent mental health issue affecting older adults [1]. The prevalence of major depressive disorder among older adults in Korea is 5.4~7.5%, which is overall higher than the 3.3~5.6% in adults [2]. In 2017, the number of patients treated for depression in Korea was 667,720, and the total cost of this medical treatment was 255,142 million won [3]. The wide range of prevalence rates of de- pression may be due to differences in functional depend- ence, level of cognitive function, and living situations of research subjects [4,5]. In previous studies, Activities of Daily Living (ADLs) have been interconnected with de-
pressive symptoms and cognitive status in older adults [1,6,7]. However, recent studies have insisted that depres- sive symptoms and cognitive status are independently linked with ADLs, particularly in cases where older adults live independently in their own homes [8,9].
In reviewing the literature, the strength of the association between ADLs and depressive symptoms differed across the studies depending on several factors such as type of res- idence, physical activities, and ethnic background. First, the correlation between depressive symptoms and ADLs of older adults living at home was found to be weak com- pared to the strength of the correlation in case of institu- tionalized older adults; cognitive status might not contrib- ute to the difference in the strength of the correlation be- tween these two groups of older individuals [10]. Second, physical activities seem to mediate the magnitude of the relationship between depression and ADLs through the
beneficial preventive effects on cognitive functioning and associated illnesses [11]. Lastly, few studies have studied the effects of depression separately on levels of ADLs in ethnically diverse populations. While depressive symp- toms can be perceived differently based on different ethnic backgrounds [12], the relationship between depressive symptoms and the level of ability to complete ADLs might be different. For example, research in South Asian and African-American populations revealed significant neg- ative correlations between depressive symptoms and dai- ly routines [13,14]; however, the magnitude was lower in the South Asian sample [13,14]. For this reason, answering the question about a relationship between depressive symptoms and ADLs of older adults of various ethnic and cultural backgrounds may help provide more information about this complex relationship. From a research perspec- tive, this information is required to accurately estimate the sample size for studies targeting individuals with poten- tial risk factors (e.g., living facility type, ADL type, age, and ethnic background). Methodological heterogeneity al- so needs to be considered as a measurement tool to reach a better understanding of the association between late-life depressive symptoms and ADLs [15].
This study examined the relationship between ADLs and depression among community-dwelling older adults through a Systematic Review (SR) and Meta-Analysis (MA).
We synthesized the obtained information to calculate the strength of the relationship. Moreover, we assessed the ex- tent to which this relationship is affected by various fac- tors of interest, such as sample and study characteristics.
The specific objectives were 1) to identify the study charac- teristics; 2) to estimate the publication bias of included studies by examining the funnel plot; 3) to assess the meth- odological quality level of each included study using the appraisal tool for descriptive correlational study design; 4) to estimate the overall effect size for the relationship be- tween ADLs and depressive symptoms; 5) to perform the subgroup analysis that calculate the effect size between studies that has been clearly excluded the cognitively im- paired individuals (controlled) and studies that have been unclearly reported the cognitive impaired (un-controlled);
and 6) to explore the moderators.
METHODS
1. Study DesignThe present study consisted of a SR and MA to integrate and analyze studies on the relationship between depres- sion and ADLs.
2. Data Sources and Review Strategy
Published and unpublished studies measuring the di- rection and strength of the relationship between depres- sive symptoms and ADLs-including instrumental ADLs (IADLs)-were independently extracted by the researchers, who were trained in literature search through a professio- nal program.
Several electronic databases, such as PubMed, EMBASE, PsycINFO, the Cochrane library, CINAHL, and Medline, were used. MeSH terms such as “Aged” [Mesh] OR “Aging”
[Mesh] OR “Housing for the Older adults” [Mesh], “De- pressive symptoms” [Mesh] OR “Depressive Disorder”
[Mesh] AND “Activities of Daily Living”[Mesh] were used to retrieve relevant articles published from June 2005 to June 2015. The Google Scholar search engine was used to locate additional studies that were not listed within the databases mentioned above.
3. Inclusion and Exclusion Criteria
The inclusion criteria of this study were: a) articles writ- ten in English; b) older adult study participants; c) data re- porting the direction and strength of the relationship be- tween depressive symptoms and ADLs; and d) a descrip- tive correlational study design. The scope of primary stud- ies could be limited when applying specific criteria such as study design for synthesizing findings from each primary study [16]. Guided by prior research [16], we included the studies that reported the correlation values between de- pressive symptoms and ADLs.
However, studies were excluded if they: a) reported no information for calculating correlation values between de- pressive symptoms and ADLs; b) were designed as ex- perimental, qualitative, or review studies; and/or c) were published prior to June 2005. Moreover, we excluded stud- ies wherein the older adult subjects had major mental or physical disabilities (e.g., cognitive disabilities, paresthesia, major depressive symptoms, or diagnosed depression, etc.), or who were hospitalized in acute care settings.
4. Publication Bias
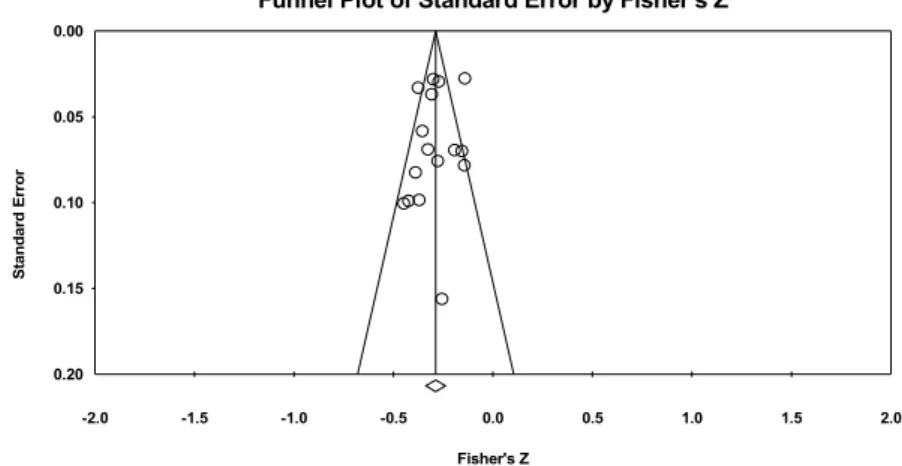
In order to estimate publication bias, two procedures were used to assess whether the studies were skewed due to the selective nature of the inclusion criteria [17]. First, we created a funnel plot using Duval and Tweedie’s trim and fill method and discovered an approximately sym- metrical and null-trimmed study. The asymmetry of the funnel plot suggests that studies reporting a negative rela-
tionship between two variables may not have been published. Second, we also used Egger’s regression inter- cept to determine publication bias. This statistical method uses a funnel plot to test whether the effect sizes depend on the sample size for the individual study [18]; for exam- ple, whether studies with smaller sample sizes may have had the tendency to report larger effect sizes. In the ab- sence of bias, the p-value of Egger’s regression intercept will exceed .050, and there will be a zero-value intercept.
In this MA, the observed p-value (two-tailed) was .550, and the intercept was -.560 (95% Confidence Interval [CI]=
-2.47~1.35). In other words, no significant bias was ob- served in the included studies.
5. The Process of Data Coding and Quality Assess- ment
Several steps were followed for data coding and ex- traction. Two researchers independently searched elec- tronic databases; the identified studies were then classi- fied into inclusion or exclusion groups according to the above-mentioned criteria. Included studies were indepen- dently coded by two researchers according to a coding manual that required the cataloging of the authors; the publication year; study design; sample size; general in- formation about the participants (age, gender, etc.); ethnic composition of the sample; measurement tools; and the main results (correlation values). If inter-coder differences existed, a third researcher (the principal investigator) re- checked and resolved them in a research meeting with all researchers before data entry.
The methodological quality of the included studies was assessed using a cross-sectional appraisal tool consisting of 11 questions [19]. These were adapted from users’
guides to the medical literature that were provided and
“How to use an article about therapy or prevention”[19].
The 11 items had the potential to screen whether or how the studies could: a) address clear issues, b) use proper methodology, c) conduct acceptable subject recruiting me- thods, d) measure accurately, e) justify data collection, f) recruit sufficient numbers of participants, g) report the re- sults, h) analyze the data sufficiently, i) state the findings clearly, j) apply their findings to the local population, and k) contribute to the existing knowledge. Responses to the questions were recorded as “yes”, “no”, or “cannot tell”.
6. Ethical Consideration
This study was approved by the Chungnam National University Institutional Review Board (IRB No.2-1046881-
A-N-01-201607-HR-028-09-03).
7. Data Synthesis and Statistical Analysis
This study’s effect size correlation was calculated using Fisher’s Z transformation: Z=.5×log ((1×r)/(1-r)), and var- iance was set as V=1/(N-3) using the Comprehensive Meta-Analysis 3.0 software program. The effects meas- ured as r≤.10, r=.30, and r≥.50 are small, medium, and large, respectively. These cutoffs are similar to those com- monly used in descriptive correlational study design [20].
The homogeneity test examined the estimation of the overall effect size by calculating the Q statistic and quanti- fied the degree of effect size dispersion using an I2 index.
Values of p>.050 for the obtained Q statistics indicated that the included studies were homogeneous [21].
Moreover, I2 values function as percentages of total var- iance in a set of effect sizes in cases of true heterogeneity [22]. Values of around 25% (I2=25), 50% (I2=50), and 75%
(I2=75) indicate low, medium, and high heterogeneity, re- spectively [18]. If the Q statistics and I2 values require re- jecting the homogeneity assumption, a random-effects model can be applied. The random-effects model allows for generalization to a larger population [16,23]. However, if the included studies are homogeneous, MA can measure the overall effect size using the fixed-effects model [24], since this permits generalization to the study sample [16, 23]. For the overall effect in this study, the random-effects model was used because the heterogeneity test was stat- istically significant. For the subgroup analysis and moder- ating effects, we further examined the effect size according the potential moderators. Furthermore, the effect size var- iance can be inferred due to the fixed moderator and ran- dom effects; therefore, we chose a mixed-effect model for this study. This model is preferred to a fixed-effects model, which hypothesizes that moderators and sampling errors contribute to effect size variability. In this MA, the unit of analysis is a study with a total estimated effect size, while the unit of moderator analysis is effect size [25]. In ob- servational studies, it can be understood that effects of r
≤.10, r=.30, and r≥.50 are small, medium, and large, re- spectively [25].
RESULTS
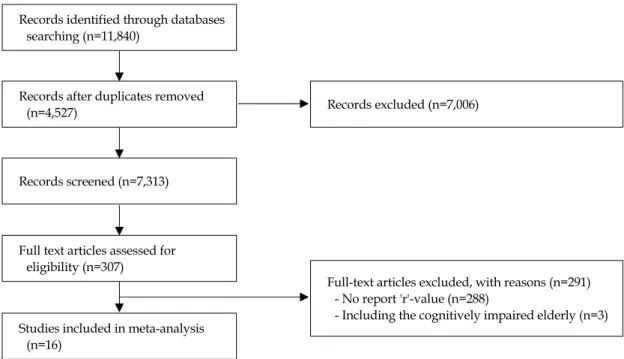
1. Study CharacteristicsA total of 11,840 studies were initially found through the systematic search. After excluding the duplicated and irrelevant articles, the abstracts and full text of the remain-
Records identified through databases searching (n=11,840)
Records screened (n=7,313)
Records excluded (n=7,006)
Full-text articles excluded, with reasons (n=291) - No report 'r'-value (n=288)
- Including the cognitively impaired elderly (n=3) Records after duplicates removed
(n=4,527)
Full text articles assessed for eligibility (n=307)
Studies included in meta-analysis (n=16)
Figure 1. PRISMA flow diagram of screening and selection process of studies.
ing 307 articles were reviewed. Of these studies, 291 did not report the direction or strength of the relationship be- tween ADLs and depressive symptoms among older adults. In all, 16 studies that reported the correlation val- ues were included in the MA. The search strategy is shown in detail in Figure 1.
A total of 7,184 older adults participated in 16 studies, with sample sizes ranging from 44 to 1,308. Among the 16 studies, three were designed as longitudinal surveys [A3, A6, A16] and the design of remaining studies was cross- sectional [A1, A2, A4, A5, A7-15]. Six studies consisted of individuals from Asian countries such as Taiwan, South Korea, Philippines, and Japan [A3, A6, A10-12, A15]. Eight studies examined samples of older adults who lived at home [A2, A3, A6, A7, A10-12, A16]. Most of the partici- pants in the 12 studies were females [A1, A2, A4, A5, A7-10, A13-16], while males made up the majority of par- ticipants in the remaining four studies [A3, A6, A11, A12].
The Geriatric Depression Scale (GDS) was used to meas- ure the severity of depressive symptoms in seven studies [A1, A4, A6, A8, A10, A12, A14]. The remaining studies utilized the Patient Health Questionnaire (PHQ-9) [A5], the Center for Epidemiological Studies Depression Scale (CES-D) [A3, A7, A9, A11, A16], and the Beck Depression Inventory (BDI) [A2]. The included studies also used other means, including assessment of ADLs and IADLs [A1-3, A5-10, A13, A14, A16], to measure ADLs. The main char- acteristics of the 16 studies are presented in Table 1.
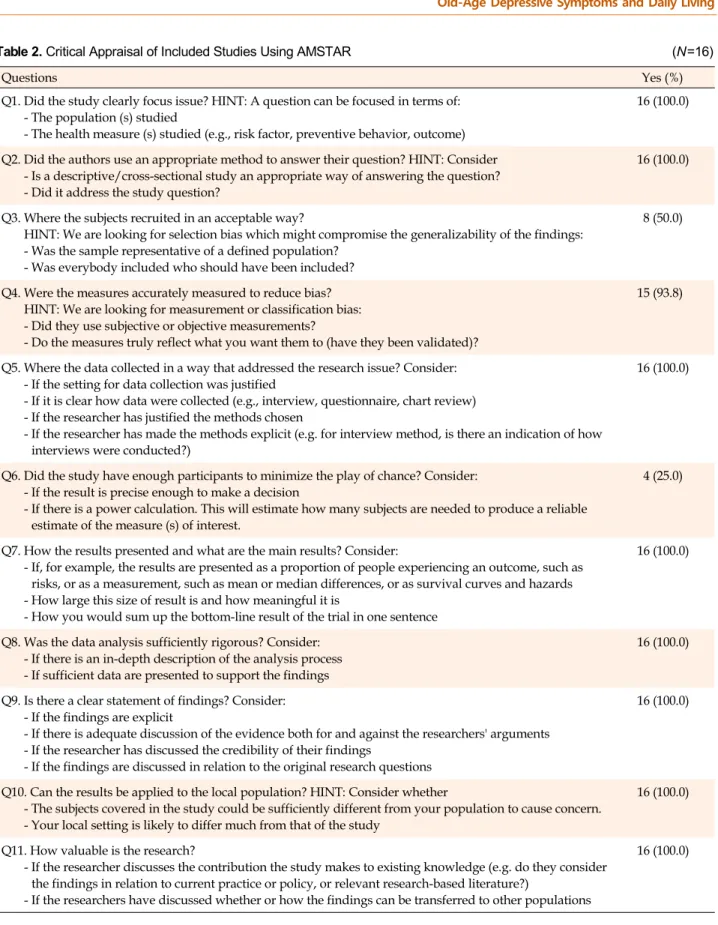
2. Quality Assessment of the Included Studies The quality of the 16 included studies was assessed us- ing the appraisal tool for descriptive correlational study design. Quality was assured as long as the studies met eight of the tool’s 11 items in terms of appropriateness to the issue of interest, proper methodology, data justifica- tion, presentation of results, sufficiency of data analysis, ability to apply the findings to the local population, and clearly discussing findings. However, only four of the in- cluded studies had a sufficient sample size to allow for the nationwide generalization of the study findings. The re- maining 12 studies made no mention of the calculating power for estimating the sample size. The results of each item of the appraisal tool are presented in Table 2.
3. Overall Effect Size for ADLs and Depressive Symptoms
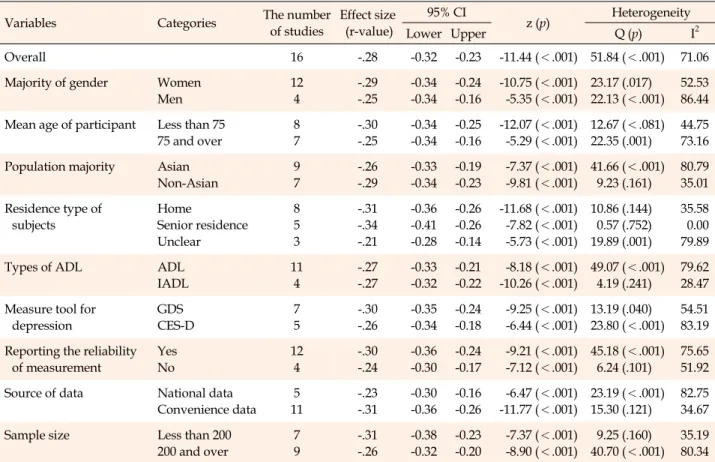
The overall effect size, which represents the strength of the correlation between ADLs and depressive symptoms, for the 16 included studies was r=-.28 (95% CI=-0.32~-0.23).
This overall effect size suggested a moderate association between ADLs and depressive symptoms among older adults. As presented in Table 3, the direction of the rela- tionship observed in all the studies was negative, whereas the effect size r ranged from -.14 to -.42 (Table 3). The forest plot for effect size r of the individual studies and overall studies is shown in Figures 2-1, 2-2.
Table 1. Study Characteristics of 16 Included Studies AuthorsDesignSample sizeMean age, years PopulationGender(%)Assessment toolr-value between depression and ADLDepressionADL Unsar et al. (2015) [A14]Cross-sectional survey91268.05 (Range: 60~94)Turkish W(55.8) M(44.2)GDS:30 items Cronbach's ⍺ 0.84Katz Activities of Daily Living Scale (bathing, dressing, toilet needs, transfer, continence, feeding), Cronbach's ⍺ .94
-.35(p<.001) Kim & Choi (2015) [A10]Cross-sectional survey25281.36 (Range: 65~98)Korean American W(70.0) M(30.0)GDS-15 items Reliability: .81ADL: 6 items Cronbach's ⍺: .79-.19(p<.010) Chao(2014) [A3]Longitudinal study1,26882.72 (Range: 74~106)TaiwanW(49.3) M(50.7)CES-D: 10 items Cronbach's ⍺: .84~.85IADL: 5 items No report the value of reliabilityMean r-value: -.29 Imai et al. (2014) [A6]Longitudinal survey73674.30Japanese living in Tosa town W(44.8) M(55.2)GDS: 15 items (cut-point: 5 or more → determination the depression) No report the value of reliability
BADL(7-item-walking, ascending and descending stairs, feeding, dressing, going to the toilet, bathing, grooming) No report the value of reliability
Mean r-value of ADL (2005~2006): -.31 Mean r-value of IADL (2005~2006): -.28 Gitlin et al. (2014) [5]Cross-sectional survey17769.50African American W(79.1) M(20.9)PHQ-9: 9 items Cronbach's ⍺ .78Mobility and IADL/ADL:18 items Cronbach's ⍺ .91-.20(p<.010) Jahn & Cukrowicz (2012) [A7]
Cross-sectional survey9870.89 (Range: 60~93)American: Caucasian (92.0%)
W(74.0) M(26.0)CES-D: 20 items Cronbach's ⍺ .90IADL: no report the number of items Cronbach's ⍺ .80-.35(p<.010) Altiok et al. (2012) [A1]Cross-sectional survey16667.34TurkishW(55.4) M(44.6)GDS-SF: no report the number of items No report the value of reliability
ADL: no report the number of items No report the value of reliability-.14(p<.050) Lu(2011) [A11]Cross-sectional survey130876.55TaiwanW(49.3) M(50.7)CES-D: 11 items Cronbach's ⍺ .84Physical health:(self-perceived health, independence in daily functioning, disability or difficulty in performing activities of daily living) Cronbach's ⍺ .89
1) Perceived health: -.50(p<.001), 2) Independence in daily functioning: -.14(p<.001), 3) Disability in performing activities of daily living: -.26(p<.001) ADL=activities of daily living; BADL=basic activities of daily living; BDI=Beck depression inventory; CES-D=center for epidemiological studies depression scale; CSDD=Cornell scale for depression dementia; GDS=geriatric depression scale; GDS-Mob=geriatric depression scale-mobility; GDS-PAD=geriatric depression scale-physical activity dissatisfaction; GDS-PF=geriatric depression scale-physical functioning; GDS-SF=geriatric depression scale-short form; IADL=instrumental activities of daily living; PHQ-9=patient health questionnaire; PPS=physical performance scale.
Table 1. Study Characteristics of 16 Included Studies (Continued) AuthorsDesignSample sizeMean age, years PopulationGender(%)Assessment toolr-value between depression and ADLDepressionADL Shin et al. (2010) [A12]Cross-sectional survey21373.35South Korean W(23.9) M(76.1)Korean GDS: 30 items Cronbach's ⍺ 0.89Barthel Index(0~100): grooming, walking, bladder & bowel control, dressing, climbing chairs, feeding, bathing Cronbach's ⍺ .76
-.31(p<.001) Bozo et al. (2010) [A2]Cross-sectional survey10271.69 (Range: 60~87)TurkishW(64.7) M(35.3)BDI: 21 items Reliability=.86ADL & IADL: 17 items Reliability=.90-.42(p<.010) Jang et al. (2010) [A9]Cross-sectional survey29776.0 (Range: 60~105)HispanicW(73.0) M(27.0)CES-D: 10 items Cronbach's ⍺ .79ADL & IADL: 9 items-.34(p<.001) Jang et al. (2007) [A8]Cross-sectional survey15082.80American Caucasian (91.0%)
W(77.0) M(23.0)GDS-SF: 15 items Cronbach's ⍺ 0.89Functional disability(17 items): ADL, IADL, PPS, Functional Health Scale Cronbach's ⍺ 0.88
-.37(p<.001) Watanabe et al. (2007) [A15]Cross-sectional survey4484.0JapaneseW(75.0) M(25.0)CSDD: 19 items Cronbach's ⍺ .84~.86Functional Independence Measure: 18 items No report the value of reliability
-.25(p=.010) Gardner & Helmes(2006) [A4]
Cross-sectional survey10576.09 (Range: 65~90)AustraliaW(61.9) M(38.1)GDS: 30 items Cronbach's ⍺: 0.82~0.94Physical Functioning Measure (cited in McDowell & Newell, 1996) Cronbach's ⍺ of physical functioning: .92 and mobility scale: .71
GDS-PAD: -.54(p<.010) GDS-Mob: -.44(p<.010) GDS-PF: -.40(p<.010) Yang(2006) [A16]Longitudinal study1,14971.11 (Range 65~92)Caucasian (64.4%), African American (35.6%)
W(61.7) M(39.3)Modified CES-D: range 0~20 No report the value of reliability Functional disability, Physical Performance, Health Scale for the aged that indicates mobility disability, IADL, ADL No report the value of reliability
-.26(p<.001) Steele et al. (2005) [A13]Cross-sectional survey20775.8American Caucasian (91.0%), African American (7.0%)
W(81.0) M(19.0)Single item that asked participants if they were depressed BADL(bathing, etc.), Physical IADL (light housework etc.), Cognitive IADL(using the telephone etc.) No report the value of reliability
BADL: -.14(p<.050) Physical IADL: -.16(p<.050) Cognitive IADL: -.15(p<.050) ADL=activities of daily living; BADL=basic activities of daily living; BDI=Beck depression inventory; CES-D=center for epidemiological studies depression scale; CSDD=Cornell scale for depression dementia; GDS=geriatric depression scale; GDS-Mob=geriatric depression scale-mobility; GDS-PAD=geriatric depression scale-physical activity dissatisfaction; GDS-PF=geriatric depression scale-physical functioning; GDS-SF=geriatric depression scale-short form; IADL=instrumental activities of daily living; PHQ-9=patient health questionnaire; PPS=physical performance scale.
Table 2. Critical Appraisal of Included Studies Using AMSTAR (N=16)
Questions Yes (%)
Q1. Did the study clearly focus issue? HINT: A question can be focused in terms of:
- The population (s) studied
- The health measure (s) studied (e.g., risk factor, preventive behavior, outcome)
16 (100.0)
Q2. Did the authors use an appropriate method to answer their question? HINT: Consider - Is a descriptive/cross-sectional study an appropriate way of answering the question?
- Did it address the study question?
16 (100.0)
Q3. Where the subjects recruited in an acceptable way?
HINT: We are looking for selection bias which might compromise the generalizability of the findings:
- Was the sample representative of a defined population?
- Was everybody included who should have been included?
8 (50.0)
Q4. Were the measures accurately measured to reduce bias?
HINT: We are looking for measurement or classification bias:
- Did they use subjective or objective measurements?
- Do the measures truly reflect what you want them to (have they been validated)?
15 (93.8)
Q5. Where the data collected in a way that addressed the research issue? Consider:
- If the setting for data collection was justified
- If it is clear how data were collected (e.g., interview, questionnaire, chart review) - If the researcher has justified the methods chosen
- If the researcher has made the methods explicit (e.g. for interview method, is there an indication of how interviews were conducted?)
16 (100.0)
Q6. Did the study have enough participants to minimize the play of chance? Consider:
- If the result is precise enough to make a decision
- If there is a power calculation. This will estimate how many subjects are needed to produce a reliable estimate of the measure (s) of interest.
4 (25.0)
Q7. How the results presented and what are the main results? Consider:
- If, for example, the results are presented as a proportion of people experiencing an outcome, such as risks, or as a measurement, such as mean or median differences, or as survival curves and hazards - How large this size of result is and how meaningful it is
- How you would sum up the bottom-line result of the trial in one sentence
16 (100.0)
Q8. Was the data analysis sufficiently rigorous? Consider:
- If there is an in-depth description of the analysis process - If sufficient data are presented to support the findings
16 (100.0)
Q9. Is there a clear statement of findings? Consider:
- If the findings are explicit
- If there is adequate discussion of the evidence both for and against the researchers' arguments - If the researcher has discussed the credibility of their findings
- If the findings are discussed in relation to the original research questions
16 (100.0)
Q10. Can the results be applied to the local population? HINT: Consider whether
- The subjects covered in the study could be sufficiently different from your population to cause concern.
- Your local setting is likely to differ much from that of the study
16 (100.0)
Q11. How valuable is the research?
- If the researcher discusses the contribution the study makes to existing knowledge (e.g. do they consider the findings in relation to current practice or policy, or relevant research-based literature?)
- If the researchers have discussed whether or how the findings can be transferred to other populations
16 (100.0)
4. Subgroup Analyses
To compare the effect size for the relationship between depressive symptoms and ADLs, whether the studies that
have clearly excluded the cognitively impaired and un- clearly reported the cognitively impaired, subgroup anal- ysis was performed according to the control of the cogni- tive function. As a result, the effect size was r=-.30 (95%
-2.0 -1.5 -1.0 -0.5 0.0 0.5 1.0 1.5 2.0 0.00
0.05
0.10
0.15
0.20
Standard Error
Fisher's Z
Funnel Plot of Standard Error by Fisher's Z
Figure 2-1. Funnel plot using trim and fill method for assessing the publication bias (n=16).
Figure 2-2. Forest plot (n=16).
Figure 2-3. Subgroup analysis whether to control the cognitive impaired.
Figure 2. Funnel plot, forest plot & subgroup analysis.
Table 3. Overall Effect Size and Subgroup Analysis (N=16)
Variables Categories The number
of studies
Effect size (r-value)
95% CI
z (p) Heterogeneity
Lower Upper Q (p) I2
Overall 16 -.28 -0.32 -0.23 -11.44 (<.001) 51.84 (<.001) 71.06
Majority of gender Women Men
12 4
-.29 -.25
-0.34 -0.34
-0.24 -0.16
-10.75 (<.001) -5.35 (<.001)
23.17 (.017) 22.13 (<.001)
52.53 86.44 Mean age of participant Less than 75
75 and over
8 7
-.30 -.25
-0.34 -0.34
-0.25 -0.16
-12.07 (<.001) -5.29 (<.001)
12.67 (<.081) 22.35 (.001)
44.75 73.16 Population majority Asian
Non-Asian
9 7
-.26 -.29
-0.33 -0.34
-0.19 -0.23
-7.37 (<.001) -9.81 (<.001)
41.66 (<.001) 9.23 (.161)
80.79 35.01 Residence type of
subjects
Home
Senior residence Unclear
8 5 3
-.31 -.34 -.21
-0.36 -0.41 -0.28
-0.26 -0.26 -0.14
-11.68 (<.001) -7.82 (<.001) -5.73 (<.001)
10.86 (.144) 0.57 (.752) 19.89 (.001)
35.58 0.00 79.89
Types of ADL ADL
IADL
11 4
-.27 -.27
-0.33 -0.32
-0.21 -0.22
-8.18 (<.001) -10.26 (<.001)
49.07 (<.001) 4.19 (.241)
79.62 28.47 Measure tool for
depression
GDS CES-D
7 5
-.30 -.26
-0.35 -0.34
-0.24 -0.18
-9.25 (<.001) -6.44 (<.001)
13.19 (.040) 23.80 (<.001)
54.51 83.19 Reporting the reliability
of measurement
Yes No
12 4
-.30 -.24
-0.36 -0.30
-0.24 -0.17
-9.21 (<.001) -7.12 (<.001)
45.18 (<.001) 6.24 (.101)
75.65 51.92 Source of data National data
Convenience data 5 11
-.23 -.31
-0.30 -0.36
-0.16 -0.26
-6.47 (<.001) -11.77 (<.001)
23.19 (<.001) 15.30 (.121)
82.75 34.67
Sample size Less than 200
200 and over
7 9
-.31 -.26
-0.38 -0.32
-0.23 -0.20
-7.37 (<.001) -8.90 (<.001)
9.25 (.160) 40.70 (<.001)
35.19 80.34 ADL=activities of daily living; IADL=instrumental activities of daily living; BADL=basic; GDS=geriatric depression scale; CES-D=center for epidemiological studies depression scale; CI=confidence interval.
CI=-0.33~-0.27) in controlled studies (n=7), whereas r=
-.26 (95% CI=-0.29~-0.25) found in uncontrolled studies (n=9). The result shows in Figure 2-3.
5. Moderation Analyses
As demonstrated in Table 3, population characteristics such as gender (Men/Women), mean age (75+ vs. less than 75), Asian populations (Yes vs. No), and residence type (Home vs. Facility), were used as possible moderators.
The strength of the relationship between ADLs and de- pressive symptoms tended to be larger in studies in which the majority of the participants were females (n=12) fe- males [A1, A2, A4, A5, A7-10, A13-16] ; the mean partic- ipant age was under 75 years (n=8)[A3, A8-11, A15, A16];
and the majority of the participants were not Asian (n=9) [A1-3, A6, A10-12, A14, A15]. The effect size of residing in a senior residence was greater than studies in which the participants were living at home and for the ones in which the participants’ living situations were unclear (n=5) [A1, A5, A8, A13, A14]. The studies focusing on ADL (n=11) [A1-4, A7, A10-14, A16]; a tool to assess GDS (n=7) [A1,
A4, A6, A8, A10, A12, A14]; convenience sample data (n=11) [A1, A2, A5-7, A9, A10, A12-15]; a sample size of less than 200 (n=7) [A1, A2, A4, A5, A7, A8, A15]; and the reporting of the reliability values (n=12) [A2-5, A7-12, A14, A15] had larger effect sizes (r -values) than did com- parative studies (Figure 2-3).
DISCUSSION
The findings of this MA showed that all the included studies reported the relationship between ADLs and de- pressive symptoms in a negative direction among com- munity-dwelling older adults. This moderate-strength relationship between ADLs and depressive symptoms among older adults was significant in most studies. Lack of ADLs significantly increased the depressive symptoms experienced by older adults. Although this MA was un- able to reveal a causal relationship between the two fac- tors, it was found that failure to successfully perform daily routines may lead to an increase in older adults’ depen- dency. This, in turn, may lead to an increased tendency ex- hibit depressive symptoms. Conversely, persistent depres-
sive symptoms may aggravate physical disabilities over time [13,26]. However, this relationship strength was not revealed in similar ways in all the included studies. When the 16 included studies were synthesized to obtain the overall effect size for this MA, it was found that the studies were not homogeneous in this regard, and that their in- dividual effect sizes ranged from .14 to .42. Even after ap- plying the necessary criteria for obtaining homogeneity, the strength of the relationship between ADLs and depres- sive symptoms was found to vary throughout the in- cluded studies. It is an important distinction that the target populations of these studies were relatively healthy com- munity-dwelling older adults who were not as cognitively impaired as anticipated in the inclusion criteria. Since cog- nition plays an integral role in the execution of most phys- ical tasks [26], when the cognitive role was excluded, the strength of the relationship between the two was clear in this subgroup analysis.
The effect size r value was greater in studies that cogni- tive impaired was precisely excluded as use the assess- ment tool than counter studies. Older adults who either live at home or are not institutionalized generally tend to be independent in basic ADLs [4]. One study found no statistically significant relationship between ADLs and depressive symptoms. Although this study gave no ex- planation for this non-significant relationship, one possi- ble reason is that despite being recruited from a family health center, most subjects (72%) were able to go for regu- lar walks to visit their outpatient clinics; such activity may have affected the weak association between ADLs and de- pressive symptoms [4].
Likewise, the strength of the association between ADLs and depressive symptoms was affected by various study characteristics. Moderation analysis was performed to identify the influencing factors that contributed to the dif- ferences of strength of association according to certain population characteristics (gender, mean age, ethnic ma- jority, residential type, types of ADL) and study character- istics (measurement tools used to assess depressive symp- toms, data sources, sample size, and presence of measure- ment reliability reports). Among possible moderators, res- idential type was a significant moderator in the strength of association between ADLs and depressive symptoms. The studies in which the participants lived in senior housing reported relationships of the greatest strength. Moreover, we found that the strength of association tended to be higher in studies that had a majority of participants who were female, non-Asians, or under the age of 75 years.
The effect sizes were also slightly different depending on the types of measurement tools used to assess physical
activity and depressive symptoms, and the presence of re- porting of reliability, data sources, and sample sizes. This implies that the effect size was greater in studies that measured IADLs than in studies that measured ADLs.
Moreover, ADLs were assessed using the Barthel Index, the Physical Performance Scale, and the ADL Measure in four studies. In order to measure the depressive symp- toms, seven studies used either the 15-item or 30-item GDS. The effect sizes in the studies that used GDS were higher than in those that used the CES-D. This should be considered when assessing depression among older adults.
The GDS was designed specifically for use with older adults [27], whereas the CES-D was developed to measure depressive symptoms among the general population [28].
Studies on community-dwelling older adults have pre- ferred to use the GDS for assessing depressive symptoms because the items require simple (yes/no) responses. Ad- ditionally, this tool states sensitive issues relevant to older adults in a manner that is easy to understand and respond to [27].
Along with measurement tool type, the studies that re- ported reliability demonstrated strong associations be- tween ADLs and depressive symptoms. However, four studies among 16 did not report the reliabilities of their tools. Even though the effect size differences in reporting reliability were not statistically significant, rigorous atten- tion should be paid during the publication process to whether a tool’s reliability is addressed.
In the context of sampling method, the sample sizes of studies that used the convenience sample were much low- er than 200, as compared to the random sampling of the studies using national data. The smaller (a sample size of fewer than 200 people) studies demonstrated stronger as- sociations between ADLs and depressive symptoms than did studies using national data. Even though the strength of the association between ADLs and depressive symp- toms was not moderated by sample sizes in this MA, this tendency can be explained by the characteristics of the cor- relation value. If the sample size is large, even a very small correlation can be generally statistically significant [20].
Another important point in terms of sample size should be considered; that is, the power calculation for estimating the sample size was not observed in 12 studies. During the critical appraisal process, most of the questions asked about the quality of the 16 studies were answered favor- ably, except for the questions that dealt with the sampling method (Questions 3 and 6).
The results of this MA demonstrate the overall strength and direction of the relationship between ADLs and de- pressive symptoms among community-dwelling older
adults; however, some limitations remain. In this MA, many studies that investigated the relationship between ADLs and depressive symptoms among a sample with cognitively and physically impaired older adults living in acute care settings were excluded. More studies of rela- tively healthy community-dwelling older adults are need- ed to identify the significant moderating factors by synthe- sizing the results from individual studies.
Despite its limitations, this MA was the first attempt to synthesize information concerning the strength and di- rection of the association between ADLs and depressive symptoms among community-dwelling older adults. These findings may help to determine the effect size should be entered during power analysis, and the factors that should be considered during estimations of the relationship be- tween ADLs and depressive symptoms among this aging population.
Moreover, several suggestions can be proposed regard- ing practical nursing intervention. When assessing the lev- el of depression in community-dwelling older adults, ADLs should be considered and monitored. In this study, we could not include the studies that focused on cognitive dysfunction because of the small number of studies on im- paired cognitive status. In future studies, the research on the relationship between depression and ADLs in cogni- tively impaired older adults should be expanded. As re- search accumulates, the magnitude of the effects of de- pression and ADLs in older adults can be compared ac- cording to their cognitive status.
CONCLUSION
Considering the increasing life expectancy worldwide, community healthcare providers should be concerned about older adults’ depression and ADLs, especially among those with a cognitive decline as well as a relatively bet- ter cognitive functioning. Based on the results from this SR and MA, we provisionally conclude that there is a sig- nificant negative association between ADLs and depres- sive symptoms, and this relationship is of moderate strength. ADLs and depressive symptoms of commun- ity-dwelling and relatively healthy older adults should be continuously assessed by community mental healthcare providers using validated tools. This could help identify the potential factors (e.g. cognitive change) involved in de- pressive symptoms and ADLs according to changes in the physical and mental health of older adults.
Moreover, from a research perspective, researchers can estimate the sample size for the overall effect size in a sam- ple of community-dwelling older adults when applying
the power analysis. However, further MAs should be con- ducted to confirm this relationship by using data accumu- lated from individual studies.
CONFLICTS OF INTEREST
The authors declared no conflict of interest.
AUTHORSHIP
Study conception and design acquisition - KM; Data collection- KM, KS-A, SK; Analysis and interpretation of the data - KM, KS-A, SK; Drafting and critical revision of the manuscript - KM, KS-A.
ACKNOWLEDGEMENT
This research was supported by the Daejeon University Research Grants (2016).
REFERENCES
1. Bruce ML. Depressive symptoms and disability in late life: di- rections for future research. The American Journal of Geriatric Psychiatry. 2001;9(2):102-12.
https://doi.org/10.1097/00019442-200105000-00003
2. Health Insurance Review & Assessment Service. What are the most common mental illness by age group? [Internet]. Seoul:
Health insurance & assessment service; 2018 [cited 2019 Janu- ary 08]. Available from:
https://www.hira.or.kr/co/search.do?searchWord=%EC%9 7%B0%EB%A0%B9%EB%8C%80%EB%B3%84+%EB%A7%8 E%EC%9D%B4+%EB%82%98%ED%83%80%EB%82%98%EB
%8A%94+%EC%A0%95%EC%8B%A0%EA%B1%B4%EA%B 0%95+%EC%A7%88%ED%99%98%EC%9D%80%3F 3. Park JH, Kim KW. A review of the epidemiology of depression
in Korea. Journal of the Korean Medical Association. 2011;54 (4):362-9. https://doi.org/10.5124/jkma.2011.54.4.362 4. Altiok M, Yilmaz M, Onal P, Akturk F, Temel GO. Relationship
between activities of daily living, sleep and depression among the aged living at home. Pakistan Journal of Medical Sciences.
2012;28(1):162-6.
5. Smalbrugge M, Pot AM, Jongenelis L, Gundy CM, Beekman ATF, Eefsting JA. The impact of depression and anxiety on well being, disability and use of health care services in nursing home patients. International Journal of Geriatric Psychiatry.
2006;21(4):325-32. https://doi.org/10.1002/gps.1466 6. Han JH, Park KM, Park H. Effects of laughter therapy on de-
pression and sleep among patients at long-term care hospitals.
Korean Journal of Adult Nursing. 2017;29(5):560-8.
https://doi.org/10.7475/kjan.2017.29.5.560
7. Song H-J, Meade K, Akobundu U, Sahyoun NR. Depression as a correlate of functional status of community-dwelling older adults: utilizing a short-version of 5-item Geriatric Depression