INTRODUCTION
As the hypertension has been known as a major risk factor of cardiovascular disease, cerebrovascular disease, congestive heart failure, chronic renal failure, and peripheral vascular dis- ease (1-3), the primary prevention of hypertension is very important (4, 5). Among the known risk factors of hyperten- sion in westernized populations,‘high-normal blood pressure (HNBP)’is especially important for the prevention of hyper- tension because it can be detected early and controlled by some drugs. However, there has been no prospective study of iden- tifying the HNBP as a risk factor of hypertension in Koreans, so that an active prevention of hypertension by the control of HNBP has not been done. This study was done to elucidate the HNBP as a risk factor of hypertension to be applied in the primary prevention strategy in Korean population.
MATERIALS AND METHODS
To identify the HNBP as a risk factor of hypertension, an individual level of blood pressure should be taken before the occurrence of hypertension. Especially for the causal relation- ship, a prospective cohort study should be done after getting
information on confounders as well as potential risk factors.
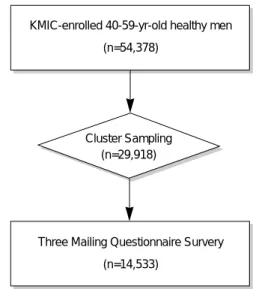
The study cohort was constructed from the Seoul Cohort, which is comprised of 54,378 men (Fig. 1). The eligibility criteria for the Seoul Cohort were that subjects were male bene- ficiaries of the Korea Medical Insurance Corporation (KMIC)
Jong-Myon Bae, Yoon-Ok Ahn*
Department of Preventive Medicine, Cheju National University College of Medicine, Cheju; Department of Preventive Medicine*, Seoul National University College of Medicine, Seoul, Korea
Address for correspondence Jong-Myon Bae, M.D.
Department of Preventive Medicine, Cheju National University College of Medicine, Ara-1-dong, Cheju 690-756, Korea
Tel : +82.64-755-5567, Fax : +82.64-725-2593 E-mail : [email protected]
*This work was supported by the Korea Research Foundation in 1997 (BM97-197).
�Korean version of this paper was published on Kore- an Journal of Preventive Medicine 32(4): 526-537 in 1999.
328
A Nested Case-Control Study on the High-Normal Blood Pressure as a Risk Factor of Hypertension in Korean Middle-Aged Men
The aim of this study was to identify the ‘high-normal blood pressure’ as a risk factor of hypertension for applying primary prevention strategy in Korean people.
To keep time sequence of events, and to prevent information bias, nested case- control study was chosen for avoiding measurement errors because hypertension is a benign disease. Source population consisted of the ‘Seoul Cohort’ participants and follow-up was done by using Korea Medical Insurance Corporation’s database on the utilization of health services from January 1, 1993 to June 30, 1997. Inci- dence cases were ascertained through the chart review, telephone contacts, and direct blood pressure measurements. Controls included the pairing of 4 individuals to each case on the basis of age. The statistically significant risk factors of hyper- tension were body mass index, dietary fiber, alcohol consumption, weekly activity, and history of quitting smoking as well as high-normal blood pressure (p<0.05).
The multivariate odds ratio of high-normal blood pressure adjusted for all risk factors was 1.84 (95% CI, 1.31-2.56). Thus, the ‘high-normal blood pressure’ is considered as a risk factor for hypertension in Korean middle-aged men, which suggests that the vigorous lifestyle modification for persons with ‘high-normal blood pressure’ is needed.
Key Words : Primary Prevention; Hypertension; Case-control Study
Fig. 1. Flow chart of Seoul Cohort construction.
KMIC-enrolled 40-59-yr-old healthy men (n=54,378)
Three Mailing Questionnaire Survery (n=14,533)
Cluster Sampling (n=29,918)
Received : 26 September 2001 Accepted : 21 February 2002
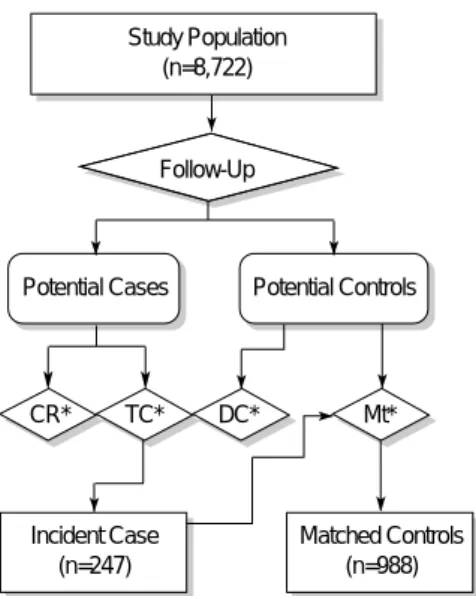
Fig. 3. Flow chart of selection of cases and controls (CR: chart review; TC: telephone contact; DC: direct contact; Mt: age- matching).
Fig. 2. Flow chart of recruiting study population.
Source Population (Seoul Cohort) (n=14,533)
92 Screening Measurement
Direct Contact
Adjustment Eligible Population
(n=8,870)
Study Population (n=8,772)
Study Population (n=8,722)
Follow-Up
Potential Cases Potential Controls
CR* TC* DC* Mt*
Incident Case (n=247)
Matched Controls (n=988)
Age (yr) NS
40-44 372 (37.65) 93 (37.65) 1.00
45-49 324 (32.79) 81 (32.79) -
50-54 236 (23.89) 59 (23.89) -
55-59 56 ( 5.67) 14 ( 5.67) -
Marriage -
married 968 (98.47) 245 (99.19) 1.00
single 15 ( 1.53) 2 ( 0.81) 0.53 [0.08, 2.42]
Education (yr) NS
≤11 167 (17.41) 27 (11.20) 1.00
12-15 389 (40.56) 111 (46.06) 1.76 [1.09, 2.87]
16≤ 403 (42.02) 103 (42.74) 1.58 [0.98, 2.57]
Occupation NS
Management 263 (27.51) 67 (27.80) 1.00
Clerical workers 463 (48.43) 125 (51.87) 1.06 [0.75, 1.50]
Laborer 230 (24.06) 49 (20.33) 0.84 [0.54, 1.28]
SEI+ NS
<3.0 234 (34.01) 56 (32.75) 1.00
3.0-<4.0 158 (22.97) 37 (21.64) 0.98 [0.60, 1.59]
4.0≤ 296 (43.02) 78 (45.61) 1.10 [0.74, 1.65]
Initial blood pressure -
Normal 401 (40.59) 62 (25.10) 1.00
High-normal 587 (59.41) 185 (74.90) 2.04 [1.47, 2.83]
Body mass index (kg/M2) 0.05
<20 92 ( 9.39) 9 ( 3.64) 1.00
20≤-<25 695 (70.92) 178 (72.06) 2.62 [1.25, 5.67]
25+ 193 (19.69) 60 (24.29) 3.18 [1.45, 7.20]
Family history of hypertension
No 823 (86.18) 196 (82.70) 1.00
Yes 132 (13.82) 41 (17.30) 1.30 [0.87, 1.95]
*Missing values were excluded. +SEI (Social Economic Index)=monthly electric costs (\1,000)/number of family members.
Variables Control group
(column%)
Crude
OR 95% CI
Case group (column%)
p-value ( 2for trend) Table 1. Comparisons of sociodemographic factors and anthropometric values between incident cases (n=247) and controls (n=988) among Seoul Cohort Study, 1992*
and confirmed as healthy people by the medical screening in 1990; 40 to 59 yr of age; living in Seoul, the largest city in Korea; and were respondents to a self-administered question- naire survey distributed via mail in 1991 (6-8) (Fig. 2). The KMIC includes the government employees, schoolteachers, and pensioners living with their families since 1978. The total number of the beneficiaries was around 4.7 million in 1993, which is about 11% of the total Korean population. The age distribution of the Seoul Cohort members was very similar to that of the Korean population. The data of blood pressure
levels of the source population was obtained by the biennial screening survey done in 1990 by KMIC.
As the hypertension could be treated as an outpatient and attributed to a measurement error, identification of incident cases using only the follow-up system is not appropriate.
Hence, a nested case-control study with new selection criteria for incident cases was taken for elucidating a causal relation- ship. The subcohort participants were those who had systolic blood pressure below 140 mmHg and diastolic blood pressure below 90 mmHg in screening test in 1992 among the nor-
Smoking history NS
No 218 (22.52) 48 (19.67) 1.00
Quit 243 (25.10) 82 (33.61) 1.53 [1.01, 2.33]
Yes 507 (52.38) 114 (46.72) 1.02 [0.69, 1.51]
Total cigarette index NS
(pack-year) 0 223 (23.77) 52 (21.85) 1.00
1-10 155 (16.52) 49 (20.59) 1.36 [0.85, 2.16]
11-15 79 ( 8.42) 31 (13.03) 1.68 [0.98, 2.90]
16-20 111 (11.83) 25 (10.50) 0.97 [0.55, 1.69]
21-34 273 (29.10) 56 (23.53) 0.88 [0.57, 1.36]
35+ 97 (10.34) 25 (10.50) 1.11 [0.63, 1.94]
Drinking history -
No 151 (17.16) 33 (13.98) 1.00
Yes 729 (82.84) 203 (86.02) 1.27 [0.83, 1.96]
Weekly amounts of ethanol intake 0.01
(g/week) 0 151 (17.16) 33 (13.98) 1.00
1-70 249 (28.30) 52 (22.03) 0.96 [0.58, 1.59]
71-280 230 (26.14) 60 (25.42) 1.19 [0.73, 1.97]
281-560 127 (14.43) 55 (23.31) 1.98 [1.18, 3.34]
561+ 123 (13.98) 36 (15.25) 1.34 [0.76, 2.35]
*Missing values were excluded.
Variables Control group
(column%)
Crude
OR 95% CI
Case group (column%)
p-value ( 2for trend) Table 2. Comparisons of smoking and drinking habits between incident cases (n=247) and controls (n=988) among Seoul Cohort Study, 1992*
Daily sleeping time NS
(hr/day) -6 319 (32.65) 69 (27.94) 1.00
7-8 619 (63.36) 166 (67.21) 1.24 [0.90, 1.71]
9+ 39 ( 3.99) 12 ( 4.86) 1.42 [0.67, 2.99]
Sitting time NS
(hr/day) -2 872 (88.98) 218 (88.26) 1.00
3-6 95 ( 9.69) 26 (10.53) 1.09 [0.67, 1.77]
7+ 13 ( 1.33) 3 ( 1.21) 0.92 [0.21, 3.50]
Weekly physical activity NS
(times/week) 0 340 (35.38) 82 (33.47) 1.00
1-3 489 (50.88) 144 (58.78) 1.22 [0.89, 1.67]
4+ 132 (13.74) 19 ( 7.76) 0.60 [0.34, 1.05]
Total energy expenditure NS
(Kcal/day) <2,142 247 (25.76) 57 (23.36) 1.00
2,142-<2,358 225 (23.46) 55 (22.54) 1.06 [0.69, 1.63]
2,358-<2,635 246 (25.65) 60 (24.59) 1.06 [0.69, 1.61]
2,635≤ 241 (25.13) 72 (29.51) 1.29 [0.86, 1.95]
*Missing values were excluded.
Variables Control group
(column%)
Crude
OR 95% CI
Case group (column%)
p-value ( 2for trend) Table 3. Comparisons of physical activity between incident cases (n=247) and controls (n=988) among Seoul Cohort Study, 1992*
motensive participants of the Seoul Cohort.
Follow-up was done from January 1, 1993 to June 30, 1997 using the medical treatment claims (MTC) database of KMIC, which were sent from the medical care institution whenever a beneficiary received any treatment. If a study subject had a diagnostic code of 401-405 on ICD-9 or I10-I15 on ICD- 10 during the follow-up period, we regarded him/her as a potential case. The incident date was defined as the earliest date of receiving treatments. However, since the MTC database of KMIC was only the secondary data source, the potential case had to be confirmed as an incident case. We performed three methods as review of medical records through the hos- pital survey, telephone contacts, and direct measurements of blood pressure.
An incident case was defined as follow: first, a blood pres- sure level meeting the criteria of hypertension on JNC VI (9) or a history of taking some anti-hypertensive drugs in the medical review; second, a history of diagnosis with hyperten- sion in telephone contacts; third, a blood pressure level meet- ing the criteria of hypertension on JNC VI in direct measure-
ment. The participants of Seoul Cohort excluding the poten- tial cases were considered as potential controls. Among them, controls were selected by frequency matching with 1-to-4 ratio according to the year of birth in each case. Three kinds of methods for case identification-chart review, telephone con- tact, and direct measurement-were done in 118, 591, and 465 potential cases, respectively, among subcohort partici- pants (n=8,722), so that 247 cases were finally confirmed (Fig. 3). Thus, the total number of subjects was 988, because controls were selected by frequency matching with 1-to-4 ratio.
Baseline Information on potential confounders was obtained by self-administered questionnaires survey, which was done in 1992 (6-8). Covariates without known cut-off values, total energy expenditure, intakes of herb medicine, intakes of foods and nutrients, were categorized according to quartile.
After excluding the nonresponding data of exposure vari- ables as missing (10), odds ratios (OR) and their 95% confi- dence intervals (CI) were calculated to determine any statis- tically significant difference between cases and controls. For
Multivitamin NS
(tablets/day) 0 468 (48.00) 116 (47.35) 1.00
0<-<1 218 (22.36) 59 (24.08) 1.09 [0.76, 1.58]
1<= 289 (29.64) 70 (28.57) 0.98 [0.69, 1.38]
Vitamin A 0.038
(tablets/day) 0 930 (94.99) 225 (91.46) 1.00
0<-<1 29 ( 2.96) 12 ( 4.88) 1.71 [0.81, 3.55]
1<= 20 ( 2.04) 9 ( 3.66) 1.86 [0.77, 4.37]
Vitamin C 0.056
(tablets/day) 0 881 (90.27) 209 (84.96) 1.00
0<-<1 51 ( 5.23) 23 ( 9.35) 1.90 [1.10, 3.27]
1<= 44 ( 4.51) 14 ( 5.69) 1.34 [0.69, 2.58]
Vitamin E 0.073
(tablets/day) 0 926 (94.30) 226 (91.87) 1.00
0<-<1 29 ( 2.95) 7 ( 2.85) 0.99 [0.39, 2.40]
1<= 27 ( 2.75) 13 ( 5.28) 1.97 [0.95, 4.05]
Green tea NS
(times/week) 0 764 (78.84) 190 (77.87) 1.00
0<-<7 137 (14.14) 43 (17.62) 1.26 [0.85, 1.87]
7<= 68 ( 7.02) 11 ( 4.51) 0.65 [0.32, 1.30]
Ginseng 0.089
(times/week) 0 774 (79.38) 206 (84.43) 1.00
0<-<7 157 (16.10) 30 (12.30) 0.72 [0.46, 1.11]
7<= 44 ( 4.51) 8 ( 3.28) 0.68 [0.29, 1.54]
Coffee NS
(times/week) 0 223 (22.71) 56 (22.67) 1.00
0<-<7 192 (19.55) 40 (16.19) 0.83 [0.52, 1.33]
7<= 567 (57.74) 151 (61.13) 1.06 [0.74, 1.52]
Coke NS
(times/week) 0 744 (76.46) 194 (79.84) 1.00
0<-<7 216 (22.20) 46 (18.93) 0.82 [0.56, 1.18]
7<= 13 ( 1.34) 3 ( 1.23) 0.89 [0.20, 3.36]
*Missing values were excluded.
Variables Control group
(column%)
Crude
OR 95% CI
Case group (column%)
p-value ( 2for trend) Table 4. Comparisons of intakes of drugs and tastes foods between incident cases (n=247) and controls (n=988) among Seoul Cohort Study, 1992*
the dose-response relationship, Mantel-Haenszel’s trend anal- ysis was done. Multivariate logistic analysis was done for the evaluating of the risk factors of hypertension with adjusting confounding effects.
RESULTS
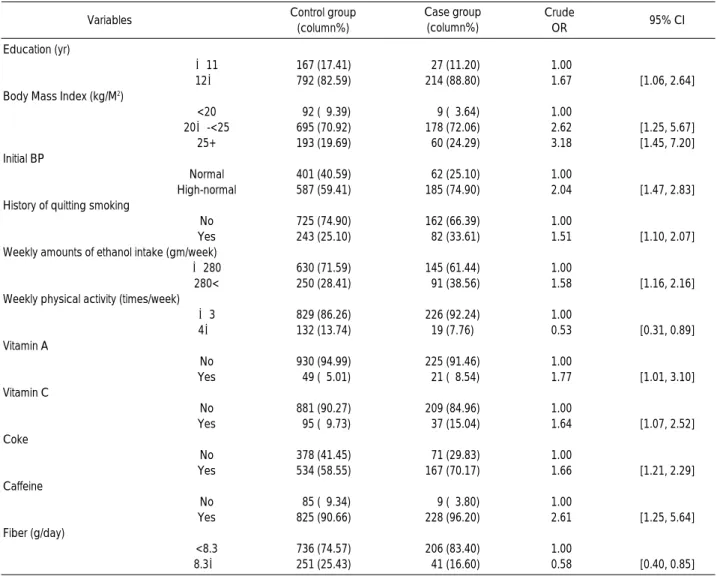
There was no difference in age distribution between two groups due to age matching. There was no statistically sig- nificant difference in marriage status, occupation, and socio- economic index, except education level (Table 1). When the
education level was reclassified as below and above 12 yr, a statistically significant difference was revealed (OR 1.67; 95%
CI 1.06, 2.64) (Table 7). Both the HNBP according to the initial measurement and higher BMI showed a statistically significant difference, especially, BMI showed a significant trend. Family history of hypertension was not different bet- ween two groups.
As for the smoking habit, the group with a history of quit- ting smoking had a higher risk than no smoking group (Table 2). However, there was no dose-response relationship in total cigarette index. The group with weekly ethanol intake of 281-560 g showed a statistically significant difference,
Beef (grilled, broiled) NS
(g/day) < 3.15 348 (35.26) 97 (39.27) 1.00
3.15<=-<4.78 29 ( 2.94) 6 ( 2.43) 0.74 [0.27, 1.94]
4.78<=-<9.44 320 (32.42) 77 (31.17) 0.86 [0.61, 1.22]
9.44 + 290 (29.38) 67 (27.13) 0.83 [0.58, 1.19]
Beef (fried, boiled, steamed) NS
< 2.41 232 (23.51) 62 (25.10) 1.00
2.41<=-<4.21 262 (26.55) 75 (30.36) 1.07 [0.72, 1.59]
4.21<=-<8.83 243 (24.62) 58 (23.48) 0.89 [0.59, 1.36]
8.83+ 250 (25.33) 52 (21.05) 0.78 [0.51, 1.20]
Pork (grilled, broiled) NS
< 2.76 204 (20.67) 38 (15.38) 1.00
2.76<=-<6.86 251 (25.43) 66 (26.72) 1.41 [0.89, 2.24]
6.86<=-<11.83 273 (27.66) 83 (33.60) 1.63 [1.05, 2.55]
11.83+ 259 (26.24) 60 (24.29) 1.24 [0.78, 1.99]
Pork (fried, boiled) NS
< 0.70 251 (25.43) 50 (20.24) 1.00
0.70<=-<1.49 249 (25.23) 62 (25.10) 1.25 [0.81, 1.93]
1.49<=-<3.90 227 (23.00) 75 (30.36) 1.66 [1.09, 2.52]
3.90+ 260 (26.34) 60 (24.29) 1.16 [0.75, 1.79]
Fishes (grilled) NS
<0.82 263 (26.65) 51 (20.65) 1.00
0.82<=-<1.98 252 (25.53) 76 (30.77) 1.56 [1.03, 2.35]
1.98<=-<3.90 230 (23.30) 51 (20.65) 1.14 [0.73, 1.79]
3.90+ 242 (24.52) 69 (27.94) 1.47 [0.97, 2.24]
Fishes (boiled, fried) NS
<0.15 241 (24.42) 61 (24.70) 1.00
0.15<=-<2.63 279 (28.27) 61 (24.70) 0.86 [0.57, 1.31]
2.63<=-<6.50 202 (20.47) 50 (20.24) 0.98 [0.63, 1.52]
6.50+ 265 (26.85) 75 (30.36) 1.12 [0.75, 1.66]
Fishes (salt-fermented) 0.04
< 5.13 264 (26.75) 54 (21.86) 1.00
5.13<=-<10.45 220 (22.29) 53 (21.46) 1.18 [0.76, 1.83]
10.45<=-<19.69 257 (26.04) 64 (25.91) 1.22 [0.80, 1.85]
19.69+ 246 (24.92) 76 (30.77) 1.51 [1.00, 2.27]
Shellfishes (not fried) NS
< 0.02 243 (24.62) 48 (19.43) 1.00
0.02<=-<0.05 233 (23.61) 74 (29.96) 1.61 [1.05, 2.46]
0.05<=-<0.13 280 (28.37) 64 (25.91) 1.16 [0.75, 1.78]
0.13+ 231 (23.40) 61 (24.70) 1.34 [0.86, 2.08]
Variables Control group
(column%)
Crude
OR 95% CI
Case group (column%)
p-value ( 2for trend) Table 5. Comparisons of intakes of food items between incident cases (n=247) and controls (n=988) among Seoul Cohort Study, 1992*
*Missing values were excluded.
compared with the group with no drinking history (OR 1.98;
95% CI 1.18, 3.34). When recategorizing the weekly amount of ethanol intake into two groups based on 280 g, the odds ratio changed into 1.58 (95% CI 1.16, 2.16) (Table 7).
As for the weekly physical activities, there was no statisti- cally significant difference (Table 3). However recategorizing the variable based on 4 times per week showed a statistically significant difference (Table 3).
None of the intakes of multivitamin, vitamin A, vitamin C, and vitamin E showed a statistically significant (Table 4).
However, a dose-response relationship was shown in intakes of vitamin A and C. When recategorizing the two variables, intakes of vitamin A and C, there was a statistically signifi- cant difference, compared with non-intake groups (Table 7).
There was no significant difference in variables of intakes of taste foods such as coffee, tea, green tea, coke, and ginseng.
When recategorizing the variables of coffee and coke, there was a statistically significant difference, compared with non-
intake groups (Table 7).
As for the food items, the third quarter group in intake of pork showed a statistically significant difference (Table 5). Also there was a statistical significance in the second quarter group in intake of grilled fishes, the fourth quarter group in intake of salt-fermented fishes, and the second quarter group in in- take of raw shellfishes (Table 5).
As for the intakes of nutrients, none of total energy intakes, protein, fat, fiber, sodium, potassium, phosphate showed a statistically difference (Table 6). However the fiber intake showed an opposite direction in OR between the fourth and the other groups, so that the recategorization into two groups showed a statistically significant difference (OR 0.58; 95%
CI 0.40, 0.85) (Table 7).
The recategorization of the 11 variables such as education year, history of quitting smoking, weekly amount of ethanol intake, weekly physical activity, intakes of vitamin A and C, intakes of coke and caffeine, daily intake of fiber, BMI and
Total energy intake (Kcal/day) NS
<2,392.6 260 (26.34) 61 (24.70) 1.00
2,392.6≤-<2,804.7 254 (25.73) 70 (28.34) 1.17 [0.79, 1.76]
2,804.7≤-<3,415.5 241 (24.42) 55 (22.27) 0.97 [0.64, 1.49]
3,415.5+ 232 (23.51) 61 (24.70) 1.12 [0.74, 1.70]
Protein (g/day) NS
<63.4 260 (26.34) 56 (22.67) 1.00
63.4≤-<82.6 251 (25.43) 74 (29.96) 1.37 [0.91, 2.06]
82.6≤-<108.6 243 (24.62) 59 (23.89) 1.13 [0.74, 1.72]
108.6+ 233 (23.61) 58 (23.48) 1.16 [0.75, 1.77]
Fat (g/day) NS
<23.2 252 (25.53) 69 (27.94) 1.00
23.2≤-<33.3 265 (26.85) 57 (23.08) 0.79 [0.52, 1.18]
33.3≤-<47.8 245 (24.82) 67 (27.13) 1.00 [0.67,1.49]
47.8+ 225 (22.80) 54 (21.86) 0.88 [0.58, 1.33]
Fiber (g/day) NS
<4.1 253 (25.63) 61 (24.70) 1.00
4.1≤-<5.8 237 (24.01) 69 (27.94) 1.21 [0.81, 1.81]
5.8≤-<8.3 246 (24.92) 76 (30.77) 1.28 [0.86, 1.91]
8.3 + 251 (25.43) 41 (16.60) 0.68 [0.43, 1.07]
Sodium (mg/day) NS
<3,212.9 269 (27.25) 61 (24.70) 1.00
3,212.9≤-<5,734.1 226 (22.90) 75 (30.36) 1.46 [0.98, 2.18]
5,734.1≤-<9,496.0 260 (26.34) 45 (18.22) 0.76 [0.49, 1.19]
9,496.0+ 232 (23.51) 66 (26.72) 1.25 [0.83, 1.89]
Potassium (mg/day) NS
<2030.3 267 (27.05) 59 (23.89) 1.00
2,030.3≤-<2,747.2 233 (23.61) 69 (27.94) 1.34 [0.89, 2.02]
2,747.2≤-<3,733.9 260 (26.34) 66 (26.72) 1.15 [0.76, 1.73]
3,733.9 + 227 (23.00) 53 (21.46) 1.06 [0.69, 1.63]
Phosphate (mg/day) NS
<950.1 265 (26.85) 58 (23.48) 1.00
950.1≤-<1,239.0 245 (24.82) 71 (28.74) 1.32 [0.88, 1.99]
1,239.0≤-<1,616.1 252 (25.53) 61 (24.70) 1.11 [0.73, 1.68]
1,616.1+ 225 (22.80) 57 (23.08) 1.16 [0.76, 1.77]
Variables Control group
(column%)
Crude
OR 95% CI
Case group (column%)
p-value ( 2for trend) Table 6. Comparisons of intakes of nutrients between incidence cases (n=247) and controls (n=988) among Seoul Cohort Study, 1992*
*Missing values were excluded.
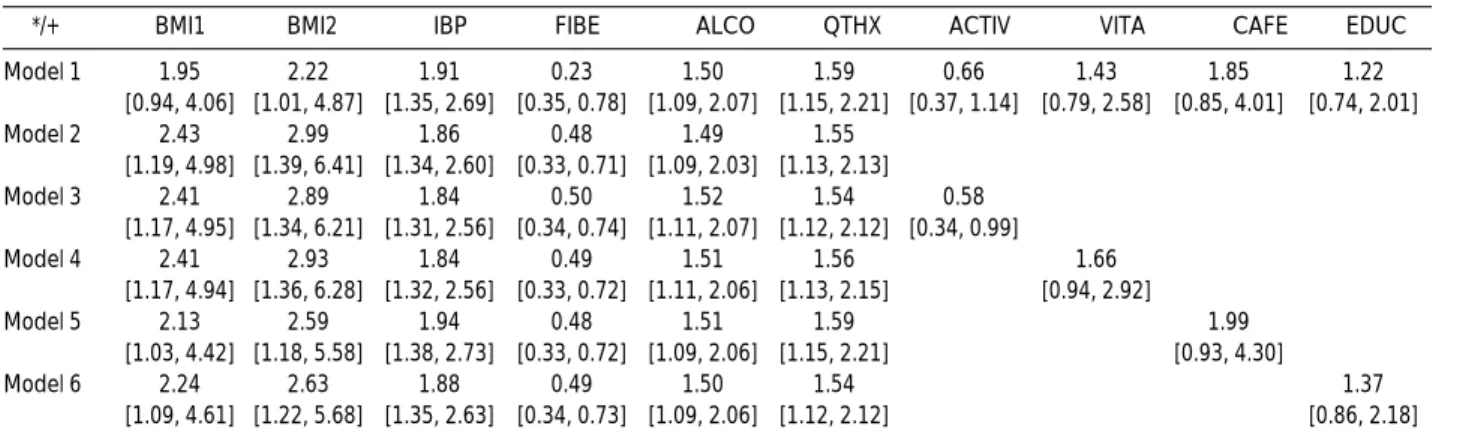
HNBP, showed statistically significant differences in univari- ate analysis (Table 7). After testing for intervariable indepen- dence among the 11 variables, 9 variables, except intakes of vitamin C and coke, were finally selected for multivariate anal- ysis. The forward regresssion methods revealed the most fitted models for six variables-HNBP group, BMI, daily amounts of dietary fiber intake, weekly amount of alcohol intake, history of quitting smoking, and weekly times of exercise (Table 8- model 3). The final model revealed HNBP, BMI, weekly amount of alcohol intake, and history of quitting smoking as risk factors, and daily amount of dietary fiber intake and weekly times of exercise as protective factors.
DISCUSSION
In accrodance with previous reports that HNBP was one of the risk factors of hypertension (1, 4, 11-12), this paper also showed that HNBP would be the risk factor after adjusting
for sociodemographic factors, BMI, family history, smoking and drinking, sleep and daily activity, intakes of drugs and taste foods, and dietary habits. Thus, physicians suggest some strategies for prevention of hypertension for Korean middle- aged men with HNBP.
The results of this study showed four risk factors such as obesity, excessive drinking, lack of exercise, and HNBP, in agreement with National High Blood Pressure Education Program Working Group, which suggested HNBP, obesity, family history of hypertension, excessive intakes of salt and drinking, lack of exercise, and African-American as risk fac- tors of hypertension (13). If a person had one of these risk fac- tors, certain measures for the primary prevention were recom- mended and proved to prevent an elevation of blood pressure (11, 14-16).
The excessive intake of salt did not show a statistical sig- nificance, in contrast with previous reports (2, 17). Some methodologic challenges might have existed in studies on the relationship between sodium intake and blood pressure.
Education (yr)
≤11 167 (17.41) 27 (11.20) 1.00
12≤ 792 (82.59) 214 (88.80) 1.67 [1.06, 2.64]
Body Mass Index (kg/M2)
<20 92 ( 9.39) 9 ( 3.64) 1.00
20≤-<25 695 (70.92) 178 (72.06) 2.62 [1.25, 5.67]
25+ 193 (19.69) 60 (24.29) 3.18 [1.45, 7.20]
Initial BP
Normal 401 (40.59) 62 (25.10) 1.00
High-normal 587 (59.41) 185 (74.90) 2.04 [1.47, 2.83]
History of quitting smoking
No 725 (74.90) 162 (66.39) 1.00
Yes 243 (25.10) 82 (33.61) 1.51 [1.10, 2.07]
Weekly amounts of ethanol intake (gm/week)
≤280 630 (71.59) 145 (61.44) 1.00
280< 250 (28.41) 91 (38.56) 1.58 [1.16, 2.16]
Weekly physical activity (times/week)
≤3 829 (86.26) 226 (92.24) 1.00
4≤ 132 (13.74) 19 (7.76) 0.53 [0.31, 0.89]
Vitamin A
No 930 (94.99) 225 (91.46) 1.00
Yes 49 ( 5.01) 21 ( 8.54) 1.77 [1.01, 3.10]
Vitamin C
No 881 (90.27) 209 (84.96) 1.00
Yes 95 ( 9.73) 37 (15.04) 1.64 [1.07, 2.52]
Coke
No 378 (41.45) 71 (29.83) 1.00
Yes 534 (58.55) 167 (70.17) 1.66 [1.21, 2.29]
Caffeine
No 85 ( 9.34) 9 ( 3.80) 1.00
Yes 825 (90.66) 228 (96.20) 2.61 [1.25, 5.64]
Fiber (g/day)
<8.3 736 (74.57) 206 (83.40) 1.00
8.3≤ 251 (25.43) 41 (16.60) 0.58 [0.40, 0.85]
*Missing values were excluded.
Variables Control group
(column%)
Crude
OR 95% CI
Case group (column%)
Table 7. Recategorization of statistically significant risk factors among Seoul Cohort participants, 1992*
These include measurement difficulties due to variation in day-to-day consumption of sodium (18) as well as a limitation of the measurement itself (19, 20), the inter-relation between dietary habit and individual characteristics (21), the interac- tion of nutrition absorption (22), and the correlation to other risk factors of hypertension (23). However, the highest intake of salted-fish showed a statistical significance (OR=1.51; 95%
CI 1.00-2.27) and a trend so that the limitation of salt intake should be recommended without further evidences.
Smoking was not shown as a risk factor of hypertension in this study. It would be due to the prohibit smoking before measurement of blood pressure (24). However, smoking is known as a risk factor of cardiovascular disease (25), so that a person with some risk factors of hypertension should be strongly recommended to stop smoking (26).
The history of quitting smoking was shown as a risk factor of hypertension in this study as well as other reports (27, 28). This result could be explained by the relaxing effect of beta-endorphin (29). A person who has quitted smoking cannot control the stress level effectively, so that the risk of hypertension increases (30, 31). Moreover, there was an increasing trend in odds ratio until 14 yr after quitting smok- ing ( 2trend=7.56; p-value<0.01). These results would suggest that it should be necessary to follow up for at least 15 yr after quitting smoking.
One should interpret the results carefully according to the selection of cases and controls. Review of medical charts, tele- phone contacts, and direct measurements of blood pressure levels were used to select the cases. But the controls were chosen by age matching among those who had not received any medical service during the follow-up periods. Controls might be incomplete without a survey for individual identi- fication and this may bias the relative risk towards the nulls and weaken the statistical power. Hence we need an additional study for some variables, which did not show a statistical significance.
In conclusion, a middle-aged Korean man with a HNBP should take some measures for the prevention of hypertention (OR=1.84; 95% CI 1.31-2.56). Physician should suggest some strategies for the prevention of hypertention to a visitor having overweight, over-drinking, low physical activity, or history of quitting smoking. The primary strategies against hypertension in Korean men may be weight control, control of ethanol intake (below 70 gm per week), adequate exercise (above 4 times per week), and adequate intake of dietary fiber.
REFERENCES
1. Veterans Administration Cooperative Study Group on Antihyperten- sive Agents. Effects of treatment on morbidity in hypertension. II.
Results in patients with diastolic blood pressure averaging 90 through 114 mmHg. JAMA 1970; 213: 1143-52.
2. Stamler J, Rose G, Elliott P, Dyer A, Marmot M, Kesteloot H, Stamler R. Findings of the international cooperative INTERSALT study. Hyper- tension 1991; 17(Suppl I): I9-I15.
3. The Joint National Committee on Detection, Evaluation, and Treatment of High Blood Pressure (JNC V). The fifth report of the Joint National Committee on Prevention, Detection, Evaluation, and Treatment of High Blood Pressure. Arch Intern Med 1993; 153: 154-83.
4. Giumetti D, Liu K, Stamler R, Schoenberger JA, Shekelle RB, Stamler J. Need to prevent and control high normal and high blood pressure, particularly so-called “mild” hypertension: epidemiological and clin- ical data. Prev Med 1985; 14: 396-412.
5. Kim JS. Epidemiology II: chronic disease and injury. Seoul: Shing- wangsa. 1994: 125-38.
6. Ahn YO, Park BJ, Lee JK. A cohort construction for prevention of cancer in Korea. Report by Department of Preventive Medicine, Seoul National University College of Medicine. 1994.
7. Kim DS, Koo HW, Kim DH, Bae JM, Shin MH, Lee MS, Lee CM, Ahn YO. A cohort study of physical activity and all cause mortality in middle-aged men in Seoul. Korean J Prev Med 1998; 31: 604-15.
Model 1 1.95 2.22 1.91 0.23 1.50 1.59 0.66 1.43 1.85 1.22
[0.94, 4.06] [1.01, 4.87] [1.35, 2.69] [0.35, 0.78] [1.09, 2.07] [1.15, 2.21] [0.37, 1.14] [0.79, 2.58] [0.85, 4.01] [0.74, 2.01]
Model 2 2.43 2.99 1.86 0.48 1.49 1.55
[1.19, 4.98] [1.39, 6.41] [1.34, 2.60] [0.33, 0.71] [1.09, 2.03] [1.13, 2.13]
Model 3 2.41 2.89 1.84 0.50 1.52 1.54 0.58
[1.17, 4.95] [1.34, 6.21] [1.31, 2.56] [0.34, 0.74] [1.11, 2.07] [1.12, 2.12] [0.34, 0.99]
Model 4 2.41 2.93 1.84 0.49 1.51 1.56 1.66
[1.17, 4.94] [1.36, 6.28] [1.32, 2.56] [0.33, 0.72] [1.11, 2.06] [1.13, 2.15] [0.94, 2.92]
Model 5 2.13 2.59 1.94 0.48 1.51 1.59 1.99
[1.03, 4.42] [1.18, 5.58] [1.38, 2.73] [0.33, 0.72] [1.09, 2.06] [1.15, 2.21] [0.93, 4.30]
Model 6 2.24 2.63 1.88 0.49 1.50 1.54 1.37
[1.09, 4.61] [1.22, 5.68] [1.35, 2.63] [0.34, 0.73] [1.09, 2.06] [1.12, 2.12] [0.86, 2.18]
*BMI1: 20≤-<25; BMI2: 25+; IBP: initial blood pressure; FIBE: intake of dietary fiber; ALCO: amount of weekly ethanol intake; QTHX: history of quit- ting smoking; ACTIV: weekly physical activities; VITA: intake of vitamin A; CAFE: intake of caffeine; EDUC: years of education.
+Odds ratio and 95% confidence interval.
*/+ BMI1 BMI2 IBP FIBE ALCO QTHX ACTIV VITA CAFE EDUC
Table 8.The Model Selection by the logistic regression and the adjusted OR in incidence of hypertension among Seoul Cohort participants, 1992
8. Bae JM, Kim DS, Ahn YO. Measurement errors on normotensive subjects in screening test. Korean J Epidemiol 1999; 21: 1-7.
9. The Joint National Committee on Detection, Evaluation, and Treatment of High Blood Pressure (JNC VI). The sixth report of the Joint National Committee on Prevention, Detection, Evaluation, and Treatment of High Blood Pressure. Arch Intern Med 1997; 157: 2413-40.
10. Rothman KJ, Greenland S. Modern Epidemiology. 2nd ed. Philadel- phia: Lipincott-Raven, 1998: 253-79.
11. Hypertension Prevention Trial Research Group (HPT). The Hyperten- sion Prevention Trial: three-year effects of dietary changes on blood pressure. Arch Intern Med 1990; 150: 153-62.
12. Leitschuh M, Cuppies LA, Kannel W, Gagnon D, Chobanian A. High- normal blood pressure progression to hypertension in the Framingham Heart Study. Hypertension 1991; 17: 22-7.
13. National High Blood Pressure Education Program Working Group.
National high blood pressure education program working group report on primary prevention of hypertension. Arch Intern Med 1993;
153: 186-208.
14. Stamler R, Stamler J, Gosch FC, Civinelli J, Fishman J, McKeever P, McDonald A. Primary prevention of hypertension by nutritional-hygienic means: final report of a randomized, controlled trial. JAMA 1989;
262: 1801-7.
15. Trials of Hypertension Prevention Collaborative Research Group (TOHP). The effects of non-pharmacologic interventions of blood pressure of persons with high normal levels: results of the Trials of Hypertension Prevention, Phase I. JAMA 1992; 267: 1213-20.
16. Trials of Hypertension Prevention Collaborative Research Group (TOHP). Effects of weight loss and sodium reduction intervention on blood pressure and hypertension incidence in overweight people with high-normal blood pressure: the Trials of Hypertension Prevention, phase II. Arch Intern Med 1997; 157: 657-67.
17. Intersalt Cooperative Research Group. Intersalt: an international study of electrolyte excretion and blood pressure. Results for 24 hr urinary sodium and potassium excretion. Br Med J 1988; 297; 319- 28.
18. Liu K, Cooper R, McKeever J, Byington R, Soltero I, Stamler R, Gosch FC, Stamler J. Assessment of the association between habitual salt
intake and high blood pressure: methodological problems. Am J Epi- demiol 1979; 110: 219-26.
19. Willett W. Nutritional epidemiology: issues and challenges. Int J Epi- demiol 1987; 16 (Suppl): 312-7.
20. Willett W. Nutritional epidemiology. Oxford University Press. New York. 1990; 69-91: 245-71.
21. Hulshof KF, Wedel M, Lowik MR, Kok FJ, Kistemaker C, Hermus RJ, ten Hoor F. Clustering of dietary variables and other lifestyle fac- tors (Dutch Nutritional Surveillance System). J Epidemiol Community Health 1992; 46: 417-24.
22. Joffres MR, Reed DM, Yano K. Relationship of magnesium intake and other dietary factors to blood pressure: the Honolulu heart study.
Am J Clin Nutr 1987; 45: 469-75.
23. Beilin LJ. Diet and hypertension-critical concepts and controversies.
J Hypertens 1987; 5 (Suppl 5): S447-S57.
24. Hirsch JM, Hedner J, Wernstedt L, Lundberg J, Hedner T. Hemody- namic effects of the use of oral snuff. Clin Pharmacol Ther 1992; 52:
394-401.
25. U.S. Department of Health and Human Services. The health benefits of smoking cessation. DHHS Publication, Washington DC. 1990.
26. Lee EW, D’Alonzo GE. Cigarette smoking, nicotine addiction, and its pharmacologic treatment. Arch Intern Med 1993; 153: 34-48.
27. Gyntelberg F, Meyer J. Relationship between blood pressure and physical fitness, smoking and alcohol consumption in Copenhagen males aged 40-59. Acta Med Scand 1974; 195: 375-80.
28. Jong KO, Chun JH, Shon HS. Risk factors of hypertension and the effect of these factors on blood pressure. Korean J Epidemiol 1995;
17: 201-13.
29. Benowitz NL. Cigarette smoking and nicotine addiction. Med Clin North Am 1992; 76: 415.
30. Duijkers TJ, Drijver M, Kromhout D, James SA. “John Henryism”
and blood pressure in a Dutch population. Psychosom Med 1988; 50:
353-9.
31. Henry JP, Liu YY, Nadra WE, Qian CG, Mormede P, Lemaire V, Ely D, Hendley ED. Psychosocial stress can induce chronic hypertension in normotensive strains of rats. Hypertension 1993; 21: 714-23.