Application of the Electrochemical Noise Method with Three Electrodes to Monitor Corrosion and
Environmental Cracking in Chemical Plants
Takao Ohtsu1,†, Masazumi Miyazawa1, and Ryuichiro Ebara2
1Mizushima Plant, Mitsubishi Chemical Corporation, Ushiodori, Kurashiki-city, Okayama, 712-8054, Japan
2Graduate School, Hiroshima Institute of Technology, 2-1-1, Miyake, Saeki-ku, Hiroshima, 731-5193, Japan
Recently an electrochemical noise method (ENM) with three electrodes has gained attention as a corrosion monitoring system in chemical plants. So far a few studies have been carried out for localized corrosion and environmental cracking of chemical plant materials. In this paper the ENM system is briefly summarized.
Then an application of ENM to general corrosion for chemical plant materials is described. The emphasis is focused upon the analysis of stress on the corrosion cracking process of austenitic stainless steel in 30%
MgCl2 aqueous solution and the corrosion fatigue crack initiation process of 12 Cr stainless steel in 3%
NaCl aqueous solution by ENM. Finally future problems for ENM to monitor regarding corrosion and environmental cracking in chemical plants are discussed.
Keywords : electrochemical noise method, general corrosion, stress corrosion cracking, corrosion fatigue, corrosion monitoring
†Corresponding author: [email protected]
1. Introduction
Incorrect control of facilities frequently causes corrosion damages in chemical plants. To overcome this problem, it is important to develop a highly sensitive corrosion- measuring device and to reduce corrosion-induced damage by applying it to actual plants. Among different corrosion measurement methods we have focused our attention on the electrochemical noise method (ENM) which satisfies our requirements. In order to establish ENM measurement technology, we have applied ENM measurement method to monitor general corrosion, stress corrosion cracking and corrosion fatigue. Then we have successfully applied ENM method to corrosion monitoring in actual chemical plants.
2. Application of enm to general corrosion
2.1 Experimental procedure
Aqueous solutions with HCl concentrations of 1000, 500, 200 and 100 mass ppm were prepared by adding HCl to 100 cm3 of distilled water. The material used was JIS G4051S 25C carbon steel with chemical compositions of C: 0.24 mass%, Si: 0.19 mass%, Mn: 0.47 mass%, S:
0.017 mass%, and P: 0.015 mass%. For the AC electro- chemical impedance spectroscopy (EIS) measurements, we used the bipolar technique and employed an electro- chemical measurement apparatus (Model 1280B, Solar- tron). The potential amplitude of the sine-wave signal ap- plied between the two electrodes was 10 mV. Following reports by Tsuru, et al “From the reports 1),2)”, the im- pedance was measured at two frequencies of 10000 Hz and 0.01 Hz, to obtain the polarization resistance (Rp) and solution resistance (Rs). Fig. 1 shows an outline of the electrochemical noise measurement system. WE1 and WE2
are working electrodes and RE is a reference electrode.
Every second, the current and the electrode potentials, from which the high-frequency component had been re- moved by a low-pass filter with a cutoff frequency of 1 Hz, were measured to obtain the noise component in the current and the voltage. To obtain the polarization resist- ance from the current and the potentials, we employed the method developed by Eden et al “From the report 3)”.
2.2 Results and discussion
With respect to the AC impedance method, we obtained the solution resistance, Rs, from the higher frequencies as well as the resistance between the electrodes, Rs+ 2Rp,i,
from the lower frequencies. Rp,i and Rs+ Rp,i were then obtained from these resistance values. Fig. 2(a) shows the
Fig. 1. Electrochemical noise measurement system 1) Data analysis system, 2) Measurement equipment 3) Test cell A: Zero resistance ammeter V: Electrometer
(a)
(b)
Fig. 2. Change in the polarization resistance and the solution resistance with HCl concentration “From the report 4)”
(a) The results obtained by the electrochemical impedance spectroscopy (EIS)
(b) The results obtained by the electrochemical noise(EN) method
maximum, minimum and average values of Rp,i and Rs
+ Rp,i in each of the HCl solutions with different con- centration. Using the ENM, we obtained the standard devi- ation (σI and σE) from the noise components in the current
and the potentials and then obtained the polarization resist- ance (Rp,n) from the ENM. In each of the HCl solutions, maximum, minimum and average values of Rp,n were ob- tained for a continuous time period of 60 min. Fig. 2(b) shows these results.
3. Analysis of stress corrosion cracking by enm
3.1 Experimental procedure
The used material was commercial austenitic stainless steel, SUS304. The plate specimens with 2 mm thick, 4 mm wide in parallel section and 140 mm long were pre- pared for stress corrosion cracking test. The specimens were polished with No.600 emery paper and sensitized by air-cooling after annealing at 923 K for 24 hours. The specimen surface except central area of 1x2 mm was coat- ed with silicone resin. MgCl2 was dissolved in pure water to a concentration of 30 wt%. The solution temperature was kept at 353±1 K. For the stress corrosion cracking test a SSRT apparatus (MINI-1000B-CY, Toshin Kogyo) was used. The measuring system for the electrochemical noise method (ENM) is basically same as outlined in Fig.
1. SSRT specimen was used for WE1. With the three elec- trodes immersed in the solution, we measured the current, which was defined to be the difference between the sum of the anode and cathode currents, with a non-resistance ammeter, in addition to changes in the potential measured with an electrometer, between the plate specimen, WE1
and the counter electrode, WE2. Although the counter elec- trode, which we used as the reference electrode, was made of the same material as the sample piece electrode, SUS304, we applied no sensitization to the reference. The targeted area of the surface was observed with an optical microscope (Keyence’s VHX-100).
3.2 Results and discussion
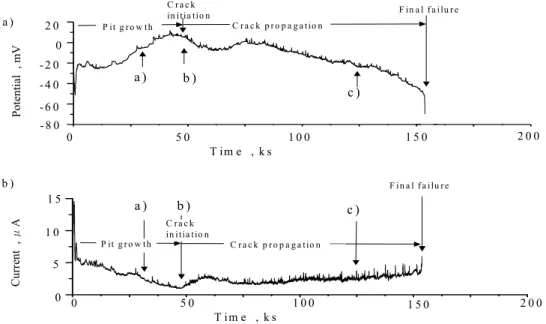
The measurement time for ENM was 36, 54, 72, and 200 ks at an applied stress of 196 MPa. In order to study the effect of stress on stress corrosion cracking, stress of 98 and 294 MPa were also applied. As shown in Fig. 3
“From the report 5)”, potential initially increases until it reaches a vicinity of 0 mV, and then decreases from that point, then increases once, and decreases again until the fracture of the specimen. Fluctuation of the potential is larger during the potential decrease than during the poten- tial increase, and the interval of the fluctuation is also narrower. On the other hand, current initially decreases, and then increases with the same timing as decrease of potential, then decreases once, and gradually increases again until the fracture of the specimen. Fluctuation of
0 5 0 1 0 0 1 5 0 2 0 0 T im e , k s
0 5 0 1 0 0 2 0 0
T im e , k s
Current , μA
0 5 1 0 1 5
Potential , mV 0
2 0
- 2 0 - 4 0 - 6 0 - 8 0
( b ) ( a )
a ) b )
c )
a ) b ) c )
C r a c k
in itia tio n F in a l f a i lu r e
F in a l f a i lu r e 1 5 0 P it g r o w th C r a c k p r o p a g a t io n
P it g r o w t h C r a c k in itia tio n
C r a c k p r o p a g a tio n
Fig. 3. Electrochemical noise, 196 MPa “From the report 5)”
(a) Potential of test piece and reference electrode (b) Current of a couple of working electrodes
current gradually becomes larger compared with the start- ing time, and the interval of fluctuation also becomes narrower. Potential increases during propagation period of a corrosion pit. In the location of b) of Fig. 3, phenomenon of a potential decrease during an increase of the current is observed. This is assumed to be due to emergence of a fresh surface after a crack initiation in a corrosion pit.
As shown in the location of c) of Fig. 3, when crack prop- agation rate becomes faster, potential and current sig- nificantly fluctuate at the time of crack initiation. With the elapse of time, the potential and current return to the values before the fluctuation. These repeated fluctuations continue until the specimen eventually breaks. Phenome- non in the location of c) of Fig. 3 may be electrochemically explained in the following way. An electric double layer on the electrode surface is destroyed by a crack; thus, con- siderable electrons are released, and some of those elec- trons move to the counter electrode, resulting in a rapid increase in potential of the specimen electrode. On the fresh surface, the number of electrons increases by the anodic reaction. However, potential increases because the number of electrons moving to the counter electrode is much larger than generated electrons. In addition, the movement of the released electrons to the counter elec- trode is considered to contribute to an increase in the meas- ured current. When a film starts to be formed on the fresh surface, the potential and current gradually returns to the original state. The magnitude of change in the potential and current and the time necessary to return to the original
state are considered to be related to the size of the crack.
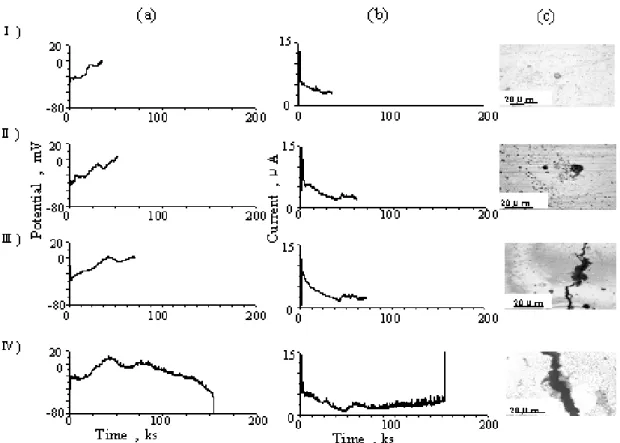
Fig. 4 shows the time dependence of ENM and results of an optical microscope observation at each period “From the report 5)”. A corrosion pit initiated on the surface of the specimen, a crack initiated from corrosion pit, and then crack propagated, leading eventually to a fracture. This is well-known phenomenon that is unique to SCC “From the report 6)”. Potential of the specimen increases from the start of the test and exceeds 0 mV when a corrosion pit is formed. During the growth period of corrosion pit, the potential further increases. In Fig. 4II), numerous small corrosion pits are observed in the vicinity of the grown corrosion pit. While the corrosion pit that acts as the origin of a crack grows, other corrosion pits probably stop their growing. With the increase in the potential, non-growing corrosion pits and the vicinity around them become cath- odes for the crack-initiating corrosion pit. Part of the cur- rent necessary for growth of the crack-initiating corrosion pit is supplied from the surface of the specimen. Thus, current from the current reference electrode, which is the counter electrode, decreases. This is in good agreement with the behavior of the current at the initial stage (50 ks) shown in Fig. 3. Growth of corrosion pit is also nearly consistent with the behavior of the potential between the sensitized specimen and the reference electrode.
On the other hand, in Fig. 4III), current increases and potential decreases. Thus, a crack is considered to be ini- tiated a short time before the stage of Fig. 4III). The crack is considered to be propagated by the stress since fresh
Fig. 4. Electrochemical noise and surface observation result, 196 MPa “From the report 5)”
(a) Potential of test piece and reference electrode (b) Current of a couple of working electrodes (c) Surface appearance of working electrode
Time I) 6 ks, II) 54 ks, III) 72 ks, IV) 162 ks(failure)
surface increases with the propagation of the crack. The same results were observed similar at an applied stress of 98 MPa “From the report 5)”. From these experiments it can be concluded that crack initiation time can be pre- dicted from the relation between stress and ENM data.
4. Application of enm to corrosion fatigue
4.1 Experimental procedure
In order to observe the process of initiation and growth of corrosion pits, continuous electrochemical noise meas- urement with three electrodes was conducted for 12%
chromium stainless steel during axial corrosion fatigue tests. The plate specimen with 3.5 mm thick, 4 mm wide in parallel section and 160 mm long were prepared. The 2 mm square area of the center part of plate specimens exposed to 3% NaCl aqueous solution were target for elec- trochemical noise measurement. Corrosion pits were ob- served by optical microscopy (Keyence, VHX100) and scanning electron microscopy.
4.2 Results and discussion
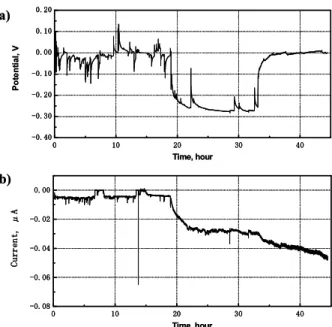
ENM was measured at applied stress of 166, 200 and 300 MPa. Fig. 5 shows electrochemical noise measured at a stress amplitude of 200 MPa “From the report 7)”.
The potential decreased tremendously to -0.27 V after 19 hours later and recovered 0V after 33 hours. Current also decreased after 19 hours and its fluctuation was larger after 33 hours. Fig. 6 shows relation between initiation time of potential decrease and stress amplitude. The higher the stress amplitude is the lower the initiation time of potential decrease. At the relatively lower stress amplitude of 166 MPa and static corrosion level the potential decrease was not observed. It can be concluded that it takes longer time for initiation of potential decrease at very low stress ampli- tude with longer corrosion fatigue life. After corrosion fa- tigue tests the target area exposed to 3 % NaCl aqueous solution for electrochemical noise measurement was ob- served by optical microscope and scanning electron microscope. Corrosion pits were observed on the surface of the target area “From the report 7)”.
Fig. 7 shows corrosion pit observed before and after cor-
0 10 20 30 40 -0.08
-0.06 -0.04 -0.02 0.00
Current,μA
Time, hour
0 10 20 30 40
-0.40 -0.30 -0.20 -0.10 0.00 0.10 0.20
Potential, V
Time, hour
a)
b)
0 10 20 30 40
-0.08 -0.06 -0.04 -0.02 0.00
Current,μA
Time, hour
0 10 20 30 40
-0.40 -0.30 -0.20 -0.10 0.00 0.10 0.20
Potential, V
Time, hour
a)
b)
Fig. 5. Electrochemical noise measured at 2.9x10⁶cycles, σa = 200MPa “From the report 7)” Electrochemical noise measured a) Potential of test piece and reference electrode
b) Current of a couple of working electrodes
0 5 10 15 14
180 200 220 240 260 280 300 320
Stress amplitude, MPa Initiation time of potential decrease, hour
0 5 10 15 14
180 200 220 240 260 280 300 320
Stress amplitude, MPa Initiation time of potential decrease, hour
Fig. 6. Relation between stress amplitude and initiation time of potential decrease “From the report 7)”
rosion fatigue test “From the report 7)”. The numbers of corrosion pits initiated on the surface were controlled by repeated stress. The higher the stress amplitude the more corrosion pits initiated. At the higher stress amplitudes the surface protective film is supposed to break easily. The influence of exposure time on the number of corrosion pits initiated was smaller as compared with that of stress amplitude. Electrochemical noise resistance and electro- chemical noise current can be expressed as a function of stress amplitude (Fig. 8) “From the report 7)”. The higher the stress amplitude, the lower the electrochemical noise resistance and the higher the electrochemical noise current
(a)
(b)
Fig. 7. Corrosion pit observed before corrosion fatigue test and after 2.9x10⁶cycles, σa = 200MPa “From the report 7)”
a) Before corrosion fatigue test b) After 2.9x10⁶cycles
10 100 1000 10000 100000
0 50 100 150 200 250 300 350
0 0.1 0.2 0.3 0.4 0.5 0.6
RnElectrochemical noise resistance In Electrochemical noise current
10 102 103 104 105
Stress amplitude, MPa
Electrochemical noise resistance, Ω Electrochemical noise current, μA
10 100 1000 10000 100000
0 50 100 150 200 250 300 350
0 0.1 0.2 0.3 0.4 0.5 0.6
RnElectrochemical noise resistance In Electrochemical noise current
10 102 103 104 105
Stress amplitude, MPa
Electrochemical noise resistance, Ω Electrochemical noise current, μA
Fig. 8. Electrochemical noise resistance and electrochemical noise current as a function of stress amplitude “From the report 7)”
are. The same results were observed at applied of stress amplitude of 166 MPa and 300 MPa. The most of the corrosion fatigue life of 12% chromium stainless steel is spent by fatigue crack initiation. Therefore ENM can be
Fig. 9. Corrosion rate and gas temperature in fuel gas duct
available to observe corrosion fatigue and the generation process “From the report 8)”.
5. Application of enm in actual plants
To study how the electrochemical noise method can work in corrosion measurements, we used the improved measurement instruments and applied them to five chem- ical plants. For instance, Fig. 9 shows the results of dew point corrosion on ducts in a boiler plant. The following results were gained:
1) Most of the white noise was successfully removed from the measurement data by adding a new circuit to the existing measurement circuit.
2) The measurement distance could be extended by em- ploying a shield-structured cable to connect the sensor and the measurement instrument.
3) At a low temperature, fluorine containing resins are suitable for the sensor insulator. These points prove that the electrochemical method can be effective for application in corrosion measurements.
6. Summary
It can be concluded that the electrochemical noise meth- od (ENM) with three electrodes is effective in the meas- urement of general corrosion, stress corrosion cracking and corrosion fatigue.The ENM is also available method to monitor corrosion in actual chemical plants.
References
1. S. Haruyama, T. Tsuru, and H. Anan, Boshoku-Gijutsu, 27, 449 (1978).
2. T. Tsuru and S. Haruyama, Boshoku-Gijutsu, 27, 573 (1978).
3. D. A. Eden, Uhlig Corrosion Handbook, 2nd.ed, R. W.
Revie, p.1227, John Wiley&Sons, Inc, New York (2000).
4. M. Miyazawa and H. Inoue, Zairyo-to-Kankyo, 53 (2004).
5. M. Miyazawa, R. Ebara, and T. Ohtsu, Strength, Fracture and Complexity, 4, 129 (2006).
6. M. Kowaka and T. Kudou, Tetsu-to-Hagane, 62, 390 (1976).
7. S. Kim, M. Miyazawa, R. Ebara, and T.Ohtsu, Journal of the Japanese Society for Strength and Fracture of Materials, 40, 35 (2006).
8. R. Ebara, accepted for publication, Materials Science &
Engineering A, 2007.