한방비만학회지 제13권 제2호, 2013 JKOMOR
Original Article
혈액검사 결과를 바탕으로 살펴본 노인 비만 특성 고찰
신우석ㆍ고찬희
1
ㆍ최정은2
ㆍ이상욱3
ㆍ박원형ㆍ차윤엽상지대학교 한의과대학 한방재활의학교실, 1사상체질의학교실, 2중화한방병원 한방내과, 3동수원한방병원 한방재활의학과
The Study on the Characteristics of Obese Elderly Based on Blood Test
Woosuk Shin, Chan Hee Kho
1, Jeong Eun Choi
2, Sang Wook Lee
3, Won Hyung Park, Yun Yeop Cha
Department of Rehabilitation Medicine of Korean Medicine, College of Korean Medicine, Sangji University,
1
Department of Sasang Constitutional Medicine of Korean Medicine, College of Korean Medicine, Sangji University,
2
Department of Internal Medicine of Korean Medicine, Joonghwa Oriental Hospital,
3
Department of Rehabilitation Medicine of Korean Medicine, Dongsuwon Oriental Hospital
Received: November 11, 2013 Revised: November 29, 2013 Accepted: December 4, 2013
Objectives: The purpose of this study was to investigate the characteristics in elderly population with obesity by analyzing their blood test.
Methods: Included 130 subjects of aged 60 or older went through body composition test, and blood test. We divided them into obesity group and normal group based on body mass index (BMI) results, and then the blood test results were compared between the groups.
Results: Forty out of 130 subjects had BMI of 25 or more. Two groups showed significant difference in bilirubin total, alanine aminotransferase (ALT), cholesterol total, triglyceride, high density lipoprotein (HDL), red blood cell (RBC), hematocrite, mean corpuscular hemoglobin concentration, and platelet. All but HDL levels showed significantly higher results in obesity group than normal group. When compared with BMI, blood urea nitrogen, creatinine, ALT, cholesterol total, triglyceride, white blood cell (WBC), and RBC had significant positive correlations. Among those, cholesterol total, triglyceride, WBC, and RBC showed significant difference between two groups, with correlation to BMI. Especially, the average of triglyceride was higher than normal limit in obesity group, whereas it was lower than normal limit in normal group.
Conclusions: Triglyceride, cholesterol total, WBC, and RBC are highly related to obese elderly in this study. Old people with obesity need to be careful of cardiovascular and metabolic disease that can be caused by these factors.
Key Words: Obesity, Aged, Body mass index, Blood test
Correspondence to: Yun Yeop Cha
Oriental Medicine Hospital of Sangji University, 80 Sangjidae-gil, Wonju 220-717, Korea
Tel: +82-33-741-9260 Fax: +82-33-732-2124 E-mail: [email protected]
Copyright © 2013 by The Society of Korean Medicine for Obesity Research서 론
국내의 비만유병률은 2011년 기준으로 약 30.5%라고 알 려져 있다
1). 2011년 국내 기준 나이대별 비만 유병률은 19~29세는 21.7%, 30~39세는 31.5%, 40~49세는 35.4%, 50~59세는 35.7%, 60~69세는 38.8%, 70세 이상은 29.7%
를 나타낸다
2). 이는 나이대가 증가할수록 비만의 유병률도 증가하고 있는 경향을 보여주고 있는 것으로, 고연령층에서 비만의 위험이 상대적으로 높다는 것을 알 수 있다.
장래인구추계에 따르면 2012년 65세 이상 인구가 11.8%
에서 2020년 15.7%, 2030년 24.3%, 2040년 32.3%로 인구
의 고령화의 비율이 점차 늘어날 전망이다
3). 그러나 기대
수명의 연장에 비하여 건강 수명의 증가 속도는 그에 미치
지 못하고 있는 상황으로 향후 노인의 건강 및 질병 관리에
대한 사회적 비용이 증가할 것으로 예상된다. 그 중에서도
다양한 질병의 기저질환이 되는 생활 습관병에 대한 관리가
더욱 중요시되어야 할 것이며, 생활 습관병과 밀접한 관련
이 있는 비만에 대한 적절한 관심 및 관리 대책이 필요한 실
정이다.
비만은 사회적으로 중요한 문제로 떠오르고 있는 반면 노인 비만은 그 문제에 비하여 사회적인 관심이 덜한 편이 다. 이는 노인층이 비만에 대한 관심도가 젊은 층보다 낮을 뿐더러, 비만에 대한 위험성 및 치료의 필요성을 제대로 인 지하지 못하고 있기 때문이라고도 해석할 수 있다. 때문에 노인 비만에 대한 체계적인 연구를 통하여 노인 비만의 위 험성을 환기시킴과 동시에 치료의 당위성을 제기해야 할 필 요가 있다. 노인 비만에 대한 연구는 국내외로 진행 중인데, 저자는 특히 비만이 미치는 영향에 대해 혈액검사 지표를 통하여 노인 비만군의 특징을 살펴보고 이에 따른 결과를 분석해보려고 한다.
대상 및 방법
1. 연구대상
2013년 2월 26일부터 5월 19일까지 강원도 소재 모 한 방병원에서 실시한 한방종합검진 외래 환자 총 264명 중 만 60세 이상 노인군에 해당하는 130명 전원을 대상으로 선정 하였다. 노인군에 대한 정의는 World Health Organization 의 Definition of an older or elderly person
4)에 의거하여 만 60세를 기준점으로 결정하였다. 이들을 대상으로 체성 분검사 및 혈액검사결과를 시행하여 그 결과값을 분석하였 다. 생체 임피던스를 이용한 체성분 분석기를 통하여 키와 몸무게를 바탕으로 body mass index (BMI) 지수를 측정하 였으며, 혈액검사를 통하여 blood urea nitrogen (BUN), creatinine, uric-acid, total protein, albumin, bilirubin-total, alkaline phosphatase (ALP), aspartate aminotransferase (AST), alanine aminotransferase (ALT), r-gultamyl- transpeptidase (r-GTP), cholesterol total, triglyceride, glucose fasting, high density lipoprotein (HDL), white blood cell (WBC), red blood cell (RBC), hemoglobin, hematocrite, mean corpuscular volume (MCV), mean corpuscular hemoglobin (MCH), mean corpuscular hemoglobin concentration (MCHC), platelet, lymphocyte (LYM), mixed cell number (MXD), neutrophil (NEUT), homocysteine 등의 항목을 측정하였다. 연구대상자의 익명 성을 보장하기 위하여 이름, 차트번호를 제외한 성별과 연
령으로만 분류된 자료들을 바탕으로 후향적 연구를 진행하 였다. 본 연구의 대상군 총 130명 중 남자는 86명, 여자는 44명으로 집계되었다.
2. 대상군 분류
대상군의 체질량지수 측정결과를 토대로 비만군과 정상 군으로 구분하였다. 비만의 기준점은 대한비만학회에서 제 시한 BMI 25로 정하였으며, BMI 25 이상을 비만군으로, 25 미만인 군을 정상군으로 구분하였다.
3. 체질량지수 측정
대상군의 체질량지수 측정은 대상자가 최대한 가벼운 옷 차림으로 공복인 상태로 진행하였다. 체성분 검사를 통하여 체질량지수를 측정하였으며 체질량지수는 몸무게(kg)를 키 (m)의 제곱으로 나누어 계산하였다. 체성분 분석기는 Inbody 3.0 (Biospace, Seoul, Korea)을 사용하였다.
4. 혈액검사
혈액검사는 식사로 인한 오차를 줄이기 위하여 공복인 상태에서 오전에 진행하였다. 혈액검사에 쓰인 기계로는 KX-21 (Sysmex, Tokyo, Japan), TBA-120FR (Toshiba, Tokyo, Japan)이며 KX-21을 통하여 WBC. RBC, hemo- globin, hematocrite, MCV, MCH, MCHC, platelet, LYM, MXD, NEUT, homocysteine을 측정하였고, TBA-120FR 을 통하여 total protein, albumin, cholesterol total, AST, ALT, ALP, glucose fasting, BUN, creatinine, uric-acid, bilirubin total, r-GTP, triglyceride, HDL을 측정하였다.
5. 통계분석
모든 측정값들은 IBM SPSS Statistics 19.0 (IBM Co.,
Armonk, NY, USA)을 이용하여 분석하였다. BMI 및 혈액검
사 각 측정자료의 기술분석은 평균±표준편차(Mean±SD)로
나타내었으며, 측정자료들은 정규성 검사상 정규 분포를 만
족하였다. 비만군과 정상군의 비교를 위하여 각 군간 독립
t-검정을 시행하였으며, BMI와 각 혈액검사 측정자료간의
상관관계를 분석하기 위하여 단순상관분석에 Pearson 상관
계수를 이용하여 통계처리하였다. 유의 수준은 P<0.05일
때 통계적으로 유의성이 있는 것으로 판단하였다.
Table 1. General Characteristic of the Subjects
Group Male (n=86) Female (n=44) Total Age (yr)
Height (cm) Weight (kg) Body mass index (kg/m
2)
74.45±7.95 161.90±7.03 62.15±10.56
23.66±3.38
80.57±3.27 146.82±7.23 53.18±12.28
24.38±4.55
76.52±7.32 156.79±10.07 59.12±11.91 23.91±3.81
Values are presented as mean±standard deviation.
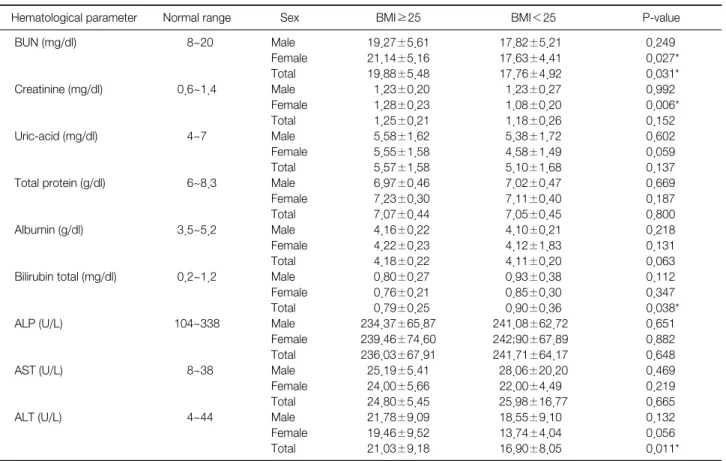
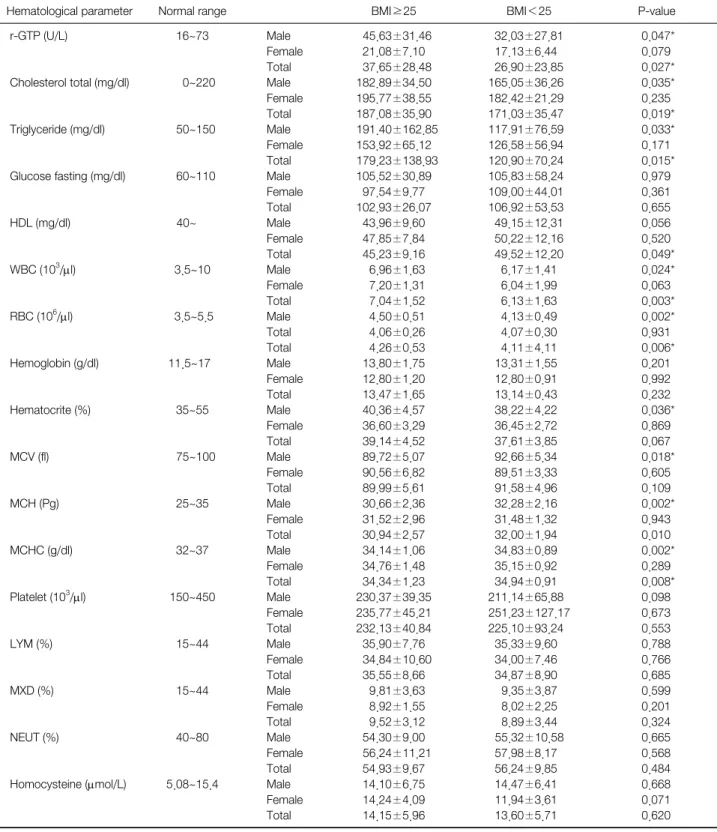
Table 2. Mean and Standard Deviation of Hematological Parameters by BMI
Hematological parameter Normal range Sex BMI≥25 BMI<25 P-value
BUN (mg/dl)
Creatinine (mg/dl)
Uric-acid (mg/dl)
Total protein (g/dl)
Albumin (g/dl)
Bilirubin total (mg/dl)
ALP (U/L)
AST (U/L)
ALT (U/L)
8~20
0.6~1.4
4~7
6~8.3
3.5~5.2
0.2~1.2
104~338
8~38
4~44
Male Female Total Male Female Total Male Female Total Male Female Total Male Female Total Male Female Total Male Female Total Male Female Total Male Female Total
19.27±5.61 21.14±5.16 19.88±5.48 1.23±0.20 1.28±0.23 1.25±0.21 5.58±1.62 5.55±1.58 5.57±1.58 6.97±0.46 7.23±0.30 7.07±0.44 4.16±0.22 4.22±0.23 4.18±0.22 0.80±0.27 0.76±0.21 0.79±0.25 234.37±65.87 239.46±74.60 236.03±67.91 25.19±5.41 24.00±5.66 24.80±5.45 21.78±9.09 19.46±9.52 21.03±9.18
17.82±5.21 17.63±4.41 17.76±4.92 1.23±0.27 1.08±0.20 1.18±0.26 5.38±1.72 4.58±1.49 5.10±1.68 7.02±0.47 7.11±0.40 7.05±0.45 4.10±0.21 4.12±1.83 4.11±0.20 0.93±0.38 0.85±0.30 0.90±0.36 241.08±62.72 242;90±67.89 241.71±64.17 28.06±20.20 22.00±4.49 25.98±16.77 18.55±9.10 13.74±4.04 16.90±8.05
0.249 0.027*
0.031*
0.992 0.006*
0.152 0.602 0.059 0.137 0.669 0.187 0.800 0.218 0.131 0.063 0.112 0.347 0.038*
0.651 0.882 0.648 0.469 0.219 0.665 0.132 0.056 0.011*
Continued.
결 과
1. 일반적 특성
본 연구의 대상자의 일반적인 특성을 살펴보면, 전체 인 원은 130명으로 남자는 86명, 여자는 44명이었다. 남자는 74.45±7.95세, 키는 161.90±7.03 cm, 몸무게는 62.15±
10.56 g, 평균 BMI는 23.66±3.38였으며, 여자는 나이 80.57±3.27세, 키는 146.82±7.23 cm, 몸무게는 53.18±
12.28 kg, BMI는 24.38±4.55였다(Table 1).
2. 측정항목 분석
1) 혈액검사 결과
비만군에서 triglyceride의 수치가 179.23±138.93 mg/dl 을 보이며, 정상군에서의 120.90±70.24 mg/dl에 비해 유 의한 수준으로 높게 나타났으며, 또한 유일하게 정상범위인 50~150 mg/dl보다 높은 것으로 나타났다(P<0.05).
한편, 비만군과 정상군이 통계적으로 유의한 차이를 보
는 지표들은 BUN, bilirubin total, ALT, r-GTP, chol-
esterol total, triglyceride, HDL, WBC, RBC, MCHC으로
나타났다(P<0.05). 남녀로 나누어 보았을 때, 남자에서
r-GTP, cholesterol total, triglyceride, WBC, RBC, hema-
tocrite, MCV, MCH, MCHC가 유의한 차이가 있는 것으
로 나타났고(P<0.05), 여자에서는 BUN, creatinine만이 유
의한 차이가 나타났다(P<0.05; Table 2).
Table 2. Mean and Standard Deviation of Hematological Parameters by BMI (Continued)
Hematological parameter Normal range BMI≥25 BMI<25 P-value
r-GTP (U/L)
Cholesterol total (mg/dl)
Triglyceride (mg/dl)
Glucose fasting (mg/dl)
HDL (mg/dl)
WBC (10
3/μl)
RBC (10
6/μl)
Hemoglobin (g/dl)
Hematocrite (%)
MCV (fl)
MCH (Pg)
MCHC (g/dl)
Platelet (10
3/μl)
LYM (%)
MXD (%)
NEUT (%)
Homocysteine (μmol/L)
16~73
0~220
50~150
60~110
40~
3.5~10
3.5~5.5
11.5~17
35~55
75~100
25~35
32~37
150~450
15~44
15~44
40~80
5.08~15.4
Male Female Total Male Female Total Male Female Total Male Female Total Male Female Total Male Female Total Male Total Total Male Female Total Male Female Total Male Female Total Male Female Total Male Female Total Male Female Total Male Female Total Male Female Total Male Female Total Male Female Total
45.63±31.46 21.08±7.10 37.65±28.48 182.89±34.50 195.77±38.55 187.08±35.90 191.40±162.85
153.92±65.12 179.23±138.93
105.52±30.89 97.54±9.77 102.93±26.07
43.96±9.60 47.85±7.84 45.23±9.16 6.96±1.63 7.20±1.31 7.04±1.52 4.50±0.51 4.06±0.26 4.26±0.53 13.80±1.75 12.80±1.20 13.47±1.65 40.36±4.57 36.60±3.29 39.14±4.52 89.72±5.07 90.56±6.82 89.99±5.61 30.66±2.36 31.52±2.96 30.94±2.57 34.14±1.06 34.76±1.48 34.34±1.23 230.37±39.35 235.77±45.21 232.13±40.84 35.90±7.76 34.84±10.60
35.55±8.66 9.81±3.63 8.92±1.55 9.52±3.12 54.30±9.00 56.24±11.21
54.93±9.67 14.10±6.75 14.24±4.09 14.15±5.96
32.03±27.81 17.13±6.44 26.90±23.85 165.05±36.26 182.42±21.29 171.03±35.47 117.91±76.59 126.58±56.94 120.90±70.24 105.83±58.24 109.00±44.01 106.92±53.53 49.15±12.31 50.22±12.16 49.52±12.20 6.17±1.41 6.04±1.99 6.13±1.63 4.13±0.49 4.07±0.30 4.11±4.11 13.31±1.55 12.80±0.91 13.14±0.43 38.22±4.22 36.45±2.72 37.61±3.85 92.66±5.34 89.51±3.33 91.58±4.96 32.28±2.16 31.48±1.32 32.00±1.94 34.83±0.89 35.15±0.92 34.94±0.91 211.14±65.88 251.23±127.17
225.10±93.24 35.33±9.60 34.00±7.46 34.87±8.90 9.35±3.87 8.02±2.25 8.89±3.44 55.32±10.58
57.98±8.17 56.24±9.85 14.47±6.41 11.94±3.61 13.60±5.71
0.047*
0.079 0.027*
0.035*
0.235 0.019*
0.033*
0.171 0.015*
0.979 0.361 0.655 0.056 0.520 0.049*
0.024*
0.063 0.003*
0.002*
0.931 0.006*
0.201 0.992 0.232 0.036*
0.869 0.067 0.018*
0.605 0.109 0.002*
0.943 0.010 0.002*
0.289 0.008*
0.098 0.673 0.553 0.788 0.766 0.685 0.599 0.201 0.324 0.665 0.568 0.484 0.668 0.071 0.620 Values are presented as number or mean±standard deviation.
BMI: body mass index, BUN: blood urea nitrogen, ALP: alkaline phosphatase, AST: aspartate aminotransferase, ALT: alanine aminotransferase, r-GTP: r-gultamyltranspeptidase, HDL: high density lipoprotein, WBC: white blood cell, RBC: red blood cell, MCV: mean corpuscular volume, MCH: mean corpuscular hemoglobin, MCHC: mean corpuscular hemoglobin concentration, LYM: lymphocyte, MXD: mixed cell number, NEUT:
neutrophil.
*P<0.05.
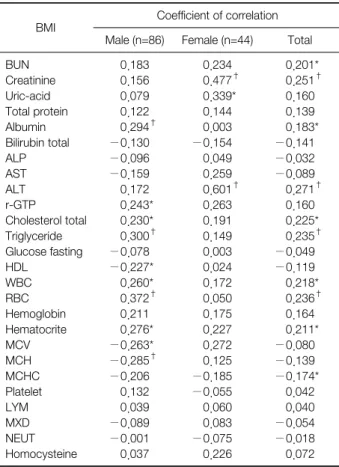
Table 3. Correlation between BMI and Hematological Parameters
BMI Coefficient of correlation Male (n=86) Female (n=44) Total BUN
Creatinine Uric-acid Total protein Albumin Bilirubin total ALP AST ALT r-GTP
Cholesterol total Triglyceride Glucose fasting HDL
WBC RBC Hemoglobin Hematocrite MCV MCH MCHC Platelet LYM MXD NEUT Homocysteine
0.183 0.156 0.079 0.122 0.294
†−0.130
−0.096
−0.159 0.172 0.243*
0.230*
0.300
†−0.078
−0.227*
0.260*
0.372
†0.211 0.276*
−0.263*
−0.285
†−0.206 0.132 0.039
−0.089
−0.001 0.037
0.234 0.477
†0.339*
0.144 0.003
−0.154 0.049 0.259 0.601
†0.263 0.191 0.149 0.003 0.024 0.172 0.050 0.175 0.227 0.272 0.125
−0.185
−0.055 0.060 0.083
−0.075 0.226
0.201*
0.251
†0.160 0.139 0.183*
−0.141
−0.032
−0.089 0.271
†0.160 0.225*
0.235
†−0.049
−0.119 0.218*
0.236
†0.164 0.211*
−0.080
−0.139
−0.174*
0.042 0,040
−0.054
−0.018 0.072 BMI: body mass index, BUN: blood urea nitrogen, ALP: alkaline phosphatase, AST: aspartate aminotransferase, ALT: alanine amino- transferase, r-GTP: r-gultamyltranspeptidase, HDL: high density lipoprotein, WBC: white blood cell, RBC: red blood cell, MCV: mean corpuscular volume, MCH: mean corpuscular hemoglobin, MCHC:
mean corpuscular hemoglobin concentration, LYM: lymphocyte, MXD: mixed cell number, NEUT: neutrophil.
*P<0.05,
†P<0.01.
2) BMI와 혈액검사 수치간의 상관관계 분석
BMI와 각 혈액검사 지표들 간의 상관관계를 분석한 결 과 전체 대상군에서 BMI와 유의한 양의 상관관계를 보이는 지표들은 BUN, creatinine, ALT, cholesterol total, trigly- ceride, WBC, hematocrite였다(P<0.01). 남녀를 구분하여 나타냈을 때, 남자는 albumin, r-GTP, cholesterol total, triglyceride, WBC, RBC, hematocrite에서 유의한 양의 상 관관계를 보였으며 HDL, MCV, MCH에서 유의한 음의 상관관계를 보였다. 한편 여자는 creatinine, uric-acid, ALT에서 유의한 양의 상관관계를 보였다(Table 3).
고 찰
사람은 나이가 들게 되면서 호르몬 대사 등의 영향으로 신체 구성 및 지방의 분포가 변화하게 된다. 20대가 지나면 서부터 지방외조직(fat-free mass)은 점차 감소하게 되어 70대에서는 20대의 약 40% 수준이 된다. 이에 비해 지방 조직은 60대까지 점점 증가하는 경향을 보인다
5). 또한 노인 이 될수록 피하지방과 복부 지방의 증가가 현저하게 나타나 는 것으로 알려져 있다
6). 복강내 지방, 근육내 지방, 간지방 등의 지방량은 증가하게 되는 반면, 제지방은 감소하는 특 징을 나타내고 있다. 특히 제지방 중 근육의 감소가 두드러 지게 나타나며 이에 따른 근력 감소 및 기초대사량의 저하 현상이 나타나게 된다
7). 때문에 노화에 따른 체성분 변화로 인하여 나이가 들수록 자연적으로 체지방률이 증가하게 되 며 비만의 위험성을 높인다고 볼 수 있다.
노인 비만은 그 자체로도 문제이지만 심혈관계 질환 및 대사성 질환
8,9), 골관절염
10), 각종 암
11-13), 각종 만성 통증
14), 치매 등 인지기능 장애
15)등의 다양한 질병과 연관되어 있 다는 각종 연구결과들이 보고되고 있다. 또한 사회와 환경 에 따라 다르게 나타나긴 하지만 노인에게서 BMI가 증가할 수록 사망률도 높아진다는 연구가 보고되었다
16). 이 때문에 노인 비만은 단지 체중의 증가상태만을 나타내는 것이 아니 라 건강의 이상신호이기에 신속한 진단 및 이에 따른 대처 가 필요하다.
노인 비만과 혈액검사의 연관성을 분석한 타 연구들을
살펴보면, Moon과 Kim
17)은 BMI와 유의미한 상관관계를
보이는 지표가 남자노인에게서는 수축기혈압, 여자노인에
서는 수축기혈압, cholesterol total, HDL, low density lip-
oprotein (LDL)이라고 분석하였다. 한편 triglyceride 및
LDL은 통계적인 차이가 없는 것으로 나타났다. Jin
18)의 연
구에 의하면 여성 노인에서 비만군이 정상군에 비해 HDL
이 유의하게 낮다고 하였으며, 비만군의 LDL/HDL ratio,
triglyceride가 정상군에 비해 유의한 정도로 높게 나왔다고
보고하였다. Jeong 등
19)이 시행한 춘천지역 중노년층을 대
상으로 한 연구에서, BMI와 상관성을 나타내는 지표는
HDL-C, cholesterol total, fasting blood sugar (FBS)라고
보고하였다. Yoon 등
20)은 노인군에서 BMI와 HDL-C, 중
성지방, homeostasis model assesment of insulin resistance
이 유의한 관련성이 있다고 제시하였다. Nam 등
21)의 연구 에서는 고지혈증 유무와 비만유무로 군을 나누어 혈액검사 를 시행하였으며, 그 결과 cholesterol total, LDL, HDL은 비만을 동반하지 않은 고지혈증 군에서 더 높게 나타났으 며 FBS와 triglyceride는 비만을 동반한 고지혈증 군에서 더 유의하게 높게 나타났다. 대부분의 연구에서 비만과 cholesterol 등 혈중지질의 연관성에 대해 분석하였고, 또 한 심혈관계 및 대사성 질환과의 연관성에 대하여 분석이 이루어졌다.
본 연구는 혈액검사 결과를 바탕으로 노인 비만군의 전 반적인 신체상태를 분석하였다. 노인 비만군에서 유의한 수 준으로 높게 나온 지표는 BUN, bilirubin total, ALT, r-GTP, cholesterol total, triglyceride, WBC, RBC, MCHC 가 있었으며 HDL은 유의하게 낮았다. 또한 BMI와 혈액검 사 지표의 상관성을 분석해본 결과 BUN, creatinine, ALT, cholesterol total, triglyceride, WBC, RBC, hematocrite에서 유의한 양의 상관관계를 나타냈다. 이를 종합하면 trigly- ceride, cholesterol total, WBC, RBC의 지표들이 정상군에 비하여 노인 비만군에서 유의미한 정도로 높게 나타났으며 또한 BMI와 상관관계가 있는 것으로 확인되었다. 특히 본 연구에서는 노인 비만군에서 triglyceride의 수치가 평균적 으로 정상치를 유의미하게 벗어나게 되면서 노인 비만군의 가장 특징적인 인자로 지목되었다. 또한 다른 연구들에서는 볼 수 없었던 WBC와 RBC가 유의미한 지표로 분석되었다.
Triglyceride는 주로 음식물로 섭취되는 당질과 지방산을 원료로 하여 간에서 합성되는데, 인체조직에 축적되어 열을 생산하여 체온을 유지하고, 운동시 에너지원으로 소비된다.
하지만 혈중에 triglyceride가 높게 나타나 고중성지방혈증 이 발생할 경우 혈액으로 지방산이 방출되어 혈액순환을 방 해하고, 간에 축적되어 지방간을 유발시키기도 하고, 렙틴 이나 사이토카인 등 혈압이나 혈당수치에 영향을 줄 수 있 는 인자들을 분비하여 인체에 악영향을 줄 수 있다
22). Triglyceride의 농도 상승은 cholesterol 수치와 더불어 고지 혈증과 관련이 있다. 고지혈증은 cholesterol total 230 mg/dl 이상, LDL 150 mg/dl 이상, HDL 40 mg/dl 이하, triglyceride 200 mg/dl 이상의 수치가 종합적으로 보일 때 진단하게 되며, 적어도 2회 이상 측정에서 하나라도 이상이 발견되면 고지혈증이라고 진단할 수 있다
23). 역학조사에서
triglyceride의 농도가 심혈관계의 독립적인 위험요소는 아 니라고 자주 보고되는 편이지만, triglyceride의 농도가 높고, HDL의 농도가 낮으며 동시에 LDL/HDL의 비율이 높게 되 면 동맥경화증 등의 위험도가 매우 높아지기 때문에 혈청지 질의 다른 지표들도 종합적으로 평가해야할 필요성을 제기 하고 있다
24). 이에 노인 비만군에서 triglyceride 수치 상승은 노인 비만 관리의 중요 요소 중 하나임을 확인하는 바이다.
한편 본 연구에서는 비만 노인군에서 WBC와 RBC가 비 만군에서 정상군과 유의한 정도의 차이가 있으며 BMI와 상 관성이 있는 것으로 나타났다. 노화에 따라 체지방이 증가 하게 되면 근육 내 지방이 점차 축적되는데, 이 과정에서 염 증성 사이토카인 분비가 증대된다
25). 활성화된 사이토카인 은 WBC 분화의 유발물질이기 때문에, 이로 인하여 WBC 가 증가할 확률이 높아지게 된다
26). 비만과 관련된 RBC의 기전은 아직 연구결과가 없는 상황이기 때문에 추가적인 연 구가 필요한 상황이다. 그런데 각종 연구들을 통하여 비만 군에서의 WBC와 RBC의 증대는 단순히 백혈구, 적혈구 증 가증의 의미만이 아니라 심근경색이나 관상동맥질환 및 중 풍, 심혈관계 등 질환과 연관성이 있다고 보고되었다
27-29). 이는 비만과 연계된 WBC와 RBC의 수치 상승이 임상적으 로 의미가 있으며, WBC와 RBC를 triglyceride 등 혈중지질 과 더불어 심혈관계 질환의 중요한 지표로 고려해 볼 수 있 음을 시사하고 있다.
본 연구의 제한점은 우선 표본의 수가 충분히 많지 않다 는 점이다. 그리고 특정집단에 한정된 표본을 바탕으로 하 였기 때문에 전체 인구집단을 대표하는 데 있어 부족한 점 이 있을 수 있다. 비만을 평가하는 척도로 waist hip ratio, 복부지방률 및 복부둘레 등이 있으나 본 연구에서는 BMI만 기준으로 시행되어 다각적인 분석을 하지 못하였다. 그리고 검진 대상자들의 과거력, 현병력, 식생활습관, 음주흡연 여 부 등 생활습관에 대한 조사가 충분히 이루어지지 않고 단 순히 BMI와 혈액검사 지표로만 분석이 이루어진 점도 본 연구의 제한점이라고 할 수 있겠다.
이를 고려하여 더 많은 인구집단과 표본을 통한 대규모
의 연구가 필요하다고 생각된다. 또한 현병력, 과거력 및 생
활습관 조사를 통해 각 군간의 비차비로 위험성 비교하는
내용을 추가하는 등의 연구가 진행되면 더욱 의미있는 결과
가 나올 것으로 생각된다.
결 론
130명의 만 60세 이상 노인을 대상으로 이루어진 체성분 검사 및 혈액검사를 통하여 다음과 같은 결과가 나왔다.
1. 비만군이 정상군과 비교하였을 때, BUN, bilirubin total, ALT, r-GTP, cholesterol total, triglyceride, WBC, RBC, MCHC가 유의한 수준으로 높았으며, HDL은 유의 한 수준으로 낮게 나왔다. 이중 triglyceride는 비만군에서 정상치보다 높은 수치로 유의하게 측정되었다(P<0.05).
2. BMI와 혈액검사 지표상 상관관계를 분석한 결과, BMI를 기준으로 BUN, creatinine, ALT, cholesterol total, triglyceride, WBC, RBC, hematocrite가 각각 유의한 양의 상관관계를 보였다(P<0.01).
이상의 결과를 종합하였을 때, 본 연구에서는 trigly- ceride 및 cholesterol total, WBC, RBC의 수치가 노인 비 만군에서 정상군에 비해 유의미하게 높았으며 BMI와 상관 성이 나타났다. 특히 triglyceride는 비만군에서 정상치를 벗 어나는 값을 보임에 따라 주의가 필요한 지표로 지목되었으 며, WBC와 RBC의 상승이 타연구와 비교하였을 때 특이한 점으로 나타났다. 향후 추가적인 내용 보완 및 혈액검사 결 과에 따른 건강관리방안 제시가 필요하다.
References