Received October 19, 2011, Revised November 22, 2011, Accepted for publication December 1, 2011
Corresponding author: Ji Yeoun Lee, Department of Dermatology, School of Medicine, Medical Research Institute, Chungbuk National University, 410 Seongbong-ro, Heungdeok-gu, Cheongju 361-763, Korea.
Tel: 82-43-269-6385, Fax: 82-43-266-1698, E-mail: [email protected] This is an Open Access article distributed under the terms of the Creative Commons Attribution Non-Commercial License (http://
creativecommons.org/licenses/by-nc/3.0) which permits unrestricted non-commercial use, distribution, and reproduction in any medium, provided the original work is properly cited.
ORIGINAL ARTICLE
Comparison of Gene Expression Profiles between Keratinocytes, Melanocytes and Fibroblasts
Jung-Suk Lee, Dae-Hun Kim, Dae-Kyoung Choi, Chang Deok Kim, Gwang-Bum Ahn1, Tae Young Yoon1, Jeung-Hoon Lee, Ji Yeoun Lee1
Department of Dermatology, Research Institute for Medical Sciences, School of Medicine, Chungnam National University, Daejeon,
1Department of Dermatology, School of Medicine, Medical Research Institute, Chungbuk National University, Cheongju, Korea
Background: The skin has many important functions such as protection, preservation, temperature regulation, and vitamin D synthesis. It is composed of a variety of cell types including keratinocytes, melanocytes and fibroblasts. Objective: We attempted to compare the gene expression profiles between keratinocytes, melanocytes and fibroblast, using cDNA microarray. Methods: Keratinocytes, melanocytes and fibro- blasts were primary cultured from five foreskin specimens.
Total RNAs were extracted and pooled to reduce the individual variations, and then used for cDNA microarray.
Results: Total 12,028 genes were selected as the reliable genes whose expression was detected in at least one of the three cell types. By comparing the relative expression levels with cutoff limitation as a fourfold change, we obtained 126 fibroblast-specific, 179 keratinocyte-specific and 173 mel- anocyte-specific genes, many of which are known to be characteristically expressed in each cell type. In addition, we identified many genes whose skin-specific functions have not yet been determined. Conclusion: Our data provide important information on which to base further investigation into the specification of skin cell types. (Ann Dermatol 25(1) 36∼45, 2013)
-Keywords-
cDNA microarrays, Fibroblasts, Keratinocytes, Melanocytes
INTRODUCTION
The skin is the largest organ of the body, covering an area of approximately 1.4∼2.0 m2 and with a weight that can reach around 4 kg. It plays a variety of functional roles, including protection, preservation, temperature regulation, and Vitamin D synthesis. Skin is composed of many cell types, among which keratinocytes, melanocytes and fibro- blasts are regarded as the most abundant and functionally important. Keratinocytes constitute a majority of the epi- dermis, and form cornified layers that help to contain body fluids and provide barrier protection from the en- vironment1. Keratinocytes are ectodermally derived and play an essential role in the formation of hair, nail and sebum. Melanocytes are derived from the neural crest and located in the lower epidermis and hair follicles, where they generate melanin to provide coloration and protec- tion from ultraviolet damage2. Fibroblasts, the major cells of the dermal portion, are derived from mesenchyme and synthesize essential extracellular matrix (ECM) compo- nents to provide structural support3.
The characteristics of each skin cell are determined by cell type-specific gene expression patterns. Thus, in order to understand the specification of each cell type, it is nece- ssary to identify the genes whose expressions are confined to specific cells. To profile the gene expression, several noteworthy methods have been developed. DNA micro- array technology is a powerful tool to facilitate massive screening of expression for thousands of genes4. One major application of this technology is the sequence- specific detection and quantification of mRNA expression.
Oligonucleotide DNA microarray allows the identification of mRNA whose level is within a wide linear range. Fur- thermore, owing to the high specificity of DNA sequence detection, oligonucleotide DNA microarray is used for DNA sequencing5. In parallel with oligonucleotide DNA microarrays, cDNA microarray has also been develop- ed6,7. This technology, in contrast to oligonucleotide mi- croarray, uses cDNA molecules to interrogate mRNA samples. The fabrication of cDNA microarray differs in many ways from that of oligonucleotide microarray. Speci- fically, cDNA microarray is generated by spotting cDNA molecules of different lengths onto a given matrix of glass, nitrocellulose or nylon6,7. By pre-treating the surface of the microarray slide with polylysine or aminosilane, the spe- cific hybridization of DNA strands to the target may be enhanced, while at the same time the enhanced hydro- phobicity of the matrix helps to avoid non-specific attach- ment of target molecules. Using the cDNA microarray technique, in this study we attempted to compare the gene expression profiles between keratinocytes, melano- cytes and fibroblasts. Our data provide important insight into the specification of each skin cell.
MATERIALS AND METHODS
Cell culture and RNA isolation
Normal human skin samples were obtained from circumcisions. Keratinocytes, melanocytes and fibroblasts were isolated from the foreskins of five donors. Specimens were briefly sterilized in 70% ethanol, minced, and then treated with dispase overnight at 4oC. The epidermis was separated and placed in a solution containing 0.05%
trypsin and 0.02% EDTA for 15 minutes at 37oC. For keratinocytes, cells were resuspended in keratinocyte- serum free medium (K-SFM) supplemented with bovine pituitary extract and recombinant human epidermal grow- th factor (Invitrogen, Grand Island, NY, USA), as previ- ously reported8. Third passaged keratinocytes (60∼75%
confluency) were used in this experiment. For melano- cytes, cells were resuspended in Medium 154 and human melanocyte growth supplement (Cascade Biologics, Portland, OR, USA). During the primary culture of human melanocytes, 200 μg/ml of G418 (geneticin sulfate, Du- chefa, Haarlem, The Netherlands) was added to the grow- th medium to suppress the proliferation of fibroblasts9. Primary dermal fibroblasts were obtained by the explant culture method, and maintained in Dulbecco’s modified Eagle's medium (DMEM) supplemented with 10% fetal bovine serum (Invitrogen).
cDNA microarray
Total RNA samples were extracted using RNeasy Mini Kits (Qiagen, Hilden, Germany) according to the recommen- ded protocol. The quality of all RNA samples was evalu- ated using agarose gel electrophoresis. Keratinocytes, mel- anocytes and fibroblasts were primary cultured from five foreskin specimens. Total RNAs were extracted, pooled to reduce the individual variations, and then used for cDNA microarray. For cDNA microarray analysis, aliquots of 100 μg of total RNA were labeled with Cy3 or Cy5 mono- reactive dyes (Amersham, Buckinghamshire, UK) using a Superscript cDNA system (Gibco BRL, Grand Island, NY, USA). Labeled Cy3 and Cy5 cDNA probes were then cleaned using a Qiaquick nucleotide removal kit (Qiagen).
The purified probes were dried and resuspended in 40 μl of hybridization buffer containing 5X SSC, 0.1% SDS, 20 μg of Cot-1 DNA (Gibco BRL), 20 μg of poly(A) RNA, and 20 μg of yeast tRNA (Gibco BRL). The probes were denatured at 95oC for 3 minutes before being applied to the microarray slides. Hybridization was performed at 42oC for 16 hours, and the microarray slides were washed once with 2X SSC, 0.1% SDS at 42oC for 4 minutes, once with 0.1X SSC, 0.1% SDS at room temperature for 10 minutes, and three times with 0.1X SSC at room temperature for 1 minute. The microarray slides were then washed with distilled water and spin-dried.
Microarray scanning and normalization of the data were performed using a GenePix 4000B scanner and GenePix Pro 3.0 software (Axon Instruments, Union City, CA, USA). Poor-quality spots (sum of median <500) were filtered from the raw data before analysis. For each hybridized spot, the background intensity was subtracted and normalized by the global median normalization method10. The ratio of Cy5 and Cy3 fluorescence intensity was assigned as the gene expression value (GEV) for determination of the relative gene expression level. The cDNA microarray experiments were repeated twice, and the average of two GEVs for each gene was used for further analysis. Genes with a fourfold or more differential expression were analyzed. To further analyze the gene expression patterns, the self-organizing map (SOM) method was used, and the node number for SOM clustering was set at 3. Gene expression pattern clustering (hierarchical clustering and SOM) was performed using the programs Cluster version 2.12 and TreeView version 1.5011.
Statistical analysis
The fluorescence intensities from the microarray results were measured as indicators of the gene expression levels.
We used foreground intensities after transforming the
Fig. 2. Self-organizing maps (SOM) analysis of the differentially expre- ssed genes. (A) Four hundred and seventy eight genes were selected as differentially expressed genes, the expression levels of which sho- wed changes greater than fourfold over the other two cell types. Each cluster is represented by its gene expression value. The numbers in each graph show the number of genes belonging to the correspon- ding cluster. (B) Three-dimensio- nal deposition of differentially ex- pressed genes. KC: keratinocytes, FB: fibroblasts, MC: melanocytes.
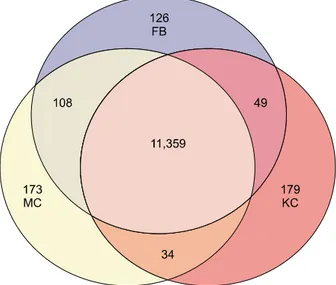
Fig. 1. Venn diagram summarizing the number of specific genes identified by cDNA microarray. A total 12,028 genes were obtained for which expression was detected in at least one of three cell types. KC: keratinocytes, FB: fibroblasts, MC: mela- nocytes.
values by a logarithm of base two as expression values for the subsequent analysis. The majority of microarray data analysis was conducted using R software (http://www.r- project.org). We normalized the expression values of the 15,704 genes within a slide by the regional Lowess method12. To identify the differentially expressed genes among different cell types, we adopted the analysis of variance (ANOVA) model approach. To control for an inflated false positive rate due to multiple testing, we adjusted individual p-values using Benjamin-Hochberg's method, which controls the false discovery rate (FDR)13. To group genes according to their relative expression patterns among three different cell types, we used the combined approach with K-means clustering and Linear Discriminant Analysis (LDA). At first, we clustered genes using K-means algorithm with as many as 20 centroids for groups to obtain as many homogeneous pattern groups as possible. From the clustering result, we classified genes into three groups as follows: (1) upregulated in fibroblasts, (2) upregulated in keratinocytes, (3) upregulated in mel- anocytes. To provide a graphical view of the expression patterns of these three groups, we drew a heatmap using R. Finally, gene ontology analysis was performed to find the over-representative functions of genes in each group using GOstat (http://gostat.wehi.edu.au/)14.
Real-time polymerase chain reaction (PCR)
Total RNA was extracted using an RNeasy kit and cDNA was made using a reverse-transcription kit. PCR was
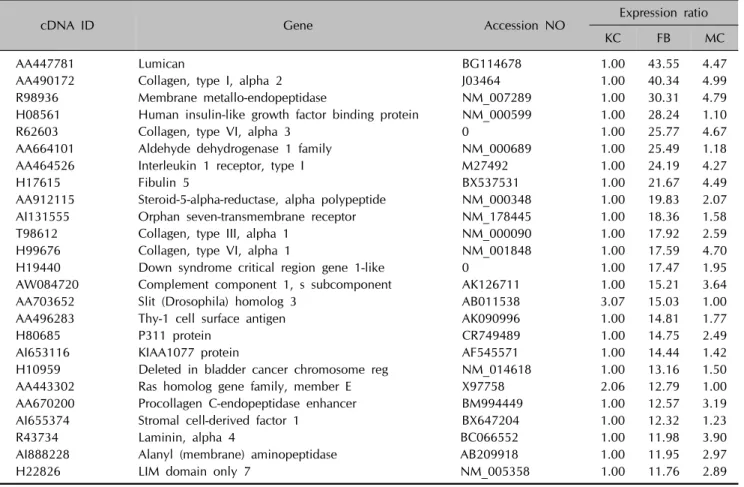
Table 1. List of top 25 upregulated genes in the fibroblasts
cDNA ID Gene Accession NO Expression ratio
KC FB MC
AA447781 Lumican BG114678 1.00 43.55 4.47
AA490172 Collagen, type I, alpha 2 J03464 1.00 40.34 4.99
R98936 Membrane metallo-endopeptidase NM_007289 1.00 30.31 4.79
H08561 Human insulin-like growth factor binding protein NM_000599 1.00 28.24 1.10
R62603 Collagen, type VI, alpha 3 0 1.00 25.77 4.67
AA664101 Aldehyde dehydrogenase 1 family NM_000689 1.00 25.49 1.18
AA464526 Interleukin 1 receptor, type I M27492 1.00 24.19 4.27
H17615 Fibulin 5 BX537531 1.00 21.67 4.49
AA912115 Steroid-5-alpha-reductase, alpha polypeptide NM_000348 1.00 19.83 2.07
AI131555 Orphan seven-transmembrane receptor NM_178445 1.00 18.36 1.58
T98612 Collagen, type III, alpha 1 NM_000090 1.00 17.92 2.59
H99676 Collagen, type VI, alpha 1 NM_001848 1.00 17.59 4.70
H19440 Down syndrome critical region gene 1-like 0 1.00 17.47 1.95
AW084720 Complement component 1, s subcomponent AK126711 1.00 15.21 3.64
AA703652 Slit (Drosophila) homolog 3 AB011538 3.07 15.03 1.00
AA496283 Thy-1 cell surface antigen AK090996 1.00 14.81 1.77
H80685 P311 protein CR749489 1.00 14.75 2.49
AI653116 KIAA1077 protein AF545571 1.00 14.44 1.42
H10959 Deleted in bladder cancer chromosome reg NM_014618 1.00 13.16 1.50
AA443302 Ras homolog gene family, member E X97758 2.06 12.79 1.00
AA670200 Procollagen C-endopeptidase enhancer BM994449 1.00 12.57 3.19
AI655374 Stromal cell-derived factor 1 BX647204 1.00 12.32 1.23
R43734 Laminin, alpha 4 BC066552 1.00 11.98 3.90
AI888228 Alanyl (membrane) aminopeptidase AB209918 1.00 11.95 2.97
H22826 LIM domain only 7 NM_005358 1.00 11.76 2.89
KC: keratinocytes, FB: fibroblasts, MC: melanocytes.
performed on a Rotor-Gene 2000 real-time amplification operator (Corbett Research, Mortlake, Australia). Primers were designed using Primer 3 and all primers were veri- fied by BLAST to ensure that each sequence was unique for the specific target gene. The PCRs contained a final concentration of 1×SYBR Green PCR Master Mix (Appli- ed Biosystems, Warrington, UK), 10 μM specific primers, and 2.5 ng of cDNA. The expression of genes was calculated according to the threshold cycle value, nor- malized using the value of the sample with the lowest level of each product, and the data were expressed as the ratio of each gene to cyclophilin.
RESULTS AND DISCUSSION
Gene expression profiles
To analyze the gene expression profiles between kera- tinocytes, melanocytes and fibroblasts, we performed cDNA microarray analysis, in which a loop design was adopted. That is, the gene expression levels were com- pared between two cells types using Cy5 and Cy3 probes:
keratinocytes (Cy5) vs melanocytes (Cy3), melanocytes
(Cy5) vs fibroblasts (Cy3), and fibroblasts (Cy5) vs. kera- tinocytes (Cy3). For accuracy of analysis, dye swap experi- ments were also performed. We used 17 K cDNA micro- array for hybridization, and obtained 12,028 relevant genes whose expression was detected in at least one of three cell types (Fig. 1). By comparing the relative expre- ssion levels by ANOVA test with cutoff limitation as a fourfold change, we obtained 478 genes that revealed differential expression in each of the three cell types. We further analyzed the gene expression pattern by SOM and classified the genes into three major gene clusters (Fig. 2).
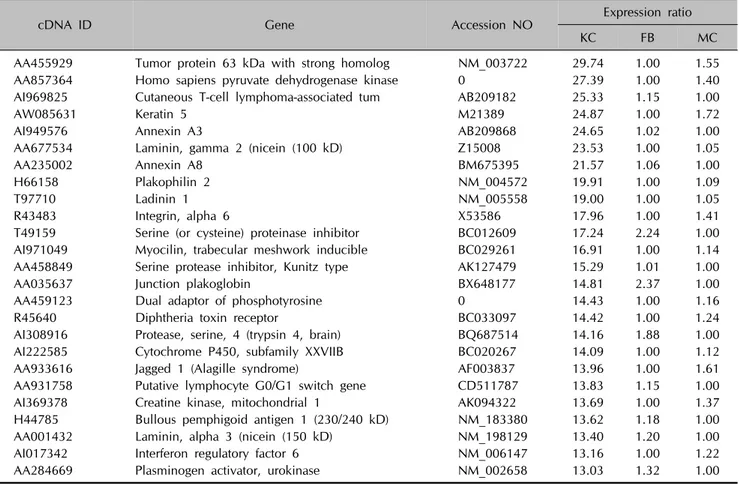
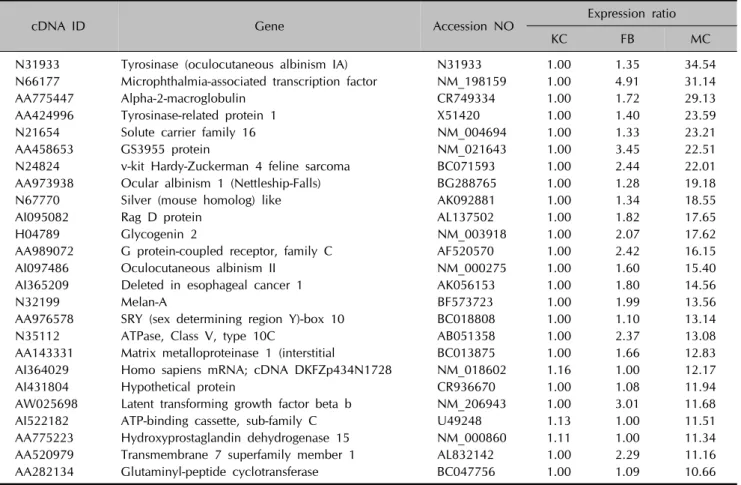
These clusters correspond to groups of coordinately regulated genes that represent expression signatures for fibroblasts, keratinocytes or melanocytes. Cluster 1 includes 126 genes that were expressed at high levels in fibroblasts, but at low levels in keratinocytes and melanocytes (Table 1). Cluster 2 contains 179 genes that were highly and specifically expressed in keratinocytes (Table 2). Cluster 3 includes 173 genes transcripts that were expressed at the highest levels in melanocytes (Table 3).
The expression of randomly selected genes from three SOMs was verified using real-time PCR analysis. There
Table 2. List of top 25 upregulated genes in the keratinocytes
cDNA ID Gene Accession NO Expression ratio
KC FB MC
AA455929 Tumor protein 63 kDa with strong homolog NM_003722 29.74 1.00 1.55
AA857364 Homo sapiens pyruvate dehydrogenase kinase 0 27.39 1.00 1.40
AI969825 Cutaneous T-cell lymphoma-associated tum AB209182 25.33 1.15 1.00
AW085631 Keratin 5 M21389 24.87 1.00 1.72
AI949576 Annexin A3 AB209868 24.65 1.02 1.00
AA677534 Laminin, gamma 2 (nicein (100 kD) Z15008 23.53 1.00 1.05
AA235002 Annexin A8 BM675395 21.57 1.06 1.00
H66158 Plakophilin 2 NM_004572 19.91 1.00 1.09
T97710 Ladinin 1 NM_005558 19.00 1.00 1.05
R43483 Integrin, alpha 6 X53586 17.96 1.00 1.41
T49159 Serine (or cysteine) proteinase inhibitor BC012609 17.24 2.24 1.00 AI971049 Myocilin, trabecular meshwork inducible BC029261 16.91 1.00 1.14
AA458849 Serine protease inhibitor, Kunitz type AK127479 15.29 1.01 1.00
AA035637 Junction plakoglobin BX648177 14.81 2.37 1.00
AA459123 Dual adaptor of phosphotyrosine 0 14.43 1.00 1.16
R45640 Diphtheria toxin receptor BC033097 14.42 1.00 1.24
AI308916 Protease, serine, 4 (trypsin 4, brain) BQ687514 14.16 1.88 1.00
AI222585 Cytochrome P450, subfamily XXVIIB BC020267 14.09 1.00 1.12
AA933616 Jagged 1 (Alagille syndrome) AF003837 13.96 1.00 1.61
AA931758 Putative lymphocyte G0/G1 switch gene CD511787 13.83 1.15 1.00
AI369378 Creatine kinase, mitochondrial 1 AK094322 13.69 1.00 1.37
H44785 Bullous pemphigoid antigen 1 (230/240 kD) NM_183380 13.62 1.18 1.00
AA001432 Laminin, alpha 3 (nicein (150 kD) NM_198129 13.40 1.20 1.00
AI017342 Interferon regulatory factor 6 NM_006147 13.16 1.00 1.22
AA284669 Plasminogen activator, urokinase NM_002658 13.03 1.32 1.00
KC: keratinocytes, FB: fibroblasts, MC: melanocytes.
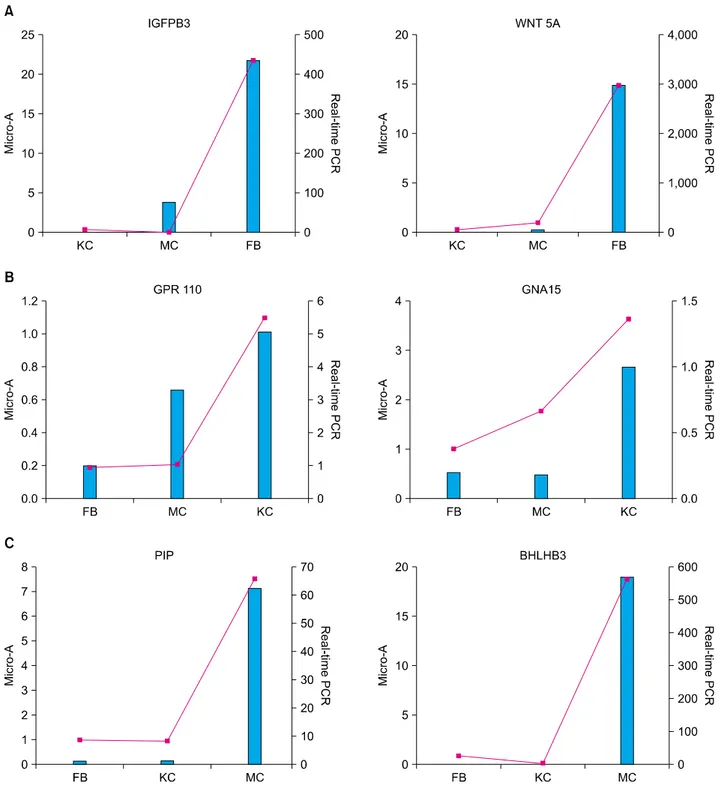
were good correlations between the average SOM values and the real-time PCR results for each gene. The expre- ssion of insulin-like growth factor binding protein 3 (IGFBP3) and WNT 5A, which were classified into cluster 1, was highly expressed in fibroblasts, but expressed at very low levels in keratinocytes and melanocytes (Fig.
3A). G protein-coupled receptor 110 (GPR110) and Guanine nucleotide binding protein (G protein), alpha 15 (Gq class) (GNA15), which were classified into cluster 2, were verified as a highly expressed in keratinocytes by real-time PCR analysis (Fig. 3B). Real-time PCR analysis convincingly confirmed that two genes belonged to cluster 3 and were overexpressed in melanocytes: Pirin (iron-binding nuclear protein) (PIR), and Basic helix-loop- helix domain containing, class B, 3 (BHLHB3) (Fig. 3C).
Cluster 1
Cluster 1 includes those genes that were highly expressed in fibroblasts and had relatively low expression levels in keratinocytes and melanocytes. Fibroblasts are derived from mesechyme and are responsible for the tensile strength of skin tissue by synthesizing various connective
tissue matrix proteins and a number of soluble factors15. They are also implicated in skin photoaging16. Relative to young or normal skin, the dermis of photoaged skin shows both qualitative and quantitative differences in dermal collagen, elastins, and other structural components produ- ced by fibroblasts17. In our cDNA microarray, the genes that were highly expressed in fibroblasts contained many ECM components such as collagen 1A2, 6A3, and 3A1 (Table 1), indicating that the experiments were metho- dologically appropriate. As noted, the physiologic role of collagen fibers in the skin is to provide the tensile properties that allow the skin to serve as a protective organ against external trauma. Collagen 1A2 is a fibrillar forming collagen that is found in skin, bone tendon and ligament18. Defects in this gene have been linked with defects in skin ranging from hyperextendability to poor wound healing19. Collagen 6A3 assembles into a relatively thin microfibrillar network, which may perform an ancho- ring function by stabilizing the assembly of the broad collagen fibers as well as the basement membranes20. Mutations in type VI collagen genes can lead to congenital muscular dystrophy, with no apparent phenotype in the
Table 3. List of top 25 upregulated genes in the melanocytes
cDNA ID Gene Accession NO Expression ratio
KC FB MC
N31933 Tyrosinase (oculocutaneous albinism IA) N31933 1.00 1.35 34.54
N66177 Microphthalmia-associated transcription factor NM_198159 1.00 4.91 31.14
AA775447 Alpha-2-macroglobulin CR749334 1.00 1.72 29.13
AA424996 Tyrosinase-related protein 1 X51420 1.00 1.40 23.59
N21654 Solute carrier family 16 NM_004694 1.00 1.33 23.21
AA458653 GS3955 protein NM_021643 1.00 3.45 22.51
N24824 v-kit Hardy-Zuckerman 4 feline sarcoma BC071593 1.00 2.44 22.01
AA973938 Ocular albinism 1 (Nettleship-Falls) BG288765 1.00 1.28 19.18
N67770 Silver (mouse homolog) like AK092881 1.00 1.34 18.55
AI095082 Rag D protein AL137502 1.00 1.82 17.65
H04789 Glycogenin 2 NM_003918 1.00 2.07 17.62
AA989072 G protein-coupled receptor, family C AF520570 1.00 2.42 16.15
AI097486 Oculocutaneous albinism II NM_000275 1.00 1.60 15.40
AI365209 Deleted in esophageal cancer 1 AK056153 1.00 1.80 14.56
N32199 Melan-A BF573723 1.00 1.99 13.56
AA976578 SRY (sex determining region Y)-box 10 BC018808 1.00 1.10 13.14
N35112 ATPase, Class V, type 10C AB051358 1.00 2.37 13.08
AA143331 Matrix metalloproteinase 1 (interstitial BC013875 1.00 1.66 12.83 AI364029 Homo sapiens mRNA; cDNA DKFZp434N1728 NM_018602 1.16 1.00 12.17
AI431804 Hypothetical protein CR936670 1.00 1.08 11.94
AW025698 Latent transforming growth factor beta b NM_206943 1.00 3.01 11.68
AI522182 ATP-binding cassette, sub-family C U49248 1.13 1.00 11.51
AA775223 Hydroxyprostaglandin dehydrogenase 15 NM_000860 1.11 1.00 11.34
AA520979 Transmembrane 7 superfamily member 1 AL832142 1.00 2.29 11.16
AA282134 Glutaminyl-peptide cyclotransferase BC047756 1.00 1.09 10.66
KC: keratinocytes, FB: fibroblasts, MC: melanocytes.
skin but with limited joint hypermobility21. Collagen 3A1 predominates in human skin during embryonic life22. Mutations in Collagen 3A1 cause the vascular type of Ehlers-Danlos syndrome.
Other examples in this cluster include procollagen C-en- dopeptidase enhancer and lumican. The former stimulates the C-proteinase activity that is required for conversion of procollagen to collagen23. A lack of this enzyme results in impaired tensile strength of collagen fibers in the skin.
Lumican belongs to the corneal leucine-rich repeat prote- oglycan family, which play a critical role in generating and maintaining a transparent matrix within the corneal stroma24. So far, it is unknown whether lumican is expressed in dermal fibroblasts and further investigation of this topic is required.
Cluster 2
This cluster contains genes that were highly expressed in keratinocytes as compared with other two cell types. The keratinocytes are the ectodermally derived cells that constitute more than 80% of the epidermal cells. All keratinocytes contain cytoplasmic keratin intermediate
filaments in their cytoplasm and form desmosomes or modified desmosomal junctions with adjacent cells. In accordance with the fact that keratin filaments are the hallmark of the keratinocytes, in our cDNA microarray results keratin 5 was highly ranked in this cluster (Table 2).
Keratin 5 is a well-established biomarker for basal kera- tinocytes, and it has been demonstrated that mutations in this gene cause a blistering disorder of human skin, epidermolysis bullosa simplex25-27. It has been known that many of the keratinocyte-specific genes are located at the region of epidermal differentiation complex (EDC) in chromosome 1q21, and that EDC contains a large number of genes related to cornified envelope formation such as loricrin, involucrin, filaggrin, and the S100 family (or annexins)28. In our cDNA microarray, however, expre- ssion of those cornified envelope-related genes was not detected and/or they were ranked as low expressed genes.
Because we used keratinocytes cultured in low calcium medium, which does not permit keratinocyte differenti- ation and thereby represents the basal layer characteri- stics, the low level expression of those genes was some- what plausible.
Fig. 3. Real-time PCR analysis of selected genes from SOMs. The data are logarithmically transformed and represented as expression relative to cyclophilin (left scale, line graph). Microarray results of gene expression value (GEV) for selected genes are depicted as bar graphs (right scale). (A) Insulin-like growth factor binding protein 3 (IGFBP3) and WNT 5A were overexpressed in fibroblasts.
(B) G protein-coupled receptor 110 (GPR110) and Guanine nucleotide binding protein (G protein), alpha 15 (Gq class) (GNA15) were overexpressed in keratinocytes. (C) Pirin (iron-binding nuclear protein) (PIR), and Basic helix-loop-helix domain containing, class B, 3 (BHLHB3) were overexpressed in melanocytes. KC: keratinocytes, FB: fibroblasts, MC: melanocytes, PCR: polymerase chain reaction, SOM: self-organizing maps.
In our cDNA microarray, three annexins (A2, A3, and A8) were ranked as being highly expressed genes in kera- tinocytes. Annexin A3, also called "lipocortin 3" or "place-
ntal anticoagulant protein 3" (PAP-III), is a member of the lipocortin/Anx family that binds to phospholipids and membranes in a calcium-dependent manner29. Annexin
A3 has been shown to have anticoagulant and anti- phospholipase A2 properties in vitro30 and to promote the calcium-dependent aggregation of isolated specific gra- nules from human neutrophils31. Annexin A8 proteins are involved in injury response, inflammation, and in tumor suppression32. Although the functional roles of Annexin A3 and A8 have not yet been identified, it is interesting that an earlier report indicates that Annexin 1 and 2 bind to calcium, then exert their effects as the pro-differen- tiating factors in keratinocytes in vitro33. From this, we speculate that Annexin A3 and A8 may have similar effects on keratinocytes. Elucidation of the putative roles of those gene products will be an interesting topic for further study.
In our cDNA microarray, many of the genes related to the cell-cell junction were identified as being especially hig- hly expressed in keratinocytes. Compared to the other two cell types, keratinocytes are packed in the epidermis in a condensed way, reflecting the importance of cell to cell contacts. For example, keratinocytes have numerous juctional structures, including desmosome, hemidesmo- some and adherens junctions and tight junctions. The desmosomal plaque is composed of several intracellular plakin proteins, including phlakophilin and plakoglobin.
Desmosome mechanically couples adjacent keratinocytes.
Moreover it plays a significant role in epidermal differen- tiation and is part of the cornified cell envelope. Mutations in phlakophilin and plakoglobin cause ectodermal dys- plasia/skin fragility syndrome and Naxos syndrome, res- pectively34,35. Hemidesmosome, anchoring filaments and anchoring fibrils are components of the dermal-epidermal junction basement membrane. Bullous pemphigoid anti- gen-1 (BPAg-1) is the major component of the hemide- smosomal inner plaque. Deletions in BPAg-1 cause epi- dermolysis bullosa simplex. Integrin is a large class of transmembrane ECM binding proteins that provide cell attachment and subsequent signal transduction. Integrin α6β4 has a high affinity for laminin 5, and is therefore essential to integration of hemidesmosome with the underlying basement membrane and stroma. Mutations in α6 or β4 chains result in dermal-epidermal insta- bility36,37. Laminin 5 has been localized to the anchoring filaments and is essential in keratinocyte adhesion. Muta- tions in α3 or γ2 chains of laminin 5 result in severe Herlitz’ junctional epidermolysis bullosa38. In this experi- ment, α3 and γ2 chains of laminin 5 and integrin α6 chains showed signature expression in the keratinocytes.
Cluster 3
This cluster contains genes that were highly expressed in melanocytes and expressed at very low levels in fibro-
blasts and keratinocytes. Melanocytes are dendritic, pig- ment-synthesizing cells derived from neural crust, for which pigmentation-related genes are excellent signature biomarkers39,40. In accordance with this fact, in our cDNA microarray results, pigmentation-related genes such as tyrosinase, microphthalmia associated transcription factor (MITF), tyrosinase-related protein 1, ocular albinism I, silver, oculocutaneous albinism II, and melan-A were ranked as the highly expressed genes in melanocytes.
Besides this, we found several genes that have not been previously known in melanocytes such as glutaminyl- peptide cyclotransferase (QPCT), which has been well- studied in bovine pituitary41. The putative role of this gene remains to be determined.
In our results, Disheveled (Dvl) (the 65th gene in the upregulated genes in the melanocytes) was identified as a signature gene in melanocytes. Dvl is required for Wnt signals, which enhance the induction of melanoblasts from neural crust cells42. Wnts are secreted glycoproteins that play a critical role in melanocyte fate decision by activating the Frizzled family. Activation of Frizzled recep- tor by Wnt triggers the activation of Dvl, which in turn inactivates glycogen synthase kinase 3β (GSK3β). As a consequence, the level of β-catenin increases, allowing its translocation to the nucleus and facilitates the activation of genes by Tcf/Lef transcription factors. A key target of Tcf/Lef/ β-catenin in early melanocyte precursors is MITF43,44. Therefore, we speculate that a high expression of Dvl is required for proper specification of melanocytes.
In summary, we compared the gene expression profiles between keratinocytes, melanocytes and fibroblasts. We found many novel signature genes for each cell type, the functions of which have not yet been reported. Although the precise functional roles of such genes remain to be determined, our data add new information on which to base further investigation into the regulatory mechanism underlying the specification of skin cells.
ACKNOWLEDGMENT
This study was supported by a grant from the Korea Health 21 R&D Project, Ministry of Health & Welfare, Korea (01-PJ3-PG6-01GN12-0001). This study was also supported by a grant from the National Research Foun- dation of Korea (KRF-2008-314-E00152).
REFERENCES
1. Fartasch M, Ponec M. Improved barrier structure formation in air-exposed human keratinocyte culture systems. J Invest Dermatol 1994;102:366-374.
2. Sturm RA, Box NF, Ramsay M. Human pigmentation gene- tics: the difference is only skin deep. Bioessays 1998;20:
712-721.
3. Takeda K, Gosiewska A, Peterkofsky B. Similar, but not identical, modulation of expression of extracellular matrix components during in vitro and in vivo aging of human skin fibroblasts. J Cell Physiol 1992;153:450-459.
4. Schena M, Shalon D, Davis RW, Brown PO. Quantitative monitoring of gene expression patterns with a complemen- tary DNA microarray. Science 1995;270:467-470.
5. Chee M, Yang R, Hubbell E, Berno A, Huang XC, Stern D, et al. Accessing genetic information with high-density DNA arrays. Science 1996;274:610-614.
6. Duggan DJ, Bittner M, Chen Y, Meltzer P, Trent JM. Expre- ssion profiling using cDNA microarrays. Nat Genet 1999;
21(1 Suppl):10-14.
7. Cheung VG, Morley M, Aguilar F, Massimi A, Kucherlapati R, Childs G. Making and reading microarrays. Nat Genet 1999;21(1 Suppl):15-19.
8. Hwang C, Jang S, Choi DK, Kim S, Lee JH, Lee Y, et al. The role of nkx2.5 in keratinocyte differentiation. Ann Dermatol 2009;21:376-381.
9. Kim JH, Sohn KC, Choi TY, Kim MY, Ando H, Choi SJ, et al.
Beta-catenin regulates melanocyte dendricity through the modulation of PKCzeta and PKCdelta. Pigment Cell Melanoma Res 2010;23:385-393.
10. Yang YH, Dudoit S, Luu P, Lin DM, Peng V, Ngai J, et al.
Normalization for cDNA microarray data: a robust composite method addressing single and multiple slide systematic variation. Nucleic Acids Res 2002;30:e15.
11. Eisen MB, Spellman PT, Brown PO, Botstein D. Cluster analysis and display of genome-wide expression patterns.
Proc Natl Acad Sci U S A 1998;95:14863-14868.
12. Kerr MK, Martin M, Churchill GA. Analysis of variance for gene expression microarray data. J Comput Biol 2000;7:819- 837.
13. Hochberg Y, Benjamini Y. More powerful procedures for multiple significance testing. Stat Med 1990;9:811-818.
14. Beissbarth T, Speed TP. GOstat: find statistically overrepre- sented Gene Ontologies within a group of genes. Bioinfor- matics 2004;20:1464-1465.
15. Pieraggi MT, Bouissou H, Angelier C, Uhart D, Magnol JP, Kokolo J. The fibroblast. Ann Pathol 1985;5:65-76.
16. Hadshiew IM, Eller MS, Gilchrest BA. Skin aging and photo- aging: the role of DNA damage and repair. Am J Contact Dermat 2000;11:19-25.
17. Yaar M, Gilchrest BA. Cellular and molecular mechanisms of cutaneous aging. J Dermatol Surg Oncol 1990;16:915- 922.
18. Mundlos S, Chan D, Weng YM, Sillence DO, Cole WG, Bateman JF. Multiexon deletions in the type I collagen COL1A2 gene in osteogenesis imperfecta type IB. Molecules containing the shortened alpha2(I) chains show differential incorporation into the bone and skin extracellular matrix. J Biol Chem 1996;271:21068-21074.
19. Byers PH. Inherited disorders of collagen gene structure and expression. Am J Med Genet 1989;34:72-80.
20. Keene DR, Engvall E, Glanville RW. Ultrastructure of type VI collagen in human skin and cartilage suggests an anchoring function for this filamentous network. J Cell Biol 1988;107:
1995-2006.
21. Scacheri PC, Gillanders EM, Subramony SH, Vedanarayanan V, Crowe CA, Thakore N, et al. Novel mutations in collagen VI genes: expansion of the Bethlem myopathy phenotype.
Neurology 2002;58:593-602.
22. Epstein EH Jr. (Alpha1(3))3 human skin collagen. Release by pepsin digestion and preponderance in fetal life. J Biol Chem 1974;249:3225-3231.
23. Prockop DJ, Sieron AL, Li SW. Procollagen N-proteinase and procollagen C-proteinase. Two unusual metalloproteinases that are essential for procollagen processing probably have important roles in development and cell signaling. Matrix Biol 1998;16:399-408.
24. Funderburgh JL, Funderburgh ML, Brown SJ, Vergnes JP, Hassell JR, Mann MM, et al. Sequence and structural impli- cations of a bovine corneal keratan sulfate proteoglycan core protein. Protein 37B represents bovine lumican and proteins 37A and 25 are unique. J Biol Chem 1993;268:11874- 11880.
25. Jiang CK, Tomić-Canić M, Lucas DJ, Simon M, Blumenberg M. TGF beta promotes the basal phenotype of epidermal keratinocytes: transcriptional induction of K#5 and K#14 keratin genes. Growth Factors 1995;12:87-97.
26. Lane EB, Rugg EL, Navsaria H, Leigh IM, Heagerty AH, Ishida-Yamamoto A, et al. A mutation in the conserved helix termination peptide of keratin 5 in hereditary skin blistering.
Nature 1992;356:244-246.
27. Chen H, Bonifas JM, Matsumura K, Ikeda S, Leyden WA, Epstein EH Jr. Keratin 14 gene mutations in patients with epidermolysis bullosa simplex. J Invest Dermatol 1995;105:
629-632.
28. Mischke D, Korge BP, Marenholz I, Volz A, Ziegler A.
Genes encoding structural proteins of epidermal cornifica- tion and S100 calcium-binding proteins form a gene com- plex ("epidermal differentiation complex") on human chro- mosome 1q21. J Invest Dermatol 1996;106:989-992.
29. Gerke V, Moss SE. Annexins: from structure to function.
Physiol Rev 2002;82:331-371.
30. Tait JF, Sakata M, McMullen BA, Miao CH, Funakoshi T, Hendrickson LE, et al. Placental anticoagulant proteins:
isolation and comparative characterization four members of the lipocortin family. Biochemistry 1988;27:6268-6276.
31. Ernst JD, Hoye E, Blackwood RA, Jaye D. Purification and characterization of an abundant cytosolic protein from human neutrophils that promotes Ca2(+)-dependent aggre- gation of isolated specific granules. J Clin Invest 1990;85:
1065-1071.
32. Thorey IS, Roth J, Regenbogen J, Halle JP, Bittner M, Vogl T, et al. The Ca2+-binding proteins S100A8 and S100A9 are encoded by novel injury-regulated genes. J Biol Chem 2001;276:35818-35825.
33. Ma AS, Ozers LJ. Annexins I and II show differences in subcellular localization and differentiation-related changes in human epidermal keratinocytes. Arch Dermatol Res
1996;288:596-603.
34. Allen E, Yu QC, Fuchs E. Mice expressing a mutant desmo- somal cadherin exhibit abnormalities in desmosomes, proli- feration, and epidermal differentiation. J Cell Biol 1996;133:
1367-1382.
35. Haftek M, Serre G, Mils V, Thivolet J. Immunocytochemical evidence for a possible role of cross-linked keratinocyte envelopes in stratum corneum cohesion. J Histochem Cyto- chem 1991;39:1531-1538.
36. Ruzzi L, Gagnoux-Palacios L, Pinola M, Belli S, Meneguzzi G, D'Alessio M, et al. A homozygous mutation in the integrin alpha6 gene in junctional epidermolysis bullosa with pyloric atresia. J Clin Invest 1997;99:2826-2831.
37. Vidal F, Aberdam D, Miquel C, Christiano AM, Pulkkinen L, Uitto J, et al. Integrin beta 4 mutations associated with junctional epidermolysis bullosa with pyloric atresia. Nat Genet 1995;10:229-234.
38. Ryan MC, Lee K, Miyashita Y, Carter WG. Targeted disrup- tion of the LAMA3 gene in mice reveals abnormalities in
survival and late stage differentiation of epithelial cells. J Cell Biol 1999;145:1309-1323.
39. Jackson IJ. Homologous pigmentation mutations in human, mouse and other model organisms. Hum Mol Genet 1997;6:
1613-1624.
40. Hearing VJ, Jiménez M. Analysis of mammalian pigmenta- tion at the molecular level. Pigment Cell Res 1989;2:75-85.
41. Fischer WH, Spiess J. Identification of a mammalian gluta- minyl cyclase converting glutaminyl into pyroglutamyl pep- tides. Proc Natl Acad Sci U S A 1987;84:3628-3632.
42. Yanagawa S, van Leeuwen F, Wodarz A, Klingensmith J, Nusse R. The dishevelled protein is modified by wingless signaling in Drosophila. Genes Dev 1995;9:1087-1097.
43. Goding CR. Mitf from neural crest to melanoma: signal tran- sduction and transcription in the melanocyte lineage. Genes Dev 2000;14:1712-1728.
44. Price ER, Fisher DE. Sensorineural deafness and pigmen- tation genes: melanocytes and the Mitf transcriptional net- work. Neuron 2001;30:15-18.