Identifying the Attributes of College Students' Fast Food Restaurant Selection and Satisfaction
Sunghyup Hyun
1, Kunsoon Park
2and Cindy Yoonjoung Heo
3†1
Dept. of Tourism and Convention, Pusan National University, Korea
2
Dept. of Hotel and Hospitality Management, Tougaloo College, USA
3
School of Hotel and Tourism Management, The Hong Kong Polytechnic University, Hong Kong
대학생들의 패스트 푸드 레스토랑 선택의 결정요인과 만족도 결정요인에 관한 연구
현성협1․박근순2․허윤정3†
1
부산대학교 관광컨벤션학과,
2미국 Tougaloo College 외식환대경영학과,
3홍콩 폴리텍 대학교 호텔관광대학
Abstract
College students represent a substantial market for fast food restaurant companies. In this sense, this research aims (1) to identify the attributes that influence college students' fast food restaurant selection, (2) to analyze how fast food restaurants perform with regards to those attributes using importance-performance analysis, and (3) to examine which attributes influence college students' satisfaction in a fast food restaurant context. Based on a literature review, 13 attributes that influence college students' fast food restaurant selection were derived. Then, using importance-performance analysis, it was found that among the 13 attributes, college students highly considered seven of them. Additionally, data analysis indicated that, currently, fast food companies perform well with regards to these seven attributes. More importantly, according to multiple regression analysis, among the seven attributes, value-related attributes (price, speed, location, and friendliness) were significantly related to college students' overall satisfaction.
Key words : Fast food restaurant selection, college students, satisfaction, importance-performance analysis.
†
Corresponding author : Cindy Yoonjoung Heo, Tel : +852- 2677-4613, E-mail : [email protected]
INTRODUCTION
Fast food restaurants are eating places in which customers order items and pay before eating and where food can be eaten on the premises or taken out (Austin et al 2005). Fast food has become an important component of the everyday diet, and the frequency of fast food consumption has increased drama- tically since the early 1970s (Paeratakul et al 2003). This increase in fast food consumption is likely to continue and fast food restaurants have experienced a continuous increase in sales over the past three decades (Qin & Prybutok 2008).
According to the Hoover's 2008 Restaurant Industry Analysis Report, in 2007 fast food industry sales reached $180 billion, and it is continuously growing at five percent annual growth rate, driven by patrons' continued emphasis on value and con-
venience. Fast food restaurants continue to focus on building their food and drink menus to include a wider variety of options, satisfying consumer interest in health and nutrition, and expanding their use of technology to enhance customer ordering and payment (NRA, 2007).
While many fast food restaurants are benefiting from the continuing desire to eat out, some have had difficulty in sus- taining sales growth due to the increase in the number of fast food restaurants competing for market share (Qin & Prybutok 2008). The college student market is large and getting larger.
Large numbers of fast food restaurants are conveniently lo- cated on or near campuses to attract students. They are easily found in student centers and in food courts in student unions, and tucked into other university buildings (Knutson BJ 2000).
Given the projected growth in the college market and the
desire to further increase sales, the fast food restaurant indus-
try is interested in identifying what are the key attributes that
attract college students to fast-food restaurants. Every com- pany knows that it costs far less to hold on to a customer than to acquire a new one (Coyles & Gokey 2005, Szmigin &
Bourne 1998). Customer retention has become a major area of consideration since it was recognized as an important contri- butor to profitability over the long term (Anderson et al 1994, Anderson & Sullivan 1993, Dick & Basu 1994, Fornell C 1992, Heskett JL 2002, Heskett et al 1997, Iniesta & Sanchez 2002).
Competition from nontraditional competitors, including su- permarkets, convenience stores, and specialty bakeries, has crated an intensely competitive environment (Taylor & Long- Tolbert 2002). Keeping customers and building loyalty amid increasing competition present daunting challenge for fast food restaurants (Meyers & Wallace 2003). College students have weaker economic power than adults, and their spending beha- vior/culture is different from normal consumer groups (Knut- son BJ 2000), therefore this study assumed that college stu- dents are different from normal consumers groups with re- gards to fast-food restaurant selection attributes. There is the potential huge benefits that might accrue to the fast food res- taurant by successfully converting college students from tran- sient customers into life-long brand-loyal customers (Alva M 1992). Cultivating relationships with college students is an in- vestment whose return may be realized for many years (Tay- lor & Long-Tolbert 2002). It is imperative for fast food restau- rants, therefore, to understand how college students perceive the service they provide and how these perceptions translate into college students satisfaction and retention.
What influences satisfaction and retention? An evaluation of consumer preferences in an ever-changing competitive en- vironment will provide valuable information on those attributes that most influence customer choices, However, there is little available research literature on the fast food preferences of consumers and especially of college students.
While Knutson BJ (2000)’s study proposed 13 attributes that influences college students’ fast-food restaurant selection, but failed to examine (1) how actual fast-food restaurants per- form with regards to those attributes and (2) how the attri- butes are related to satisfaction. Thus, the objectives of this study were (1) to identify the attributes that influence college students' fast food restaurant selection, (2) to analyze how fast-food restaurants perform with regards to those attributes, using importance-performance analysis, and (3) to examine which attribute influences college students' satisfaction in the
fast-food restaurant context.
LITERATURE REVIEW
1. Previous Studies Concerning General Restaurant Selection Attributes
Growing competition in the restaurant industry and the in- creasing importance of consumer patronage impose the need to satisfy consumers (Ladhari et al 2008). Customer satisfac- tion with restaurant services can directly affect restaurant pa- tronage (Dube et al 1994, Soriano DR 2002, Stevens et al 1995). Food quality, value for money, service, and location has been suggested as major factors that influence the customer satisfaction in the restaurant industry (Dulen 1999, Johns &
Pine 2002, Susskind & Chan 2000). Iglesias and Guillen (2004) stated that in order for restaurants to succeed as well as sur- vive in today’s highly competitive markets, they have to ana- lyze the factors that affect customer satisfaction. Success in the restaurant business depends on the deliver of superior qua- lity, value, and satisfaction to customers. By delivering high quality, value, and satisfaction the restaurant can save the cost of finding new customers and instead rely on repeat customers (Oh 2000). Researchers have shown that perceived quality, value, and satisfaction are good predictors of a customer’s willingness to return (Oh & Parks 1997, Rao & Monroe 1989, Zeithaml et al 1996).
Food quality is often the most important factor impacting the customers’ overall experience in the restaurant industry.
Taste (Kivela et al 1999, Koo et al 1999, Law et al 2008),
presentation (Kivela et al 1999, Namkung & Jang 2008, Raaj-
poot 2002), healthy options (Johns & Tyas 1996, Sulek & Hens-
ley 2004), temperature (Johns & Tyas 1996, Kivela et al 1999),
and freshness (Acebrón & Dopico 2000, Johns & Tyas 1996,
Kivela et al 1999) are attributes that have been suggested as
determinants of customer satisfaction in the restaurant indu-
stry. Service quality is a factor of critical importance in the
formation of satisfaction with restaurant services (Chow et al
2007, Dube et al 1994, Ladhari et al 2008, Namkung & Jang
2008, Soriano DR 2002, Yuksel & Yuksel 2002). The conve-
nience is an important attribute that has an impact on custo-
mers’ satisfaction (Lim & Ya 1997, Soriano DR 2002, Tzeng
et al 2002, Yuksel & Yuksel 2002). The physical environment
such as space, design, color, and music can influence on cus-
tomer satisfaction (Bitner 1992, Foster 1997, Garbarino & John-
son 1999, Kivela et al 2000, Kotler 1973, Soriano DR 2002,
Stevens et al 1995).
2. Fast Food Restaurant
Quick service at the counter or for take-out, low prices, and plain décor are features common to fast food restaurants. These outlets tend to specialize in a few menu items such as sand- wiches (mainly hamburgers), pizza, and chicken. The fast food restaurant industry is a strongly competitive one that faces a variety of operating challenges, including providing superior customer service while maximizing operating efficiency and controlling costs. Customers patronize fast food restaurants for a variety of reasons associated with lifestyles, demographics and economics. Location, service, consistency, food and price are among the key attributes customers consider when patro- nizing fast food restaurants. Consumers are attracted to these restaurants for a variety of reasons, including the quality and selection of menu items, convenience, value and the social aspects of eating out (NRA 2000).
Fast food is one of the world's fastest growing food types.
Fast foods are quick, reasonably priced, and readily available alternatives to home-cooked food (Goyal & Singh 2007). Many academic/practical definitions of fast food have been proposed for fast foods in the literature. A few are mentioned below:
․Fast food has been defined as a general term used for a limited menu of foods that lend themselves to produc- tion-line techniques; suppliers tend to specialize in pro- ducts such as hamburgers, pizzas, chicken, or sandwiches (Bender & Bender 1995).
․In Data Monitor's (2005) survey, the fast food market is defined as the sale of food and drinks for immediate consumption either on the premises or in designated eating areas shared with other foodservice operators, or for con- sumption elsewhere.
․As per "Wikipedia (2008), the free encyclopedia", fast food is the term given to food that can be prepared and served very quickly.
․According to the Merriam-Weber (1951) online dictio- nary fast food is "designed for ready availability, use, or consumption and with little consideration given to quality or significance."
A number of studies have attempted to identify the attri- butes that influence patrons' fast food restaurant selection.
Among the attributes that matter most are low price, speed of service, consistency in menu items, and convenient location
(Kara et al 1995, Muller CC 1997, Muller & Woods 1994).
Large numbers of patrons go to fast food restaurants because they are busy. In this sense, speed of service and convenient location should have important impacts on restaurant selec- tion. Other attributes that have been identified include quality of food, menu selection, brand name, children's preference, and cleanliness (Kasdan P 1996). It is commonly believed that fast foods are typically high in calories, fat, saturated fat, sugar, and salt (Goyal & Singh 2007). For this reason, re- cently, many people raised the importance of food quality im- provement and health issue with regards to fast food consump- tion (Brown et al 2000). Consequently, patrons look for fast food restaurant which has nutritious food menu, low fat food, and less calorie food. Also, patrons want to have food in a clean environment. In addition, Knutson BJ (2000) postulated that cleanliness, friendliness, and price strongly influence college students' choice of a fast food restaurant. Clean envi- ronment and friendly service provide favorable image of the fast food restaurant, therefore attract patrons.
METHODOLOGY
1. Sampling
The sample consisted of students enrolled in four under- graduate business classes, but was not limited to only business majors, at a state university in the Mideastern region of the United States. The questionnaire was administered to a total of 712 students in four classes at the end of the spring se- mester in 2009. The overall response rate was 53.1 percent (378 responses). Of the 378 questionnaire collected, 43 had a large percentage of missing values and were excluded. Thus, a total of 335 questionnaires were used in further analysis.
2. Questionnaire Development
Integrating the existing literature, this study proposes 13 attributes that influence patrons' fast-food restaurant selection:
(1) add-on coupons, (2) atmosphere, (3) cleanliness, (4) com- bination meals, (5) consistency in menu items, (6) discount coupons, (7) drive-through, (8) friendliness, (9) location, (10) menu variety, (11) price, (12) promotional menu items, and (13) speed (Kara et al 1995, Muller CC 1997, Muller & Woods 1994, Kasdan P 1996, Brown et al 2000, Knutson BJ 2000).
Questionnaire was designed based on these 13 attributes adapted from the previous literature.
The questionnaire consisted of three sections. The first sec-
tion included 13 attributes (e.g., cleanliness, price, speed). Stu- dents were asked to rate the importance of each of 13 attri- butes in their selection of a fast food restaurant. The choices ranged from slightly important (1) to extremely important (5).
In the second section students were asked to rate the fast food restaurant's performance on each of 13 attributes based on their experience of most recent visit to the fast food restaurant. The choice were "1", corresponding to "fair", and "5", correspon- ding to "excellent". These attributes were developed by Knut- son BJ (2000). The final section included questions that des- cribed the students' satisfaction with fast food restaurants and the students' demographic profile. Satisfaction was measured with "Please indicate your overall satisfaction level of your visit to the fast-food restaurant" with 5 response categories ranging from "Very Dissatisfied" to "Very Satisfied". Informa- tion on the frequency of their patronage of fast food restau- rants was also asked. Based on the earlier pilot test with 17 undergraduate students, minor adjustments were made before the finalized version was administered to the 712 undergra- duate students.
3. Data Analysis
The data were analyzed using SPSS software (version 14.0) through multiple stages. First, the descriptive statistics that provided a profile of students' demographic characteristics were run. Second, IPA was used to determine whether the perfor- mance of fast food restaurants exceeded the importance of each of 13 attributes, according to college students. Third, fac- tor analysis was conducted to create correlated variable com- posites from the original 13 attributes and to identify a smaller set of dimensions, or factors, which explained most of the va- riance between the items and the derived factor scores. Last, college students' satisfaction with fast food restaurants was predicted using multiple regression analysis, utilizing the mean scores of factors for importance and performance.
4. Importance Performance Analysis
Martilla and James (1977) proposed importance-performance analysis (IPA) as a tool to analyze how companies perform with regards to its attributes in evaluating firms' management strategies. In recent years, IPA has become a popular mana- gerial tool in identifying strengths and weaknesses of brands, products, services and retail establishments (Chapman RG 1993, Cheron et al 1989, Keyt et al 1994) in terms of two criteria
used by consumers in making a choice: the relative impor- tance of attributes, and consumers' evaluation of the offering in terms of those attributes. By using a central tendency (i.e., mean, median) or a rank-order measure, the attribute impor- tance and performance scores are ordered and classified into high/low categories; then by pairing these two sets of rankings, each attribute is placed into one of the four quadrants of the importance-performance grid. The vertical axis of the grid in- dicates the importance of the attributes from high to low and the horizontal axis represents their perceived performance from high to low (Chon et al 1991, Crompton & Duray 1985, Keyt et al 1994, Martilla & James 1977, Oh H 2001). The placements of attributes on this two-dimensional graph suggest the suitable strategy for each (Aigbedo & Parameswaran 2004, Keyt et al 1994, Nale et al 2000).
Interpretation of the IPA plot is straightforward (Ennew et al 1993, Nale et al 2000, Oh H 2001, O'Neill & Palmer 2004).
IPA generates four different suggestions based on importance- performance measures. Interpretations follow the combination of importance and performance scores for each attribute. The attributes that are important to customers' purchase decisions but on which the company does not perform well are classi- fied into Quadrant A, 'concentrate here'. This tells the com- pany that it needs to focus on improving its performance on these attributes. Quadrant B captures the attributes that cus- tomers think are important to their purchase decision and on which customers also perceive the company performs well.
What is needed here is to 'keep up the good work'. The attri- butes in Quadrant C indicate those rated low in both impor- tance and performance. Because of their low salience, these attributes are considered 'low priority' and hence require no additional resources. Quadrant D indicates that the attributes falling in this quadrant are relatively less important but the company performs well on them. This implies that 'possible overkill' has occurred. Perhaps the resources committed to these attributes should be channeled elsewhere (Keyt et al 1994, Matilla & James 1977, Nale et al 2000, Oh H 2001).
FINDINGS
1. Respondents’ Demographics
Table 1 shows the demographic characteristics of the stu-
dents. Overall, 184 (55.40%) of the students were female; 122
(36.70%) were freshmen; 98 (29.50%) were sophomores; 52
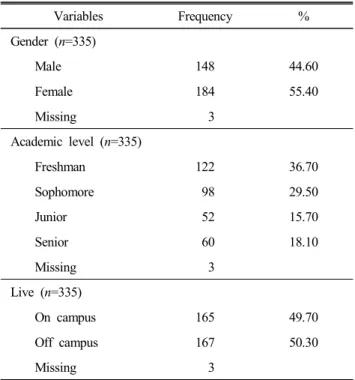
Table 1. Demographic characteristics of Students (n=335)
Variables Frequency %
Gender (n=335)
Male 148 44.60
Female 184 55.40
Missing 3
Academic level (n=335)
Freshman 122 36.70
Sophomore 98 29.50
Junior 52 15.70
Senior 60 18.10
Missing 3
Live (n=335)
On campus 165 49.70
Off campus 167 50.30
Missing 3
Note: The usable questionnaire consisted of 335 students out of 378 collected.
(15.70%) were juniors; and 60 (18.10%) were seniors. A total of 165 (49.70%) students lived on campus and 167 (50.30%) lived off campus. On average, students ate 6.64 times at a fast food restaurant per month and spent $5.72 each time.
2. Paired Samples T-Test
The paired samples t-test was conducted to see if the di- fference between the average scores for importance and per- formance for 13 attributes was statistically significant. The means for importance and performance for each of 13 attri- butes were compared. Significant differences (p<0.05) were found among the means with the exception of three attributes:
drive-through (p=0.97), friendliness (p=0.31), and location (p=
0.80). Four attributes had positive mean differences between importance and performance, indicating that fast food restau- rants’ performance was perceived by college students to be lower in these areas: cleanliness (0.66), speed (0.48), price (0.46) and friendliness (0.07).
3. Importance-Performance Analysis
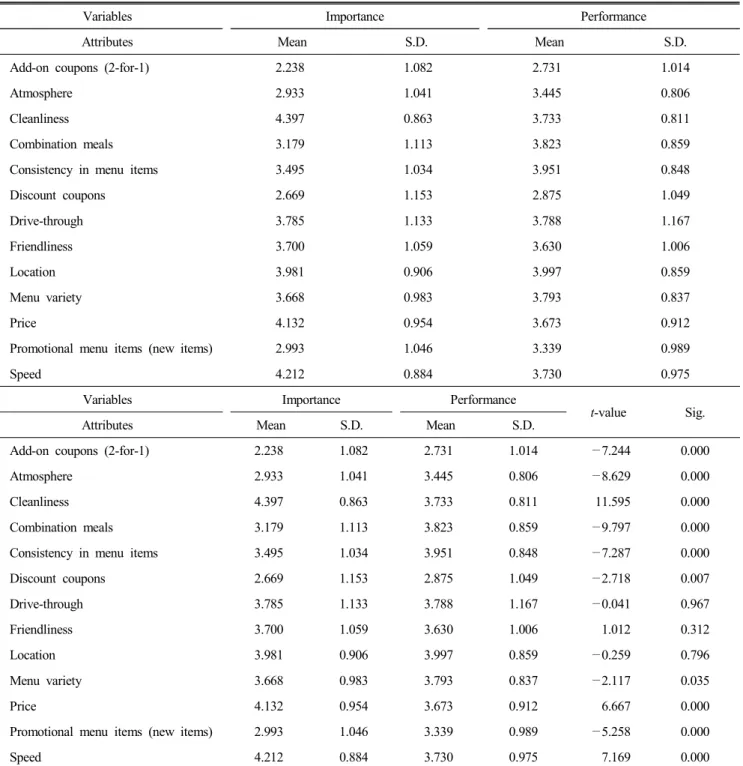
Table 2 shows the importance and performance scores for 13 attributes of college students' fast food restaurant choices.
The three most important attributes were: cleanliness (4.40), speed (4.21), and price (4.13). The three least important were:
add-on coupons (2.24), discount coupons (2.27), and atmo- sphere (2.93). The attributes on which fast food restaurants had the highest perceived performance ratings, however, were location (4.00), consistency in menu items (3.95), and com- bination meals (3.82). The three attributes with the lowest performance ratings were add-on coupons (2.73), discount coupons (2.88), and promotional menu items (3.34).
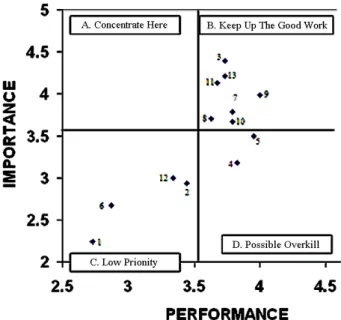
It is more illuminating, however, to view the results on the importance-performance grid. Figure 1 shows the importance- performance grid for the attributes constructed using the information obtained from the college students. The grand means for the importance and performance items have been used as the dividing lines for the horizontal and vertical dimensions.
Also, the coordinates of any given point in the grid derive from the mean values for importance and performance that correspond to that attribute. None of the 13 attributes was located in quadrant A, indicating high priority and high per- formance. The result for quadrant B suggests that the fast food restaurant is doing satisfactorily on seven attributes and needs to keep up the good work. These attributes are 3 (clean- liness), 7 (drive-through), 8 (friendliness), 9 (location), 10 (menu variety), 11 (price), and 13 (speed). Quadrant C is comprised of four attributes: 1 (add-on coupons), 2 (atmosphere), 6 (dis- count coupons), and 12 (promotional menu items). This area is the region of low priority. The college students suggest in quadrant D that the fast food restaurant is doing more than necessary with respect to two attributes: 4 (combination meals) and 5 (consistency in menu items). The positioning of the horizontal and vertical grid lines serve as a guide in relative terms (Aigbedo & Parameswaran 2004, Martilla & James 1977).
It seems reasonable to take special note of attributes that are very close to the boundaries of the dividing lines on the grid.
For example, even though attribute 8 (friendliness) and 11 (price) fall into quadrant B on the grid, they are sufficiently close enough to quadrant B’s boundary with quadrant A that they should also be considered to be attributes on which fast food restaurant should concentrate. This is especially essential for attribute 11 (price), which was ranked as being highly important in Table 2.
4. Factor Analysis of Performance
Factor analysis was conducted using principal axis factoring
with varimax rotation. Prior to conducting factor analysis, the
Table 2. Results of importance and performance scores for 13 attributes
Variables Importance Performance
Attributes Mean S.D. Mean S.D.
Add-on coupons (2-for-1) 2.238 1.082 2.731 1.014
Atmosphere 2.933 1.041 3.445 0.806
Cleanliness 4.397 0.863 3.733 0.811
Combination meals 3.179 1.113 3.823 0.859
Consistency in menu items 3.495 1.034 3.951 0.848
Discount coupons 2.669 1.153 2.875 1.049
Drive-through 3.785 1.133 3.788 1.167
Friendliness 3.700 1.059 3.630 1.006
Location 3.981 0.906 3.997 0.859
Menu variety 3.668 0.983 3.793 0.837
Price 4.132 0.954 3.673 0.912
Promotional menu items (new items) 2.993 1.046 3.339 0.989
Speed 4.212 0.884 3.730 0.975
Variables Importance Performance
t-value Sig.
Attributes Mean S.D. Mean S.D.
Add-on coupons (2-for-1) 2.238 1.082 2.731 1.014 —7.244 0.000
Atmosphere 2.933 1.041 3.445 0.806 —8.629 0.000
Cleanliness 4.397 0.863 3.733 0.811 11.595 0.000
Combination meals 3.179 1.113 3.823 0.859 —9.797 0.000
Consistency in menu items 3.495 1.034 3.951 0.848 —7.287 0.000
Discount coupons 2.669 1.153 2.875 1.049 —2.718 0.007
Drive-through 3.785 1.133 3.788 1.167 —0.041 0.967
Friendliness 3.700 1.059 3.630 1.006 1.012 0.312
Location 3.981 0.906 3.997 0.859 —0.259 0.796
Menu variety 3.668 0.983 3.793 0.837 —2.117 0.035
Price 4.132 0.954 3.673 0.912 6.667 0.000
Promotional menu items (new items) 2.993 1.046 3.339 0.989 —5.258 0.000
Speed 4.212 0.884 3.730 0.975 7.169 0.000
Note: Importance, 1 = slightly important and 5 = extremely important, Performance, 1 = fair and 5 = excellent.
Kaiser-Meyer-Olkin (KMO) measure of sampling adequacy and Bartlett's Test of Sphericity were performed to determine the appropriateness of factor analysis. The latent root value (eigen value) of 1.00 was used for factor inclusion and a fac- tor loading of 0.40 was used as the benchmark for including items in a factor (Hair et al 2006).
As shown in Table 3, four factors, explaining 61.895% of
the variance, were derived from the performance ascribed by
students to 13 fast food restaurant attributes. The Kaiser-Meyer-
Olkin measure of sampling adequacy indicated a practical
level of common variance (KMO = 0.80). The result of the
Bartlett's Test of Sphericity was 1,194.92 with a significant
Note: 1. add-on coupons; 2. atmosphere; 3. cleanliness; 4. com- bination meals; 5. consistency in menu items; 6. discount coupons; 7. drive-through; 8. friendliness; 9. location; 10.
menu variety; 11. price; 12. promotional menu items; 13.
speed
Fig. 1. Importance-performance analysis.
level of 0.001. This indicated that the factor analysis was appropriate. Value (Factor 1) accounted for 33.04% of the variance, with an eigen value of 4.30 and a reliability of 0.71.
This factor was loaded with four attributes. Menu (Factor 2) contained three items and explained 11.96% of the variance in the data, with an eigenvalue of 1.56 and a reliability of 0.73.
The three attributes associated with this factor dealt with menu.
Promotion (Factor 3) was loaded with three attributes. This factor accounted for 9.12% of the variance, with an eigen- value of 1.19 and a reliability of 0.69. Atmosphere (Factor 4) contained three attributes. This factor accounted for 7.78% of the variance, with an eigenvalue of 1.01 and a reliability of 0.70.
5. Multiple Regression Analysis of Performance and Satisfaction
Multiple regression analysis was performed to predict stu- dents' satisfaction with the performance of fast food restau- rants. The average score for overall satisfaction with fast food restaurants was calculated as students’ satisfaction with fast food restaurants, which was used as a dependent variable. Sum- mated scales for each factor in the factor analysis were created and used as the input data for a multiple regression analysis.
The mean scores of all variables in each factor were com- puted and used as summated scales and dependent variables (Hair et al 2006). The multiple regression model for perfor- mance was found to be significant as indicated by the overall F-statistics (p<0.05).
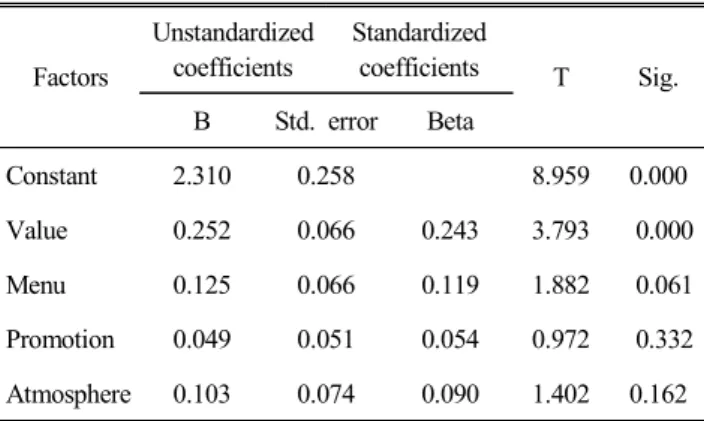
The results of multiple regression analysis on college stu- dent's satisfaction with the performance of fast food restau- rants are summarized in Table 4. Only Value (b=0.252; p=
0.000), among four identified performance factors, had a sig- nificant effect on college students' satisfaction with fast food restaurants and positive relationships. This factor is comprised of four attributes: speed, friendliness, location, and price. The other three dimensions - "menu", "promotion", and "atmosphere"
- were not significantly associated with college students’ satis- faction with fast food restaurants.
CONCLUSION AND DISCUSSIONS
There are many studies that address the attributes that in- fluence patrons’ fast food restaurant selection (Kara et al 1995, Kasdan P 1996, Knuston BJ 2000, Muller CC 1997, Muller &
Woods 1994). Low price, speed of service, consistency in menu items, and convenient location, food quality, brand name, child- ren’s preference, and cleanliness are the attributes identified in previous study. However, most of these studies are limited to the relationship between customer satisfaction and these attri- butes. As a result, how actual fast food restaurants perform with regard to those attributes has been ignored. Furthermore, very few studies have examined the fast food preferences of college students. Thus, this study contributes to the investiga- tion of the aforementioned issues.
The college students represent a substantial market for fast
food restaurants (Knutson BJ 2000). As shown in the descrip-
tive analysis, on average, college students eat 6.64 times at a
fast food restaurant per month and spent $ 5.72 each time. A
typical college student may spend approximately $455.8 on
fast food each academic year. Now extend these numbers to
the population of 17.5 million college students. The result
makes it clear that fast food restaurants should place more
emphasis on the college student market, especially since the
increasingly competitive environment in the fast food restau-
rant industry has forced it to find ways to continuously in-
crease its sales. Superior service can lead to loyal and satis-
fied customers whose continued patronage is essential to the
Table 3. Results of factor analysis-performance
Factors
Factor loading Factor 1
Value
Factor 2 Menu
Factor 3 Promotion
Factor 4
Atmosphere Communality
Speed 0.777 0.629
Friendliness 0.703 0.605
Location 0.681 0.535
Price 0.565 0.485
Combination meals 0.833 0.772
Consistency in menu items 0.792 0.674
Menu variety 0.627 0.506
Add-on coupons (2-for-1) 0.863 0.773
Discount coupons 0.845 0.734
Promotional menu items (new items) 0.502 0.499
Cleanliness 0.667 0.676
Atmosphere 0.605 0.656
Drive-through 0.587 0.554
Eigenvalue 4.295 1.555 1.186 1.011
Variance explained (%) 33.039 11.962 9.119 7.775
Cumulative variance 33.039 45.001 54.120 61.895
Reliability alpha 0.71 0.73 0.69 0.70 0.70
Note : Extraction method: principal component analysis.
Rotation method: VArimax with kaiser normalization.
KMO (Kaiser-Meyer-Olkin) measures of sampling adequacy: 0.800.
Bartlett's test of sphericity: p=0.00 (2=1194.922, df=78).
Table 4. Results of multiple regression analysis-perfor- mance and satisfaction
Factors
Unstandardized coefficients
Standardized
coefficients T Sig.
B Std. error Beta
Constant 2.310 0.258 8.959 0.000
Value 0.252 0.066 0.243 3.793 0.000
Menu 0.125 0.066 0.119 1.882 0.061
Promotion 0.049 0.051 0.054 0.972 0.332
Atmosphere 0.103 0.074 0.090 1.402 0.162
Note: R
2=0.163 (F-value=15.630).
growth of sales and profit for fast food restaurants. The re- sults from the associated analysis described here are useful in
helping these firms to prioritize their efforts toward meeting the needs of college students.
Based on the literature review, 13 attributes that influence patrons' behavior in the fast food segment were derived. Then, importance-performance analysis was conducted. Based on IPA, it was found that college students consider seven attri- butes when they select fast food restaurants: cleanliness, drive- through, friendliness, location, menu variety, price and speed.
This is similar to the findings of Knuston BJ (2000) except consistency in menu items instead of drive-through was highly influential on college students’ choice of fast food restaurants.
More importantly, it was found that, currently, fast food restau-
rants are performing well with regards to those seven attri-
butes. In this sense, we can say that currently, overall, fast food
restaurant companies' strategies are on the right tract to attract
college students. More importantly, as shown in the multiple
regression analysis, among those seven attributes, value related attributes (price, speed, location, and friendliness) are signifi- cantly related to college students' overall satisfaction.
More specifically, according to factor loadings in the ex- ploratory factor analysis, as a determining attribute, speed is the most important attribute, friendliness is the second, loca- tion is the third, and price is ranked fourth. Therefore, it was concluded that the most important reason why college stu- dents go to a fast food restaurant is 'because it serves food quickly'. Speed has historically been identified as the impor- tant driver in fast food restaurant's success (e.g. Pettijohn et al 1997) and this study confirmed the statement via impor- tance-performance analysis. In this sense, fast food restaurant companies should keep up the high speed, and try to shorten the waiting line in the restaurant. Developing a new payment method that can reduce time could be another solution. Also, data analysis results indicate that friendly service is an im- portant criterion for college students. Friendly service has long been discussed as a key determinant of patrons' satisfaction in the restaurant industry (e.g. Namkung & Jang 2008). In this sense, many fast food restaurants hire college students on campus, so they can provide friendly service to their collea- gues. This study recommends training of the employees, so they can provide more comfortable and friendly service to college students. Lastly, it was found that location should be an important factor for college students. Previous studies have suggested that convenient location is a key factor for the success of a restaurant (e.g. Soriano DR 2002). So, site selection should be emphasized when a fast food restaurant company opens a new branch. Opening a fast food restaurant branch on campus or in a mall near a campus also should be considered.
As explained earlier, those attributes (none) falling into quadrant A, “Concentrate Here”, of the IPA grid are important to college students, but the fast food restaurant’s performance levels for these attributes are fairly low. Attributes (cleanliness, drive-through, friendliness, location, menu variety, price and speed) found in quadrant B (Keep Up The Good Work) in- dicates that the fast food restaurant is doing well and needs to keep up the good work. Attributes (add-on coupons, atmo- sphere, discount coupons, and promotional menu items) that landed in quadrant C (Low Priority) might safely be forgotten because attributes in this area have low importance and low performance. Attributes (combination meals and consistency in menu items) that fell into quadrant D (Possible Overkill)
are of low importance and high performance and do not re- quire additional resources.
LIMITATION AND FUTURE RESEARCH
Despite its theoretical/practical implications, one limitation of this study need to be addressed. The data were collected from one college campus in the Mideastern region of the United States. It could be possible that the importance attached to the attributes might differ by region or culture. Therefore, for the future research, it is necessary to replicate the findings of this study using the data collected from other campuses in other regions/cultures to ascertain any possible bias.
국문초록
대학생 고객은 패스트 푸드 레스토랑의 중요한 잠재시장 이다. 이런 면에서, 이 연구는 세가지 연구목적을 제시하였 다: (1) 대학생들이 패스트 푸드 레스토랑을 선택할 때 고려 하는 요인들이 무엇인지 고찰한다, (2) 실제로 패스트 푸드 레스토랑들은 이 요인들에 대하여 얼마나 충실히 대학생 고 객의 요구에 부응하고 있는지 고찰한다, (3) 이러한 요인들 중에서 대학생들의 만족도에 유의하게 영향을 주는 요인들 은 무엇인지 고찰한다. 선행연구고찰을 통해 대학생들의 패 스트 푸드 레스토랑 선택에 영향을 주는 13개의 요인들을 도 출하였다: (1) 쿠폰, (2) 실내분위기, (3) 청결성, (4) 셋트메 뉴, (5) 메뉴의 일관성, (6) 할인쿠폰, (7) 자동차에서 주문하 는 시스템, (8) 친절함, (9) 위치, (10) 메뉴의 다양성, (11) 가 격, (12) 행사메뉴, (13) 음식준비시간. 설문지는 712명의 대 학생들을 대상으로 봄학기 마지막 주에 4개의 수업시간중에 배부되었다. IPA 분석을 통해서, 대학생들은 13개의 요인들 중에서 일곱 개의 요인들에 큰 비중을 두는 것으로 나타났 다: (1) 청결성, (2) 자동차에서 주문하는 시스템, (3) 친절함, (4) 위치, (5) 메뉴의 다양성, (6) 가격, (7) 음식준비시간. 또 한 현재 패스트 푸드 레스토랑들은 전체적으로 일곱 개의 요 인들에 대하여 고객의 요구에 잘 부응하고 있었고, 그 일곱 개의 요인들 중에 고객의 가치평가와 관련된 요인들 (가격, 음식 준비 속도, 위치, 친절한 서비스)은 대학생들의 만족도 와 유의하게 연관되어 있었다.
ACKNOWLEDGEMENT
This Work was supported for two years by Pusan National
University Research Grant.
REFERENCES
Acebrón LB, Dopico DC (2000) The importance of intrinsic and extrinsic cues to expected and experienced quality: An empirical application for beef. Food Quality and Prefe- rence 11: 229-238.
Aigbedo H, Parameswaran R (2004) Importance-performance analysis for improving quality of campus food service. The International J Quality & Reliability Management 21: 876- 896.
Alva M (1992) The halls of higher earning: College campuses are hot and fast feeders know it. Restaurant Business 91:
58-65.
Anderson EW, Fornell C, Lehmann DR (1994) Customer sa- tisfaction, market share, and profitability: Findings from Sweden. J Marketing 58: 53-66.
Anderson EW, Sullivan MW (1993) The antecedents and con- sequences of customer satisfaction for firms. Market Sci 12: 125-143.
Austin SB, Melly SJ, Sanchez BN, Patel A, Buka S, Gort- maker SL (2005) Clustering of fast-food restaurants around schools: A novel application of spatial statistics to the study of food environments. Am J of Public Health 95: 1575-1581.
Bender AE, Bender DA (1995) A dictionary of food and nu- trition, Oxford University Press, Oxford. p 142.
Bitner MJ (1992) Servicescapes: The impact of physical sur- roundings on customers and employees. J Marketing 56:
57-71.
Brown K, McIlveen H, Strugnell C (2000) Nutritional aware- ness and food preferences of young consumers. Nutrition
& Food Science 30: 230-235.
Chapman RG (1993) Brand performance comparatives. J Pro- duct & Brand Management 2: 42-50.
Cheron EJ, McTavish R, Perrien J (1989) Segmentation of bank commercial markets. International J Bank Marketing 7: 25-30.
Chon K, Weaver PA, Kim CY (1991) Marketing your com- munity: Image analysis in Norfolk. Cornell Hotel and Res- taurant Administration Quarterly 31: 31-37.
Chow IH, Lau VP, Lo TW, Sha Z, Yun H (2007). Service quality in restaurant operations in China: Decision- and ex- periential-oriented perspectives. International J Hospitality Management 26: 698-710.
Coyles S, Gokey TC (2005) Customer retention is not enough.
J Consum Mark 22: 101-105.
Crompton JL, Duray NA (1985) An investigation of the rela- tive efficacy of four alternative approaches to importance- performance analysis. J Academy of Marketing Science 13:
69-80.
Data Monitor (2005) Fast food in Asia-Pacific: Industry pro- file. Available online at from http://www.datamonitor.com/
store/Product/fast_food_in_asia_pacific?productid=8BF73D A9-4D25-46DB-B6FD-FA193C1C0172.
Dick AS, Basu K (1994) Customer loyalty: Towards an in- tegrated framework. J Academy of Marketing Science 22:
99-113.
Dube L, Renaghan LM, Miller JM (1994) Measuring custo- mer satisfaction for strategic management. Cornell Hotel Rest A 35: 39-48.
Dulen J (1999) Quality control. Restaurants and Institutions 109: 38-41.
Ennew CT, Reed GV, Binks MR (1993) Importance-perfor- mance analysis and the measurement of service quality.
Eur J Marketing 27: 59-70.
Fornell C (1992) A national customer satisfaction barometer:
The Swedish experience. J Marketing 56: 6-21.
Foster FJ (1997) Under pressure: Clean your foodservice equip- ment with care. Nation’s Restaurant News 31: 98-99.
Garbarino E, Johnson MS (1999) The different roles of satis- faction, trust, and commitment in customer relationships. J Marketing 63: 70-87.
Goyal A, Singh NP (2007) Consumer perception about fast food in India: An exploratory study. Brit Food J 109: 182- 195.
Hair JF, Black WC, Babin BJ, Anderson RE, Tatham RL (2006) Multivariate data analysis (6th ed.). Upper Saddle River, NJ: Prentice Hall. p 112-116.
Heskett JL (2002). Beyond customer loyalty. Managing Ser- vice Quality 12: 355-357.
Heskett JL, Sasser WE, Schlesinger LA (1997) The service profit chain. how leading companies link profit and growth to loyalty, satisfaction and value. New York: The Free Press. p 86.
Hoover (2008) Fast-food & quick-service restaurants industry overview. Available at online from http://www.hoovers.
com/hooversdirectories/industryIndex-1.html
Iglesias MP, Guillen, MJY (2004) Perceived quality and price:
their impact on the satisfaction of restaurant customers. In-
ternational J Contemporary Hospitality Management 16:
373-379.
Iniesta MA, Sanchez M (2002) Retail-consumer commitment and market segmentation. The International Review of Re- tail, Distribution and Consumer Research 12: 261-279.
Johns N, Pine R (2002) Consumer behaviour in the food ser- vice industry: A review. International J Hospitality Ma- nagement 21: 119-134.
Johns N, Tyas, P (1996) Investigating the perceived compo- nents of the meal experience, using perceptual gap metho- dology. Progress in Tourism and Hospitality Research 2:
15-26.
Kara A, Kaynak E, Kucukemiroglu O (1995) Marketing stra- tegies for fast-food restaurants: A customer view. Interna- tional J Contemporary Hospitality Management 7: 16-22.
Kasdan P (1996) Food for thought. American Demographics 18: 19-21.
Keyt JC, Yavas U, Riecken G (1994) Importance-performance analysis: A case study in restaurant positioning. Interna- tional J Retail & Distribution Management 22: 35-40.
Kivela J, Inbakaran R, Reece J (1999) Consumer research in the restaurant environment, Part 1: A conceptual model of dining satisfaction and return patronage. International J Contemporary Hospitality Management 11: 205-222.
Kivela J, Inbakaran R, Reece J (2000) Consumer research in the restaurant environment, Part 3: analysis, finding and con- clusions. International J Contemporary Hospitality Manage- ment 12: 13-30.
Knutson BJ (2000) College students and fast food - how stu- dents perceive restaurant brands. Cornell Hotel Rest A 41:
69-74.
Koo LC, Tao KC, Yeung JHC (1999) Preferential segmen- tation of restaurant attributes through conjoint analysis. In- ternational J Contemporary Hospitality Management 11:
242-250.
Kotler P (1973) Atmospherics as a marketing tool. J Retailing 49: 48-64.
Ladhari R, Brun I, Morales M (2008) Determinants of dining satisfaction and post-dining behavior intentions. Interna- tional Journal of Hospitality Management 27: 563-573.
Law R, To T, Goh C (2008) How do mainland Chinese tra- velers choose restaurants in Hong Kong? An exploratory study of individual visit scheme travelers and packaged travelers. International Journal of Hospitality Management
27: 346-354.
Lim ST, Ya ES (1997) Evaluation of restaurant service qua- lity in the Etaewon special tourist district of Seoul: Fo- reign tourist perspective. Asia Pacific Journal of Tourism Research 2: 51-63.
Martilla JA, James JC (1977) Importance-performance analy- sis. J Marketing 41: 77-79.
Merriam-Weber (1951) Fast food. Available at online from http://www.merriam-webster.com/dictionary/fast-food.
Meyers MS, Wallace S (2003) Factors influencing the pur- chasing of fast food meals. Proceeding of the Academy of Marketing Studies 8: 51-54.
Muller CC (1997) Redefining value: The hamburger price war.
Cornell Hotel and Restaurant Administration Quarterly 38:
62-73.
Muller CC, Woods RH (1994) An expanded restaurant typo- logy. Cornell Hotel Rest A 35: 30-36.
Nale RD, Rauch DA, Wathen SA, Barr PB (2000) An explo- ratory look at the use of importance-performance analysis as a curricular assessment tool in a school of business. Jour- nal of Workplace Learning: Employee Counseling Today 12: 139-145.
Namkung Y, Jang S (2008) Are highly satisfied restaurant cus- tomers really different? A quality perception perspective.
International J Contemporary Hospitality Management 20:
142-155.
National Restaurant Association (2007) Restaurant industry to continue to be major driver in nation’s economy through sales, employment growth in 2008. (http://www.restaurant.
org/pressroom/pressrelease.cfm?ID=1535).
National Restaurant Association (2000). Quick service restau- rant trends.
Oh H (2000). Diners' perceptions of quality, value, and satisfac- tion: A practical viewpoint. Cornell Hotel Rest A 41: 58-66.
Oh H (2001) Revisiting importance-performance analysis. Tou- rism Management 22: 617-627.
Oh H, Parks C (1997) Customer satisfaction and service qua- lity: A critical review of the literature and research impli- cations for the hospitality industry. Hospitality Research Journal 20: 35-64.
O'Neill MA, Palmer A (2004) Wine production and tourism:
Adding service to a perfect partnership. Cornell Hotel Rest A 45: 269-284.
Paeratakul S, Ferdinand DP, Champagne CM, Ryan DH, Bray
GA (2003) Fast-food consumption among US adults and children: Dietary and nutrient intake profile. J Am Diet Assoc 103: 1332-1338.
Pettijohn LS, Pettijohn CE, Luke RH (1997) An evaluation of fast food restaurant satisfaction: determinants, competitive comparisons and impact on future patronage. J Restaurant
& Foodservice Marketing 2: 3-20.
Qin H, Prybutok VR (2008) Determinants of customer-per- ceived service quality in fast-food restaurants and their re- lationship to customer satisfaction and behavioral intentions.
The Quality Management Journal 15: 35-50.
Raajpoot NA (2002). TANGSERV: A multiple item scale for measuring tangible quality in foodservice industry. J Food- service Business Research 5: 109-127.
Rao AR, Monroe KB (1989) The effect of price, brand name, and store name on buyers’ perceptions of product quality:
An integrative review. J Marketing Research 26: 351-357.
Soriano DR (2002) Customers' expectations factors in restau- rants: the situation in Spain. International J Quality and Reliability Management 19: 1055-1068.
Stevens P, Knutson B, Patton M (1995) DINESERV: A tool for measuring service quality in restaurants. Cornell Hotel and Restaurant Administration Quarterly 36: 56-60.
Sulek JM, Hensley RL (2004) The relative importance of food, atmosphere, and fairness of wait: The case of a full-service restaurant. Cornell Hotel Rest A 45: 235-248.
Susskind AM, Chan EK (2000) How restaurant features affect check averages a study of the Toronto restaurant market.
Cornell Hotel Rest A 41: 56-63.
Szmigin M, Bourne H (1998) Customer equity in relationship marketing. J Consum Mark 15: 544-557.
Taylor GA, Long-Tolbert S (2002) Coupon promotions in quick- service restaurants: preaching to the converted? Cornell Ho- tel Rest A 43: 41-47.
Tzeng GH, Teng MH, Chen JJ, Opricovic S (2002) Multicrite- ria selection for a restaurant location in Taipei. Internatio- nal J Hospitality Management 21: 171-187.
Yuksel A, Yuksel F (2002) Measurement of tourist satisfac- tion with restaurant services: a segment-based approach. J Vacation Marketing 9: 52-68.
Zeithaml VA, Berry LL, Parasuraman A (1996) The behavioral consequences of service quality. J Marketing 60: 31-46.
http://en. wikipedia.org/wiki/Fast_Food
접 수:
최종수정:
채 택:
2010년 3월 19일 2010년 10월 29일 2010년 11월 26일