http://e-nrp.org
Eating habits and eating behaviors by family dinner frequency in the lower-grade elementary school students
Seo Yeon Lee
1, Seong Ah Ha
1, Jung Sook Seo
2, Cheong Min Sohn
3, Hae Ryun Park
4and Kyung Won Kim
1§1Department of Food and Nutrition, Seoul Women's University, 621 Hwarangro, Nowon-gu, Seoul, 139-774, Korea
2Department of Food and Nutrition, Yeungnam University, Gyeongsan, 712-749, Korea
3Department of Food and Nutrition, Wonkwang University, Iksan, 570-749, Korea
4Department of Food and Nutrition, Myongji University, Yongin, 120-728, Korea
BACKGROUND/OBJECTIVES: Recently, there has been an increased interest in the importance of family meals on children’s health and nutrition. This study aims to examine if the eating habits and eating behaviors of children are different according to the frequency of family dinners.
SUBJECTS/METHODS: The subjects were third-grade students from 70 elementary schools in 17 cities nationwide. A two-stage stratified cluster sampling was employed. The survey questionnaire was composed of items that examined the general characteristics, family meals, eating habits, eating behaviors, and environmental influence on children’s eating. The subjects responded to a self-reported questionnaire. Excluding the incomplete responses, the data (n = 3,435) were analyzed using χ
2-test or t-test.
RESULTS: The group that had more frequent family dinners (≥ 5 days/week, 63.4%), compared to those that had less (≤
4 days/week, 36.6%), showed better eating habits, such as eating meals regularly, performing desirable behaviors during meals, having breakfast frequently, having breakfast with family members (P < 0.001), and not eating only what he or she likes (P
< 0.05). Those who had more frequent family dinners also consumed healthy foods with more frequency, including protein foods, dairy products, grains, vegetables, seaweeds (P < 0.001), and fruits (P < 0.01). However, unhealthy eating behaviors (e.g., eating fatty foods, salty foods, sweets, etc.) were not significantly different by the frequency of family dinners.
CONCLUSIONS: Having dinner frequently with family members was associated with more desirable eating habits and with healthy eating behaviors in young children. Thus nutrition education might be planned to promote family dinners, by emphasizing the benefits of having family meals on children’s health and nutrition and making more opportunities for family meals.
Nutrition Research and Practice 2014;8(6):679-687; doi:10.4162/nrp.2014.8.6.679; pISSN 1976-1457 eISSN 2005-6168
Keywords: school-aged children, family meals, eating habits, eating behaviors
INTRODUCTION
10)Adequate nutrition during childhood is important to physical growth and optimal health. Many studies, however, have reported inadequate nutrient intakes and poor eating habits of school- aged children [1-3]. According to the results of a recent Korea National Health and Nutrition Examination Survey (KNHANES), the diets of children aged 6-11 were below the recommended level for calcium (consuming 65% of Recommended Nutrient Intakes) and potassium (75% of Adequate Intakes), while the mean intakes of protein and sodium were more than two-folds of recommended level [4]. Only one-third of children aged 6-11 practiced two or more of four healthy dietary behaviors (mode- rating fat intake, reducing sodium intake, consuming sufficient fruits and vegetables, reading nutrition facts) that are suggested in Health Plan 2020 [4,5]. Poor eating habits of school-aged children include not eating a variety of foods, eating snacks
that are high in fat or sugar, frequent consumption of instant foods and skipping breakfast [1-3].
An increase in working mothers, economic growth and lifestyle changes have altered dietary patterns. Sung et al. [6]
reported that the percentage of children taking part in family meals had decreased and children who eat alone had increased.
Children eating alone, compared with those eating with family members, had meals with fewer side dishes and were less satisfied.
Family meals are defined as meals eaten with all or most family members [7,8]. Family meals serve several purposes: time for communication and interaction with family members, observation and opportunity to learn from parents, and time to eat together, resulting in the possibility to build family bonds and receive emotional and psychological support. The evening meal is important as it provides a significant portion of nutrient intakes compared to other meals and snacks [9]. A study reported that elementary school students more commonly
This study was supported by a research grant (13162MFDS160) from Ministry of Food and Drug Safety in 2013.
§Corresponding Author: Kyung Won Kim, Tel. 82-2-970-5647, Fax. 82-2-976-4049, Email. [email protected] Recevied: June 12, 2014, Revised: July 28, 2014, Accepted: July 30, 2014
This is an Open Access article distributed under the terms of the Creative Commons Attribution Non-Commercial License (http://creativecommons.org/licenses/by-nc/3.0/) which permits unrestricted non-commercial use, distribution, and reproduction in any medium, provided the original work is properly cited.
shared a family meal at dinner than other meals [10].
Fruh et al. [11] reported many benefits of family meals on children and adolescents, including healthy food selection, academic success, having positive values and fewer behavioral issues (e.g., school problems, substance abuse and excessive weight loss). Several studies suggested that family meals help to improve dietary intakes and eating behaviors of children or adolescents [7,12-16]. Family meals are known to have a positive effect on emotional, psychological and physical health. A study with 5
thand 6
thgraders found that children having more frequent family meals showed more positive self-rated mental health as well as physical health [17]. Children or adolescents having family meals more frequently indicated greater satisfaction with life and positive psychological feelings [10,12]. Kim et al.
[18] reported that family meals and the environment for meals relieved psychological problems of children, especially aggression and emotional instability, and contribute to the emotional and social development of children. Therefore, nutrition education or nutrition service for children should encourage family meals and a supportive environment for meals in addition to providing nutrition information.
The importance of family meals has recently received attention, and studies on family meals have been done in the past several years [10,12,13,17,19]. Most of these studies, however, have been done regionally and focused on upper-grade elementary school students or adolescents, and mainly examined the status of family meals, perceptions and attitudes toward family meals.
This study was conducted with young children (third-graders) from a nationwide sample and investigated if dietary life characteristics such as eating habits and eating behaviors of third graders were different by the frequency of family dinners.
SUBJECTS AND METHODS Study Design
This study was a part of large-scale survey to examine dietary life, physical activity and related factors among school-aged children and adolescents. This study employed a cross-sectional survey design. A two-stage stratified cluster sampling design was used, and 70 elementary schools were chosen from a list of schools in 17 cities nationwide, taking into account the number of elementary schools in 17 cities and provinces.
Another list of 70 schools from 17 cities was complied, and these schools were asked to participate in case selected schools from sampling were unwilling to participate. This study was approved by the Institutional Review Board of Seoul Women’s University (IRB-2013A-1).
Subjects
Subjects were third-graders from 70 elementary schools sampled from a list of schools in 17 cities. After explaining the study to teachers (principals, class teachers or nutrition teachers), third graders of 3 to 4 classes from each school were asked to participate in the study. Parents or guardians were provided with information and gave written informed consent for their child’s study participation. Students were informed that they can withdraw from the study if unwilling to respond to the survey questionnaire. Self-reporting data were collected from
4,549 third-graders in 2013. Excluding the data of incomplete responses on family meals or other study variables, data from 3,435 third-graders out of 4,549 data were used for statistical analysis. The completion rate was 75.5%.
Measurements
A draft of the survey questionnaire was developed using literature reviews on dietary life, eating habits and eating behaviors of school-aged children; and then reviewed by 3 nutrition professors. After revision of the draft of the ques- tionnaire, it was pilot-tested with 20 elementary school students to check understanding and the wording or sentences. The final questionnaire was developed and revised based on comments from nutrition experts and results of the pilot testing.
The survey questionnaire was composed of items examining general characteristics, family meals, eating habits, eating behaviors and environmental influence on children’s eating.
General characteristics included age, gender, weight, height, residential area (province), perceived stress in daily life, and the person who prepares the meal. Body mass index was calculated based on self-reported weight and height. Eating habits included the variety of foods, regular meals, size of meals, frequency of having breakfast, eating out, snacks (frequency, snack foods), behavior during meals, unbalanced diet and types of disliked foods [20-23]. Eating behaviors covered 12 items, with six items related to consumption of food groups, including grains, protein foods, vegetables, fruits, dairy products and seaweeds; six items on unhealthy eating behaviors such as eating fatty foods, sweets, soft drinks, salty foods, processed or instant foods, and eating snacks at night [22-24]. Each eating behavior item was assessed by frequency on 7-point scale from
‘never’ to ‘3 or more times a day’, and then converted to number of consumption frequency of each food group per day for statistical analysis. Items on environmental influences included dietary life education, person who influences eating habits of subjects, and influence of TV advertisement on food selection [20]. On family meals, frequency of having breakfast and dinner with family members in the past week was asked [25]. The frequency of having dinner with family members was used as the variable to categorize subjects by family meals, as family meals were more often at dinner [10]. Family dinner was considered an important activity, as it is a time for interaction and communication among family members [16].
Data analysis
Data of 3,435 third-graders were analyzed using SPSS (PASW Statistics 18.0; SPSS Inc., Chicago, IL, USA). Descriptive statistics, such as frequency, mean and standard deviation, were calculated.
Based on items used in the Korea National Health and Nutrition
Examination Survey (KNHANES) and the distribution of subjects
on frequency of family dinners in this study, subjects were
categorized into two groups; more frequent family dinners
(dinner with family members 5 or more times per week) and
less frequent family dinner (dinner with family members 4 or
fewer times per week). Chi-square test or t-test was used to
determine significant differences between groups in study
variables of eating habits, eating behaviors and environmental
influence. Statistical significance was set at alpha = 0.05.
Variables Total (n = 3,435)
Family dinner frequency
≦ 4 days/week (n = 1,256)
≥ 5 days/week
(n = 2,179) t or χ24)
Age (yrs) 8.8 ± 0.61) 8.8 ± 0.6 8.8 ± 0.6 0.2
Height (cm) 133.6 ± 6.2 133.6 ± 6.3 133.6 ± 6.2 -0.1
Weight (kg) 31.3 ± 6.7 31.4 ± 6.7 31.3 ± 6.7 0.1
BMI (kg/m2) 17.4 ± 2.8 17.5 ± 2.8 17.4 ± 2.8 0.2
Gender
Boys 1,664 (48.4)2) 614 (48.9) 1,050 (48.2) 0.2
Girls 1,771 (51.6) 642 (51.1) 1,129 (51.8)
Total 3,435 (100.0) 1,256 (100.0) 2,179 (100.0)
Residential area
Seoul 606 (17.6) 260 (20.7) 346 (15.9) 36.8***
Gyeonggi·Incheon 1,111 (32.2) 449 (35.7) 662 (30.4)
Chungcheong-do 257 (7.5) 82 (6.5) 175 (8.0)
Jeolla-do 273 (7.9) 78 (6.2) 195 (8.9)
Gyeongsang-do 1,087 (31.6) 359 (28.6) 728 (33.4)
Others (Gangwon-do, Jeju-do) 101 (2.9) 28 (2.2) 73 (3.4)
Total 3,425 (100.0)3) 1,256 (100.0) 2,179 (100.0)
Perceived stress from daily life
Very severe 125 (3.7) 52 (4.2) 73 (3.4) 21.4***
Severe 353 (10.5) 145 (11.8) 208 (9.7)
Average 1,740 (51.6) 658 (53.6) 1,082 (50.5)
A few 835 (24.8) 289 (23.5) 546 (25.5)
None 319 (9.5) 84 (6.8) 235 (11.0)
Total 3,372 (100.0)3) 1,228 (100.0) 2,144 (100.0)
The person who most often prepares the meal
Mother 2,897 (87.5) 1,044 (85.7) 1,853 (88.5) 10.7
Father 83 (2.5) 27 (2.2) 56 (2.7)
Grandmother 273 (8.2) 118 (9.7) 155 (7.4)
Housemaid 19 (0.6) 10 (0.8) 9 (0.4)
Myself 20 (0.6) 10 (0.8) 10 (0.5)
Others (aunt, etc.) 19 (0.6) 9 (0.7) 10 (0.5)
Total 3,311 (100.0)3) 1,218 (100.0) 2,093 (100.0)
***P< 0.001
1)Mean ± SD
2)n (%)
3)Numbers less than 3,435 in total of each variable are unanswered responses.
4)by t-test or χ2-test
Table 1. General characteristics of subjects by family dinner frequency
RESULTS
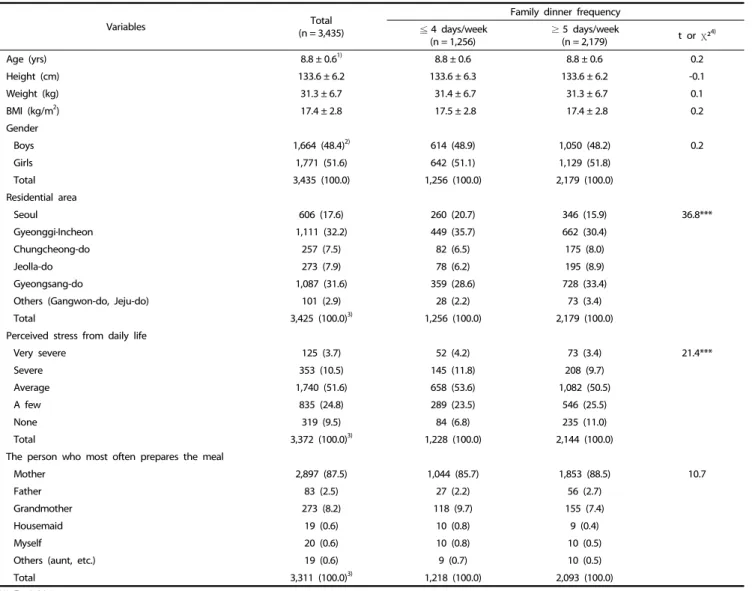
General characteristics of subjects by family dinner frequency General characteristics of 3,435 subjects are shown in Table 1. The mean age was 8.8 years and 48.4% were boys. The mean height and weight was 133.6 cm and 31.3 kg, respectively, and mean BMI was 17.4. Subjects who had dinner with family members 5 or more days per week (group having more frequent family dinner) was 63.4%, and those who had dinner with family members 4 or fewer days per week (group having less frequent family dinner) was 36.6%. There was no statistically significant difference in gender, mean height, weight and BMI between the two groups.
The majority of subjects resided in Gyeonggi∙Incheon (32.2%), Gyeongsang-do (31.6%) and Seoul (17.6%). Family dinner frequency was significantly different by residential area (P <
0.001). In the group with less frequent family dinners, 56.4%
resided in Seoul or Gyeonggi∙Incheon, and subjects from Seoul or Gyeonggi∙Incheon were 46.3% in the group with more frequent family dinners. Approximately half (51.6%) of subjects perceived stress in daily life as ‘average.’ Those who perceived less stress in life as ‘a few’ or ‘none’ was 30.3% in the group with less frequent family dinners, compared to 36.5% in the group with more frequent family dinners (P < 0.001). Most subjects (87.5%) reported that the mother was the person who most often prepares the meal, and this was not significantly different by family dinner frequency.
Eating habits of subjects by family dinner frequency
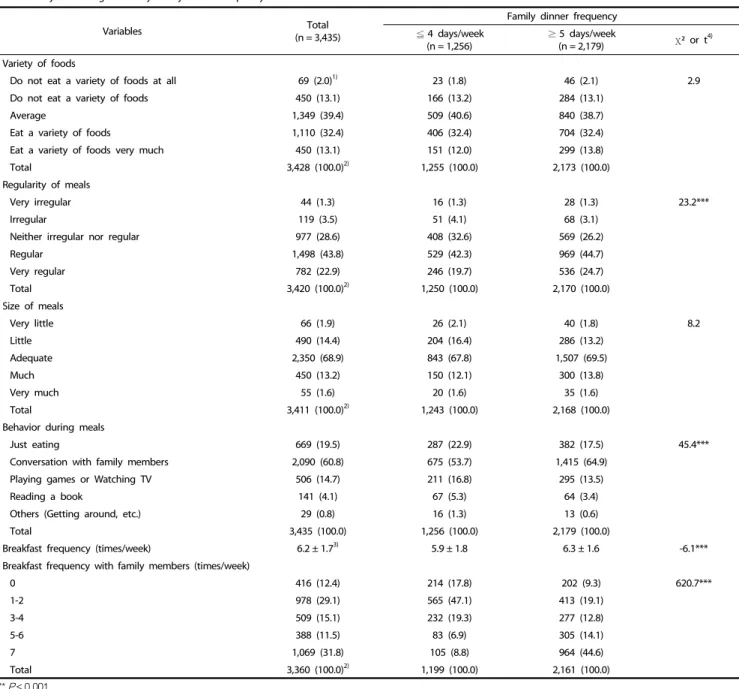
The results of subjects’ eating habits are shown in Table 2.
Two-thirds (66.7%) had meals ‘regularly/very regularly’ and
68.9% ate an adequate size meal. Compared to these, 45.5%
Variables Total (n = 3,435)
Family dinner frequency
≦ 4 days/week
(n = 1,256) ≥ 5 days/week
(n = 2,179) χ2 or t4) Variety of foods
Do not eat a variety of foods at all 69 (2.0)1) 23 (1.8) 46 (2.1) 2.9
Do not eat a variety of foods 450 (13.1) 166 (13.2) 284 (13.1)
Average 1,349 (39.4) 509 (40.6) 840 (38.7)
Eat a variety of foods 1,110 (32.4) 406 (32.4) 704 (32.4)
Eat a variety of foods very much 450 (13.1) 151 (12.0) 299 (13.8)
Total 3,428 (100.0)2) 1,255 (100.0) 2,173 (100.0)
Regularity of meals
Very irregular 44 (1.3) 16 (1.3) 28 (1.3) 23.2***
Irregular 119 (3.5) 51 (4.1) 68 (3.1)
Neither irregular nor regular 977 (28.6) 408 (32.6) 569 (26.2)
Regular 1,498 (43.8) 529 (42.3) 969 (44.7)
Very regular 782 (22.9) 246 (19.7) 536 (24.7)
Total 3,420 (100.0)2) 1,250 (100.0) 2,170 (100.0)
Size of meals
Very little 66 (1.9) 26 (2.1) 40 (1.8) 8.2
Little 490 (14.4) 204 (16.4) 286 (13.2)
Adequate 2,350 (68.9) 843 (67.8) 1,507 (69.5)
Much 450 (13.2) 150 (12.1) 300 (13.8)
Very much 55 (1.6) 20 (1.6) 35 (1.6)
Total 3,411 (100.0)2) 1,243 (100.0) 2,168 (100.0)
Behavior during meals
Just eating 669 (19.5) 287 (22.9) 382 (17.5) 45.4***
Conversation with family members 2,090 (60.8) 675 (53.7) 1,415 (64.9)
Playing games or Watching TV 506 (14.7) 211 (16.8) 295 (13.5)
Reading a book 141 (4.1) 67 (5.3) 64 (3.4)
Others (Getting around, etc.) 29 (0.8) 16 (1.3) 13 (0.6)
Total 3,435 (100.0) 1,256 (100.0) 2,179 (100.0)
Breakfast frequency (times/week) 6.2 ± 1.73) 5.9 ± 1.8 6.3 ± 1.6 -6.1***
Breakfast frequency with family members (times/week)
0 416 (12.4) 214 (17.8) 202 (9.3) 620.7***
1-2 978 (29.1) 565 (47.1) 413 (19.1)
3-4 509 (15.1) 232 (19.3) 277 (12.8)
5-6 388 (11.5) 83 (6.9) 305 (14.1)
7 1,069 (31.8) 105 (8.8) 964 (44.6)
Total 3,360 (100.0)2) 1,199 (100.0) 2,161 (100.0)
***P< 0.001
1)n (%)
2)Numbers less than 3,435 in total of each variable are unanswered responses.
3)Mean ± SD
4)by χ2-test or by t-test
Table 2. Subjects' eating habits by family dinner frequency
of subjects responded that they ‘eat a variety of foods/eat a variety of foods very much’ (Table 2). Eating a variety of foods and size of meals were not statistically different by family dinner frequency. However, the group with more frequent family dinners showed a higher percentage of subjects having
‘regular/very regular meals’ compared to the group having less frequent family dinners (69.4% vs. 62.0%, respectively; P < 0.001).
On behavior during meals, ‘conversation with family members’
was the most common behavior (60.8%), followed by ‘just eating’ (19.5%), ‘playing a game or watching TV’ (14.7%) and reading a book (4.1%). Those who had conversation with family
members during meals were higher in the group with more
frequent family dinners (64.9%) than the group with less
frequent family dinners (53.7%; P < 0.001). Subjects reported
that they had breakfast 6.2 times per week on average. The
group with more frequent family dinners had breakfast 6.3
times per week on average, and the other group had breakfast
5.9 times per week (P < 0.001). On breakfast frequency with
family members, 41.5% reported having breakfast with family
members 2 or fewer days per week. The group with more
frequent family dinners had breakfast more than 5 times per
week with family members at a higher rate than the group with
Variables Total (n = 3,435)
Family dinner frequency
≦ 4 days/week
(n = 1,256) ≥ 5 days/week
(n = 2,179) χ2 or t4) Unbalanced diet
Yes 1,595 (46.4)2) 602 (48.7) 983 (45.1) 4.2*
No 1,840 (53.6) 644 (51.3) 1,196 (54.9)
Total 3,435 (100.0) 1,256 (100.0) 2,179 (100.0)
Foods disliked by subjects1)
Grains and starches 111 (2.9) 41 (2.8) 70 (2.9) 12.7
Meat 153 (4.0) 62 (4.2) 91 (3.8)
Fish 354 (9.2) 154 (10.5) 200 (8.4)
Eggs 156 (4.0) 64 (4.4) 92 (3.8)
Beans 935 (24.2) 369 (25.1) 566 (23.7)
Vegetables 1,052 (27.2) 395 (26.9) 657 (27.5)
Fruits 114 (3.0) 38 (2.6) 76 (3.2)
Dairy products 380 (9.8) 136 (9.3) 244 (10.2)
Seaweeds 431 (11.2) 143 (9.7) 288 (12.0)
Others (Kimchi, etc.) 175 (4.5) 68 (4.6) 107 (4.5)
Total 3,861 (100.0) 1,470 (100.0) 2,391 (100.0)
Frequency of eating out (times/week) 1.3 ± 1.03) 1.3 ± 1.0 1.3 ± 1.1 -0.8
Frequency of eating snacks (times/day) 1.5 ± 0.9 1.5 ± 0.9 1.5 ± 0.9 0.4
Foods for snacks1)
Cookie, Confectionery, Candy, Chocolate, Jelly 1,612 (17.0) 593 (17.4) 1,019 (16.8) 11.5
Ramen, Instant cup ramen 365 (3.9) 139 (4.1) 226 (3.7)
Milk, Yogurt 1,674 (17.7) 573 (16.8) 1,101 (18.2)
Fruit, Fruit juice 1,728 (18.3) 607 (17.8) 1,121 (18.5)
Bread, Cake, Donut, Sandwich 1,139 (12.0) 406 (11.9) 733 (12.1)
Fatty foods (Fried, Burger, Pizza) 173 (1.8) 59 (1.7) 114 (1.9)
Flour based food (Gimbap, Tteokbokki, etc.) 638 (6.7) 225 (6.6) 413 (6.8)
Carbonated drink, Sports drink 186 (2.0) 82 (2.4) 104 (1.7)
Ice cream, Frozen desserts 1,340 (14.2) 505 (14.8) 835 (13.8)
Others (Rice cake, Sweet potato, etc.) 600 (6.3) 212 (6.2) 388 (6.4)
Total 9,455 (100.0) 3,401 (100.0) 6,054 (100.0)
*P< 0.05
1)Multiple response
2)n (%)
3)Mean ± SD
4)by χ2-test or t-test
Table 3. Subjects’ eating habits regarding food preference, snacks, eating out by family dinner frequency
less frequent family dinners (58.7% vs. 15.7%; P < 0.001).
Subjects’ eating habits regarding food preference, snacks and eating out by family dinner frequency
Less than half of subjects (46.4%) had an unbalanced diet, eating only what they liked (Table 3). The percentage of subjects with unbalanced diets was higher in the group with less frequent family dinners (48.7% vs. 45.1%; P < 0.05). Foods disliked by subjects were primarily vegetables (27.2%), beans (24.2%) and seaweeds (11.2%). Most frequently disliked foods were vegetables (26.9%), beans (25.1%) and fish (10.5%) in the group with less frequent family dinners; and vegetables (27.5%), beans (23.7%) and seaweeds (12.0%) in the group with more frequent family dinners. Foods that subjects disliked were not significantly different by family dinner frequency.
The mean frequency of snacking and eating out was 1.5 times per day and 1.3 times per week, respectively. The frequency
of snacking and eating out was not statistically different by family dinner frequency. Most commonly mentioned snacks were ‘fruits/fruit juices’ (18.3%), ‘milk/yogurt’ (17.7%), ‘cookies/
confectionery/candy/chocolate/jelly’ (17.0%) and ‘ice cream/
frozen desserts’ (14.2%). The percentage of subjects mentioning healthy snacks (e.g., fruits/fruit juices, milk/yogurt) was slightly higher in the group with more frequent family dinners (36.7%
vs. 34.6%). However, this difference did not reach statistical significance.
Eating behaviors of subjects by family dinner frequency
Results on consumption frequency of food groups and
unhealthy eating behaviors (e.g., eating fatty foods, sweets, salty
foods) are presented in Table 4. Subjects consumed ‘grains and
starch foods’ and ‘vegetable side dishes at meals’ 1.6 times per
day on average. Mean consumption frequency was 1.3 times
per day for ‘eating fruits’, 1.2 times per day for ‘eating one or
Variables Total (n = 3,435)
Family dinner frequency
≦ 4 days/week
(n = 1,256) ≥ 5 days/week
(n = 2,179) t3)
1. Eat grains and starches1) 1.6 ± 1.22) 1.5 ± 1.2 1.7 ± 1.2 -5.3***
2. Eat one or more foods in meat, fish, eggs, beans at meals 1.2 ± 1.0 1.0 ± 0.9 1.2 ± 1.0 -6.9***
3. Eat vegetable side dishes at meals 1.6 ± 1.1 1.4 ± 1.1 1.6 ± 1.1 -4.6***
4. Eat fruits 1.3 ± 1.0 1.2 ± 1.0 1.3 ± 1.0 -2.7**
5. Eat dairy products (e.g., milk, yogurt, cheese) 1.2 ± 0.9 1.1 ± 0.9 1.2 ± 0.9 -5.8***
6. Eat seaweeds 0.6 ± 0.7 0.6 ± 0.7 0.7 ± 0.8 -3.6***
7. Eat fatty foods 0.2 ± 0.3 0.2 ± 0.3 0.2 ± 0.3 -1.6
8. Eat sweets 0.5 ± 0.6 0.5 ± 0.5 0.5 ± 0.6 -0.3
9. Have soft drinks 0.2 ± 0.4 0.2 ± 0.4 0.2 ± 0.4 0.3
10. Eat spicy and salty foods 0.3 ± 0.4 0.3 ± 0.4 0.3 ± 0.4 -0.1
11. Eat processed foods or instant foods 0.3 ± 0.4 0.3 ± 0.4 0.3 ± 0.4 -0.7
12. Eat snacks late at night 0.2 ± 0.4 0.2 ± 0.4 0.2 ± 0.4 -0.4
**P< 0.01, ***P< 0.001
1)Each item was measured by 7-point scales from 1 (almost not eating) - 7 (more than 3 times/day) and was analyzed by converting as the number of consumption (times a day).
2)Mean ± SD, times/day
3)by t-test
Table 4. Eating behaviors of subjects by family dinner frequency
Variables Total
(n = 3,435)
Family dinner frequency
≦ 4 days/week
(n = 1,256) ≥ 5 days/week
(n = 2,179) χ2 or t3) Dietary education experience during the last year
No 1,437 (42.4)1) 535 (43.1) 902 (42.0) 0.4
Yes 1,952 (57.6) 706 (56.9) 1,246 (58.0)
Total 3,389 (100.0)2) 1,241 (100.0) 2,148 (100.0)
Most influential person on eating habits
Parents 3,120 (92.0) 1,119 (90.3) 2,001 (93.0) 9.0*
Teacher 172 (5.1) 73 (5.9) 99 (4.6)
Friend 12 (0.4) 7 (0.6) 5 (0.2)
Others (Grandmother, etc.) 87 (2.6) 40 (3.2) 47 (2.2)
Total 3,391 (100.0)2) 1,239 (100.0) 2,152 (100.0)
Ways of obtaining nutrition information
TV·Radio 512 (15.7) 192 (15.9) 320 (15.6) 4.0
Newspaper·Magazine 41 (1.3) 15 (1.2) 26 (1.3)
Internet 235 (7.2) 95 (7.9) 140 (6.8)
Book·Cookbook 370 (11.4) 141 (11.7) 229 (11.2)
Teacher·Nutrition teacher 304 (9.3) 106 (8.8) 198 (9.7)
Parents 1,685 (51.7) 611 (50.6) 1,074 (52.4)
Friend 28 (0.9) 13 (1.1) 15 (0.7)
Social network service 29 (0.9) 12 (1.0) 17 (0.8)
Others (school newsletter, etc.) 54 (1.7) 22 (1.8) 32 (1.6)
Total 3,258 (100.0)2) 1,207 (100.0) 2,051 (100.0)
Influence of TV advertisement on food selection
Not Influenced at all 539 (15.7) 185 (14.7) 354 (16.3) 2.5
Not influenced 570 (16.6) 218 (17.4) 352 (16.2)
Average 1,748 (51.0) 650 (51.8) 1,098 (50.6)
Influenced 464 (13.5) 164 (13.1) 300 (13.8)
Influenced very much 106 (3.1) 38 (3.0) 68 (3.1)
Total 3,427 (100.0)2) 1,255 (100.0) 2,172 (100.0)
*P< 0.05
1)n (%)
2)Numbers less than 3,435 in total of each variable are unanswered responses.
3)by χ2-test or t-test
Table 5. Environmental influence on eating by family dinner frequency
more protein foods at meals’ and ‘eating dairy products’ (Table 4). All six food group items were significantly different by family dinner frequency. The group with more frequent family dinners consumed more often ‘one or more protein foods at meals’
(P < 0.001), ‘dairy products’ (P < 0.001), ‘grains and starch foods’
(P < 0.001), ‘vegetable side dishes at meals’ (P < 0.001), ‘seaweeds’
(P < 0.001) and ‘fruits’ (P < 0.01).
Among six unhealthy eating behavior items, the mean consumption frequency of sweets was relatively high (0.5 times per day). Mean consumption frequency of ‘spicy and salty foods’
and ‘processed or instant foods’ was 0.3 times per day. Mean frequency of ‘eating fatty foods’, ‘having soft drinks’ and ‘eating snacks late at night’ was 0.2 times per day. All six unhealthy eating behavior items were not statistically different between the two groups by family dinner frequency (Table 4).
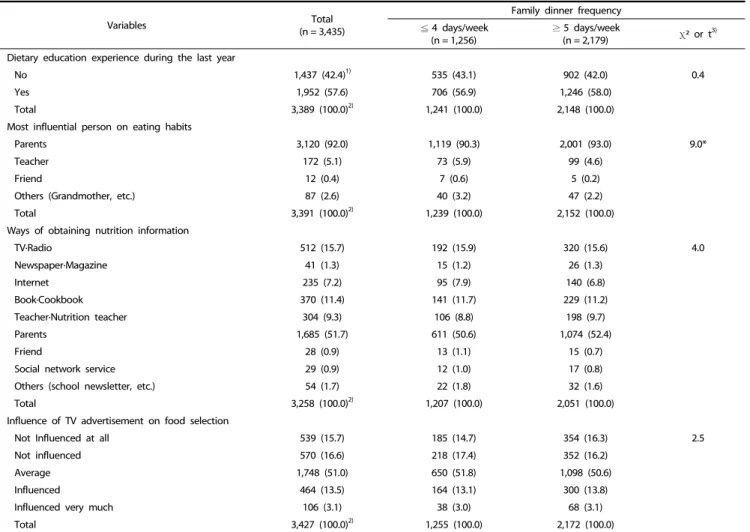
Environmental influence on eating by family dinner frequency More than half of subjects (57.6%) had experience of dietary education in the past year, and there was not statistically difference by family dinner frequency (Table 5). Most subjects (92.0%) reported that parents were the most influential persons on eating habits. The percentage of subjects indicating parents as the most influential persons on eating habits was slightly higher in the group with more frequent family dinners (93.0%
vs. 90.3%; P < 0.05). More than half (51.7%) of subjects mentioned that parents were the major source of nutrition information, followed by ‘TV∙radio’ (15.7%), ‘book∙cookbook’ (11.4%) and
‘teacher∙nutrition teacher’ (9.3%). Only 16.6% of subjects reported that TV advertisements influenced food selection. There were no significant differences in source of nutrition information or influence of TV advertisements on food selection by family dinner frequency.
DISCUSSION
This study examined the frequency of family meals, eating habits and eating behaviors of third-graders, and investigated if eating habits and eating behaviors varied by family dinner frequency. Children having meals with family members 5 or more days per week comprised 63.4% at dinner and 43.3% at breakfast, indicating that a family dinner was more common than a family breakfast. Children sharing meals with family members 2 or fewer days per week included 18.0% at dinner and 41.5% at breakfast. Consistent with this study, previous studies found that family meals were more frequent at dinner [10,13]. Study results suggested that a significant percentage of children had meals alone, indicating a need for nutrition education to address the importance and promote creating opportunities for and participating in family meals. According to the results of 2012 KNHANES [4], 95.4% of children aged 6-11 years had dinner and 77.8% of children had breakfast with family members on 4 or more days per week. The percentage of children having family meals was lower in the current study compared to the 2012 KNHANES, which may be partly due to slight differences in the definition of family meals. Studies on family meals reported that children or young adolescents were likely to have meals with family members more frequently than high school students, suggesting a relationship between the
family meal and age [10,12,13,16]. Therefore, the practice of having meals with family members needs to be formed early.
Among general characteristics, family dinner frequency was related to residential area (P < 0.001) and perceived stress from daily life (P < 0.001). This result suggested that children living in metropolitan areas may have less opportunity to share family meals due to parental or personal busy schedules. Subjects with more frequent family dinners showed less perceived stress in daily life. This finding supports previous studies that family meals positively impact the emotional stability, academic success and healthy eating habits of children [11,26]. Family dinner frequency was not related to general characteristics such as gender and BMI in this study. In a study with adolescents in New Zealand, Utter et al. [15] found no association between family meal frequency and BMI. However, family meals were more common for boys than girls [15], which was partially consistent with data of the current study.
With respect to eating habits, children with frequent family dinners showed more desirable eating habits such as consuming regular meals, exhibiting good behavior during meals (e.g., conversation with family members), eating breakfast, and having breakfast with family members more frequently (P <
0.001). It may be possible to form a habit of eating meals regularly by having dinner with family members on a regular schedule. Our data supported the previous finding that those eating family meals more frequently were less likely to skip breakfast [14,15].
Children who had family dinner more frequently were signi- ficantly more involved in conservation with family members during meals (P < 0.001). A previous study showed that speaking with family members was the most commonly cited reason by adolescents for enjoying family meals [19]. Similar to the current study, previous studies on elementary school students revealed that conservation with family members was the most common behavior during meals [2,10,27,28]. This study found that a significant percentage of children in the group with less frequent family dinners exhibited undesirable behavior during meals, such as ‘playing a game or watching TV’, ‘just eating’,
‘reading a book’ and ‘getting around’. Coon et al. [29] found that elementary school children watching TV at two or more meals per day had a lower intake of nutrient-rich food and higher intakes of processed foods and soft drinks, compared to children with families that watched TV less often during meals. Feldman et al. [7] reported that those who watched TV during family meals had undesirable eating behavior, such as consuming fewer vegetables and drinking more soda.
The percentage of picky eaters was significantly lower among
children with more frequent family dinners. This finding is
similar to a study that reported middle school students sharing
more frequent family meals were less likely to eat only what
they like, more likely to eat meals slowly and eat adequately,
suggesting a positive impact of family meals on dietary behaviors
[12]. Foods that children disliked were primarily vegetables,
beans and seaweeds in the current study, which is similar to
other studies on elementary school students [1,30]. Nutrition
education may incorporate strategies to increase vegetable
consumption by changing beliefs regarding vegetables, increasing
self-efficacy of eating vegetables, providing opportunities to
taste and have vegetables at meals or as snacks. The frequency of eating out and eating snacks or snack foods was not significantly different by family dinner frequency. Haapalahti et al. [31] reported that children with regular family dinners showed a tendency to consume sweets and fast foods less often. Husby et al. [32] suggested that a dietary environment at home needs to be modified in a healthy way because children were more likely to eat meals and snacks at home.
Results on eating behaviors showed that consumption of grains, protein foods, dairy products, vegetables, seaweeds (P
< 0.001) and fruits (P < 0.01) was significantly more frequent in children with more frequent family dinners. This suggests that family meals have a positive influence on consumption of each food groups by children. However, it is possible that some statistically positive associations between some eating behaviors and family dinner frequency were partly due to the large sample size. Study results suggest that nutrition education may be naturally taught at family meals by talking with children and being a role model of healthy eating behaviors. Consistent with the current study, Gillman et al. [16] reported that increasing the frequency of family dinners with children was related to higher consumption of fruits and vegetables, and higher consump- tion of nutrients including fiber, folate, calcium and iron. Studies with adolescents revealed that the number of family meals or family dinners was positively related to healthy eating behaviors such as increased intakes of fruits, vegetables, dark-green vegetables, grains and calcium-rich foods, and negatively associated with soft drinks [7,8,12,14].
In contrast to the positive relationship of family dinners and some eating behaviors in the current study, unhealthy eating behaviors such as consuming high-fat foods, sweets, soft drinks, salty foods, processed or instant foods and eating snacks late at night were not significantly different by frequency of family dinner. A previous study indicated that results on less healthy behaviors (e.g., fast-foods, sweets, fried foods, snack foods) were inconsistent [7,15]. This may be attributed snack foods and sweets being accessible in living environments but not typically consumed at family meals.
Physical and social environment may be important factors in influencing eating habits and eating behaviors of children. In this study, subjects indicated that parents were the most important source of nutrition information and persons with influence on the eating habits of children. More parental influence was reported by the group with more frequent family dinners. Oh et al. [33] found that children with a working mother felt more stressed in daily life and scored lower in dietary habits.
Another study [34] videotaped children and families during a family dinners and reported that a parent’s affective expression during family meals was associated with a kindergarten child’s social competence. Videon∙Manning [14] reported that parental presence at family dinners was positively related to an adoles- cent’s healthy eating behaviors such as consuming fruits, vegetables and dairy products. Findings indicate that parents have significant influence on the eating behaviors of children and adolescents. Therefore, consistent attention and support for parents on children’s eating habits are needed.
The strength of the current study was large representative sample of children, covering 17 cities in Korea. However, there
were some limitations. First, a cross-sectional survey was used, preventing investigation of causal associations among variables.
Second, family dinner frequency was used as a measure of family meals and more detailed information on family meals (e.g., quality of meals) was not obtained.
With a large and representative sample, this study showed that children with frequent family dinners had desirable eating habits, such as eating regular meals, eating breakfast, exhibiting desirable behavior during meals and less likely to have an unbalanced diet. The frequency of consuming a variety of foods, including grains, protein foods, vegetables, fruits, dairy products and seaweeds was higher in children with frequent family dinners. Based on this study, nutrition education is needed to promote creating opportunities to have meals or dinners with family members, and stressing the importance and benefits of family meals. Nutrition education should also include parents, as they were identified as having significant influence on the eating habits of children, and strategies to change the physical and social environment of eating to increase the frequency of family meals.
ACKNOWLEDGEMENT
This study was supported by a research grant (13162MFDS 160) from Ministry of Food and Drug Safety in 2013. We are grateful to school teachers, nutrition teachers and health teachers for their cooperation for the survey, and the children who participated in the survey.
REFERENCES
1. Ku PJ, Lee KA. A survey on dietary habit and nutritional knowledge for elementary school children's nutritional education. Korean J Diet Cult 2000;15:201-13.
2. Lee JE, Jung IK. A study on eating habits of elementary school students and the perception on the nutrition education in curriculum. J Korean Home Econ Educ Assoc 2005;17:79-93.
3. Son SH, Kim KN. Relationship between dietary habits & snack consumption and Attention Deficit Hyperactivity Disorder (ADHD) among elementary school children in Cheongju area. J Hum Ecol 2011;15:59-67.
4. Ministry of Health and Welfare, Korea Centers for Disease Control and Prevention. Korea Health Statistics 2012: Korea National Health and Nutrition Examination Survey (KNHANES V-3). Cheongwon:
Korea Centers for Disease Control and Prevention; 2013.
5. Ministry of Health and Welfare. National Health Plan 2020. Seoul:
Ministry of Health and Welfare; 2011.
6. Sung CJ, Sung MK, Choi MK, Kang YL, Kwon SJ, Kim MH, Seo YL, Adachi M, Mo SM. An ecological study of food and nutrition in elementary school children in Korea. Korean J Community Nutr 2001;6:150-61.
7. Feldman S, Eisenberg ME, Neumark-Sztainer D, Story M. Associa- tions between watching TV during family meals and dietary intake among adolescents. J Nutr Educ Behav 2007;39:257-63.
8. Neumark-Sztainer D, Hannan PJ, Story M, Croll J, Perry C. Family meal patterns: associations with sociodemographic characteristics and improved dietary intake among adolescents. J Am Diet Assoc 2003;103:317-22.
9. Lin BH, Guthrie J, Blaylock JR. The Diets of America's Children:
Influences of Dining Out, Household Characteristics, and Nutrition Knowledge. Agricultural Economic Report No. 746. Washington, D.C.: U.S. Department of Agriculture; 1996.
10. Lee YM, Lee KW, Oh YJ. The perceptions and attitudes of elementary school children towards family meals. J Korean Diet Assoc 2009;15:
41-51.
11. Fruh SM, Fulkerson JA, Mulekar MS, Kendrick LA, Clanton C. The surprising benefits of the family meal. J Nurse Pract 2011;7:18-22.
12. Kwon JE, Park HJ, Lim HS, Chyun JH. The relationships of dietary behavior, food intake, and life satisfaction with family meal frequency in middle school students. Korean J Food Cult 2013;28:272-81.
13. Lee KW, Lee Y, Oh YJ, Cho YJ, Lee MJ. Attitudes toward family meals and comparisons of dietary quality between family meals and meals eaten alone in middle and high school students. J Korean Diet Assoc 2008;14:127-38.
14. Videon TM, Manning CK. Influences on adolescent eating patterns:
the importance of family meals. J Adolesc Health 2003;32:365-73.
15. Utter J, Denny S, Robinson E, Fleming T, Ameratunga S, Grant S.
Family meals among New Zealand young people: relationships with eating behaviors and body mass index. J Nutr Educ Behav 2013;45:3-11.
16. Gillman MW, Rifas-Shiman SL, Frazier AL, Rockett HR, Camargo CA Jr, Field AE, Berkey CS, Colditz GA. Family dinner and diet quality among older children and adolescents. Arch Fam Med 2000;9:235-40.
17. Sung SJ, Kwon SJ. Effect of eating with family or alone on the self-rated mental or physical health: the elementary school children in Daejeon area. Korean J Community Nutr 2010;15:206-26.
18. Kim JN, Min HJ, Chae JM. The effect of family meals on the emotional and behavioral problems of children. J Korean Diet Assoc 2013;19:140-58.
19. Lee KW, Cho YJ. A study on the perceptions and attitudes of middle and high School students towards family meals. J East Asian Soc Diet Life 2007;17:615-25.
20. Lee S, Bae J. A study on the necessity of the nutrition and hygiene education for the elementary school students in Daegu. J Living Sci Res 2008;34:77-92
21. Kim JY. A study on dietary habits and nutritional knowledge according to obesity index in upper-grade students of elementary school in Seoul [master's thesis]. Yongin: Dankook University; 2009.
22. Ko SY, Kim KW. Nutrition label use, self-efficacy, snacking and eating
behavior of middle school students in Kyunggi area. Korean J Community Nutr 2010;15:513-24.
23. Na SY, Ko SY, Eom SH, Kim KW. Intakes and beliefs of vegetables and fruits, self-efficacy, nutrition knowledge, eating behavior of elementary school students in Kyunggi area. Korean J Community Nutr 2010;15:329-41.
24. Cho YG, Song HR, Kim KA, Kang JH, Kang JH, Song YH, Yun HJ, Kim HS. Effect of a school-based intervention for overweight children "Fitness Class" performed on elementary schools located in Seoul. Korean J Obes 2009;18:146-57.
25. Kim MS. The effect on dietary habits, personality and food neophobia by family meals participation [master's thesis]. Seoul:
Ewha Womans University; 2011.
26. Snow CE, Beals DE. Mealtime talk that supports literacy development. New Dir Child Adolesc Dev 2006:51-66.
27. Yon MY, Han YH, Hyun TS. Dietary habits, food frequency and dietary attitudes by gender and nutrition knowledge level in upper- grade school children. Korean J Community Nutr 2008;13:307-22.
28. Kim KH. Food habits, eating behaviors and food frequency by gender and among Seoul and other regions in upper-grade elementary school children. Korean J Community Nutr 2010;15:180-90.
29. Coon KA, Goldberg J, Rogers BL, Tucker KL. Relationships between use of television during meals and children's food consumption patterns. Pediatrics 2001;107:E7.
30. Jeong NY, Kim KW. Nutrition knowledge and eating behaviors of elementary school children in Seoul. Korean J Community Nutr 2009;14:55-66.
31. Haapalahti M, Mykkänen H, Tikkanen S, Kokkonen J. Meal patterns and food use in 10- to 11-year-old Finnish children. Public Health Nutr 2003;6:365-70.
32. Husby I, Heitmann BL, O'Doherty Jensen K. Meals and snacks from the child's perspective: the contribution of qualitative methods to the development of dietary interventions. Public Health Nutr 2008;12:739-47.
33. Oh SH, Hyun WJ, Lee HM, Park HR, Lim HJ, Song KH. A study on the stress and the dietary habits of elementary school children by mother's employment status. Korean J Community Nutr 2010;15:
498-506.
34. Boyum LA, Parke RD. The role of family emotional expressiveness in the development of children's social competence. J Marriage Fam 1995;57:593-608.