IntroductIon
Asthma and its associated traits exhibit a strong familial connec- tion, indicating that a genetic component likely contributes to the disease pathology. Twin studies are commonly used to de- termine whether complex multifactorial diseases, such as asth- ma, have a measurable genetic component. In a study of 7000 monozygotic twins performed over 100 years ago, the concor- dance rate for asthma between monozygotic twin pairs was 19%, nearly four times higher than that of dizygotic twins (4.8%).1 The overall heritability of asthma has since been estimated at
Received: May 23, 2018 Revised: September 11, 2018 Accepted: September 15, 2018
Corresponding author: Hun Soo Chang, PhD, Department of Interdisciplinary Program in Biomedical Science, Graduate School, Soonchunhyang University, 170 Jomaru-ro, Bucheon 14584, Korea.
Tel: 82-32-621-5021, Fax: 82-32-621-5022, E-mail: [email protected]
•The authors have no potential conflicts of interest to disclose.
© Copyright: Yonsei University College of Medicine 2019
This is an Open Access article distributed under the terms of the Creative Com- mons Attribution Non-Commercial License (https://creativecommons.org/licenses/
by-nc/4.0) which permits unrestricted non-commercial use, distribution, and repro- duction in any medium, provided the original work is properly cited.
clinical Implications of Single nucleotide
Polymorphisms in diagnosis of Asthma and its Subtypes
Jong-Sook Park
1, Ji-Hye Son
2, Choon-Sik Park
1, and Hun Soo Chang
21Division of Allergy and Respiratory Medicine, Department of Internal Medicine, Soonchunhyang University Bucheon Hospital, Bucheon;
2Department of Interdisciplinary Program in Biomedical Science, Graduate School, Soonchunhyang University, Bucheon, Korea.
For the past three decades, a large number of genetic studies have been performed to examine genetic variants associated with asthma and its subtypes in hopes of gaining better understanding of the mechanisms underlying disease pathology and to identi- fy genetic biomarkers predictive of disease outcomes. Various methods have been used to achieve these objectives, including linkage analysis, candidate gene polymorphism analysis, and genome-wide association studies (GWAS); however, the degree to which genetic variants contribute to asthma pathogenesis has proven to be much less significant than originally expected. Subse- quent application of GWAS to well-defined phenotypes, such as occupational asthma and non-steroidal anti-inflammatory drug- exacerbated respiratory diseases, has overcome some of these limitations, although with only partial success. Recently, a combi- natorial analysis of single nucleotide polymorphisms (SNPs) identified by GWAS has been used to develop sets of genetic markers able to more accurately stratify asthma subtypes. In this review, we discuss the implications of the identified SNPs in diagnosis of asthma and its subtypes and the progress being made in combinatorial analysis of genetic variants.
Key Words: Asthma, aspirin, non-steroidal anti-inflammatory agents, biomarkers, single nucleotide polymorphism, genetic techniques
pISSN: 0513-5796 · eISSN: 1976-2437 Yonsei Med J 2019 Jan;60(1):1-9
https://doi.org/10.3349/ymj.2019.60.1.1
anywhere from 15–60%, and genetic variants, such as single nu- cleotide polymorphisms (SNPs), are presumed to play an im- portant role in the etiology of the disease. To identify SNPs in multifactorial complex diseases, several approaches, including genome-wide linkage studies, biologically plausible candidate gene association studies, and genome-wide association studies (GWAS) have been performed, revealing more than 100 loci on autosomal and sex chromosomes to be linked to asthma. Link- age analysis has identified SNPs on several genes, including ADAM33,2 DPP10,3 PHF11,4 GPR,5 and PTGDR,6 as strong ge- netic variants for asthma.
Over the past decade, several GWAS have been performed, examining 300K–500K SNPs and producing a nearly complete survey of all common genetic variability.7 In 2010, the GABRIEL consortium used GWAS to confirm the association of asthma with many of the previously identified SNPs associated with an- tigen presentation (HLA-DR/DQ), inflammation (ORMDL3-GS- DMB: Gasdermin B), and TH1/TH2 immune responses (IL33, IL- 1RL1-IL18R1, RAD50-IL13, and TSLP-WDR36).8 However, the odds ratios (ORs) for these markers ranged from 0.5–2.0, much lower than originally expected. Furthermore, combination of these seven SNPs for the classification of childhood asthma pro-
duced a sensitivity of only 35% and a specificity of 75%, indicat- ing these markers as poor predictors of asthma overall.
Despite the poor predictive power suggested by the GABRI- EL consortium study,8 analysis of genetic variants associated with asthma continues to flourish. As of December 2017, 3437 publications were identified in the PubMed database using the searching terms “asthma” and “polymorphism.” Interestingly, the ORs for most of the associated SNPs ranged between 0.5 and 2.0, indicating a much smaller genetic component in the development of asthma than initially expected. Possible expla- nations for this poor predictive power included a lack of rare allele variants in the GWAS database, imprecise disease phe- notypes, and incomplete consideration of environmental fac- tors.9 Furthermore, a more extensive combinatorial analysis using the identified SNPs has not been thoroughly studied to date. The present review focuses on the genetic impact of rare allele variants on asthma and the clinical usefulness of combi- national analysis using identified SNPs on nonsteroidal anti- inflammatory drug-exacerbated respiratory diseases (NERD).
GenetIc effect of rAre vArIAntS In ASthmA
Until recently, much of the speculation regarding the missing heritability not detected using standard GWAS has focused on the possible contribution of rare variants [minor allele frequen- cy (MAF) <0.5%], as only common variants (MAF>5%) were available in previous GWAS datasets. For more information on these rare variants, the 1000 Genomes Project sequenced 1000 individual genomes, revealing more than 15 million new SNPs, 1 million short insertions and deletions, and 20000 structural variants10. More recently, Igartua, et al.11 investigated associa- tions among rare (<1%) and low-frequency (1–5%) variants us- ing a Human Exome Bead Chip array containing 246139 SNPs in ~5000 asthmatic patients and 5000 controls, representing a broad cross section of European, African American/African Ca- ribbean, and Latino subjects. This analysis revealed a number of rare variants for asthma to be associated with ethnicity, in- cluding SNPs in GRASP (general receptor for phosphoinositi- des 1-associated scaffold protein), MTHFR (methylenetetrahy- drofolate reductase), and GSDMB in association with asthma in Latino, African, and all ethnicities, respectively. These data suggest that associations with rare and low-frequency variants are specific for each ethnicity and not likely to explain a signifi- cant proportion of the genetic variants for asthma.
ImProvement of GenetIc effectS AccordInG to StrAtIfIcAtIon of PhenotyPeS
Because asthma is a heterogeneous disease, use of well-de-
fined sub-phenotypes may improve the genetic power of SNPs. Although asthma has been traditionally divided into two major pathways based on the mechanism of pathogene- sis,12 further subgrouping is possible based on the factors that trigger asthma symptoms,13 including allergic asthma, exer- cise-induced asthma, NERD, occupational asthma, menstru- ation-associated asthma, and others. Furthermore, inflam- matory patterns in sputum and peripheral blood analysis can be used to divide asthma into four groups: eosinophilic, neu- trophilic, mixed, and paucigranulocytic types. Clinically and physiologically, asthmatics are also stratified into well con- trolled, exacerbation-prone, and remodeled asthma.
Recently, biological classification has been introduced on the basis of molecular pathogenesis. Candidate endotypes in- clude several biological mediators and functional immune subsets, including TH1, TH2, TH17, innate TH2, epithelial, and smooth muscle dysfunctions, as well as others (Table 1). Iden- tification of genetic associations would therefore have to be studied using cluster analysis of well-defined sub-pheno- types, with patients stratified based on clinical manifestations and endotypes.14,15 Furthermore, quantitative loads of envi- ronmental factors should also be considered, as asthma is known to be triggered or exacerbated by a wide range of com- pounds, including air pollutants,16 occupational materials,17,18 nutritional status19,20 and food allergens.21-24 Of these factors, occupation is one of the most easily accessible triggers. In a Table 1. Classification of Asthma Phenotypes according to Etiologic Agent, Clinical and Inflammatory Patterns, and Molecular Mechanisms 1. Phenotypes related to disease etiology
Aspirin or non-steroidal anti-inflammatory drugs Environmental allergens
Occupational allergens or irritants Estrogens
Exercise Viral infection Obesity
2. Clinical or physiological phenotypes Severity-defined: from mild to severe Exacerbation-prone: brittle vs. non-brittle Defined by chronic airflow restriction: remodeled Treatment-resistant: resistance to steroids
Defined by age at onset: childhood, adulthood, old age 3. Inflammatory phenotypes
Eosinophilic Neutrophilic Pauci-granulocytic 4. Molecular phenotypes
TH1 dominant TH2 dominant TH17 dominant Innate TH2 dominant Epithelial dysfunction Smooth muscle dysfunction
GWAS using the well-defined Korean toluene diisocyanate (TDI)-induced asthmatic cohort,25 SNPs in CTNNA3 (catenin alpha 3, alpha-T catenin) were significantly associated with the risk of TDI-induced asthma (OR=5.84 for rs10762058). The attributable fraction increased up to 24%, indicating that the missing heritability of asthma has been solved in part by the consideration of environmental variables. Very recently, ho- mozygosity of the minor allele SNPs rs10762058 and rs7088181 was shown to increase the risk for di-isocyanate asthma in Caucasian workers, with an OR=9.05 [95% confi- dence interval (CI): 1.69–48.54],26 a level high enough to be considered useful as a genetic marker. Another example is that of drug-induced reactions in susceptible persons, such as those with NERD. Initial genetic association studies of NERD patients used a set of biologically plausible genes associated with the over- or under-production of arachidonic acid me- tabolites. Genes such as LTC4S, ALOX5, NAT2, CysLTR1, and CysLTR2, all members of the cysteinyl leukotriene pathway, exhibited several NERD-associated SNPs, with ORs ranging from 1.88 to 9.78.18,27 Genes of prostaglandin and thrombox- ane pathways discovered using GWAS28 also showed good ORs, although not at levels high enough for use as a stand- alone diagnostic biomarker.
ImProvement In dIAGnoStIc vAlueS by combInAtorIAl AnAlySIS of
multIPle SnPS obtAIned from GWAS
The method most often used for measuring predictive factors is the area under a receiver operator characteristic (ROC) curve (Fig. 1).29 The area under this curve (AUC) is frequently used to discriminate between those with and without disease.
AUC values range from 0.5 (providing no discrimination be- tween the two conditions) to 1.0 (perfect discrimination), with ideal classification exhibiting almost square curves, indicative of high true-positive and low false-positive rates. Disease risk prediction is frequently described using a combination of sensitivity, specificity, and accuracy. In order to obtain a sen- sitivity and specificity of 80% or more, which is typically re- quired for clinical utility, the absolute OR should be greater than 10 (Fig. 1). AUC values predictive of a hypothetical con- dition carry modest (1.5), sizeable (10), and large (50) ORs, showing false-positive fractions at 80% sensitivity (dotted line;
fractions are >75, >25, and <10%, respectively) are shown in Fig. 1.30
To obtain diagnostic marker sets of SNPs with an OR >10, combinatory analyses were performed on SNPs from GWAS.
The first GWAS of 80 NERD subjects and 100 aspirin-tolerant asthma (ATA) subjects was performed using 100K Bead Chips, covering only a small portion of genetic variants. Despite this limitation, eleven genes were identified as having p values
<7×10⁻⁵. One hundred fifty non-monomorphic tagging-SNPs
in and around the 11 identified genes were genotyped on 163 NERD and 429 ATA as the second-stage mapping.31 Among the SNPs, rs7572857 G>A (Gly74Ser) of CEP68 was most sig- nificantly associated with the risk of NERD (p=6.06×10⁻⁵, 95%
CI=1.64–4.21, OR=2.63). Because the ratio of ATA and NERD subjects varies among studies, the number of NERD and ATA patients should be normalized according to the prevalence of NERD in a given population. When we applied the incidence of positive response in oral aspirin challenge (16.03%) in Ko- rean adult asthmatics,32 the diagnostic value of rs7572857 G>A on CEP68 was not high enough to justify clinical application due to the low accuracy (53%), sensitivity (18%), and specific- ity (88%) of this marker. Taken together, these data highlight the need for better methods capable of increasing the dis- criminating power of individual SNPs, as well as the evalua- tion of combinatorial effects of SNPs on disease resolution.33
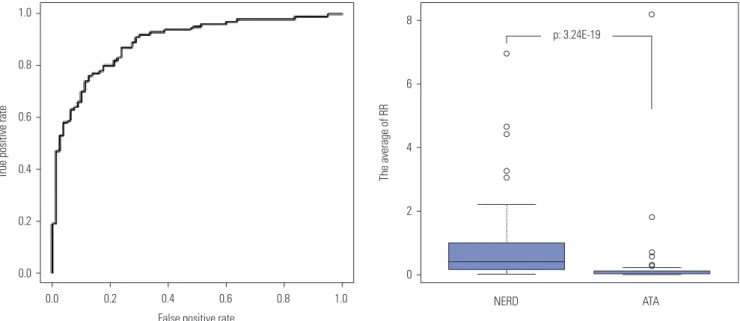
Using the 10 SNPs with the lowest p values from the 1st GWAS of NERD patients,31 relative risk (RR) was calculated for each individual subject using a multiple logistic regression analysis of the 1023 possible combinations (210-1) of SNPs.34 The ROC curve analysis demonstrated that a combinatorial set of eight SNPs was the best model for maximizing the AUC (0.9) for distinguishing NERD from ATA (Fig. 2). This model exhibited 82% accuracy, 78% sensitivity, and 88% specificity with an OR of 20.74 (p=3.24×10⁻¹⁹).34 Each of the eight SNPs, including Parkin RBR E3 Ubiquitin Protein Ligase, DDB1 and CUL4 Associated Factor 4, Vaccinia Related Kinase 2, Carbo- Fig. 1. Area under receiver operator characteristic (ROC) curve values predictive of a hypothetical condition carry modest (1.5), sizeable (10), and large (50) odds ratios (ORs), showing false-positive fractions at 80% sen- sitivity (dotted line; fractions are >75, >25, and <10%, respectively). The graph demonstrates that very large ORs are needed to provide accept- ably low false-positive fractions. Reprinted from Jakobsdottir, et al. PLoS Genet 2009;5:e1000337, with permission of Jakobsdottir, et al.30
1.0
0.8
0.6
0.4
0.2
0
0 0.2 0.4 0.6 0.8 1.0
True-positive frequency
False-positive frequency
hydrate Sulfotransferase 11, Long Intergenic Non-Protein Coding RNA 314, PDZ Domain Containing 2, Small G Protein Signaling Modulator 1, and Centromere Protein F exhibited ORs ranging from 0.32 to 2.91 (Table 2). These data suggest that the diagnostic accuracy of the SNPs as genetic markers is robustly increased by combinatorial analysis, compared to that of single SNPs alone.
In the second GWAS using the 660K chip, as well as a repli- cation study on 141 subjects with NERD and 996 ATA sub- jects,28 rs1042151 (Met105Val) in exon 2 of HLA-DPB1 showed the highest susceptibility to NERD (p=5.11×10⁻⁷; OR=2.40).
The rs1042151 acts as a potential cis regulator of the expres- sion of HLA-DPB1 with an expression quantitative trait loci
(eQTL) score of 36.83, as calculated using the eQTL browser (http://eqtl.uchicago.edu/cgi-bin/gbrowse/eqtl/). Further analysis of SNP function (https://snpinfo.niehs.nih.gov/sn- pinfo/snpfunc.html) indicated that the rs1042151 SNP is lo- cated in an exonic splicing enhancer region; however, despite the location of this SNP, its true effect remains questionable, as rs1042151 alone exhibits very low accuracy (54.7%) and sensitivity (17.7%) for predicting NERD, despite strong speci- ficity (91.7%). Furthermore, because this GWAS was limited to common variants (MAF>5%) with minimal coverage of exonic SNPs,35 a second NERD-associated SNP study was extended to exonic SNPs using an Exome BeadChip assay containing 240K SNP.36 In this analysis, another exonic SNP (exm537513
Fig. 2. ROC curves used to devise the best combinatorial model using the 10 most statistically significant SNPs. Values were taken from the first genome- wide association study, which used 100K Bead Chips, to examine 80 NERD and 100 ATA subjects. RR was calculated for each individual subject using a multiple logistic regression analysis examining all 1023 combinations (210-1) of the 10 SNPs described in reference 34. A model consisting of eight SNPs shows the highest area under the ROC curve of 0.9 with an accuracy of 82.01%. The sensitivity and specificity are 78% and 88%, respectively, with an odds ratio of 20.74 (p=3.24E^-19). The eight SNPs are listed in Table 2. Reprinted from Shin, et al. DNA Cell Biol 2012;31:1604-9, with permission of Mary Ann Liebert, Inc.34 ROC, receiver operator characteristic; SNP, single nucleotide polymorphism; NERD, nonsteroidal antiinflammatory drug-exacerbated respiratory diseases; ATA, aspirin-tolerant asthma; RR, relative risk.
1.0
0.8
0.6
0.4
0.2
0.0
True positive rate
0.0 0.2 0.4 0.6 0.8 1.0 False positive rate
The average of RR
8
6
4
2
0
NERD ATA
p: 3.24E-19
Table 2. List of the Eight SNPs in Fig. 2 and their RRs for Diagnosis of Nonsteroidal Anti-Inflammatory Drug-Exacerbated Respiratory Diseases
SNP Gene Position Alleles p value OR RR
CC CM MM
rs6911768 PARK2 Intron A>C 6.75E-05 2.901 0.43 1.248 3.62
rs3213729 WDR21 5’ UTR C>G 0.000411 2.724 0.507 1.382 3.764
rs6714952 VRK2 Intron C>T 0.000723 2.486 0.526 1.307 3.248
rs746035 CHST11 Intron C>T 0.000532 2.292 0.492 1.127 2.583
rs4501026 LINC00314 Intergenic A>C 4.76E-05 0.4198 1.44 0.604 0.254
rs4867084 PDZK3 Intron G>A 0.00017 0.4177 1.269 0.53 0.221
rs139719 SGSM1 Intron C>T 3.18E-05 0.4109 1.416 0.582 0.239
rs6659655 CENPF Intergenic A>G 3.49E-05 0.3181 1.159 0.369 0.117
SNP, single nucleotide polymorphism; RR, relative risk; OR, odds ratio; PARK2, Parkin RBR E3 Ubiquitin Protein Ligase; WDR21, DDB1 and CUL4 Associated Fac- tor 4; VRK2, Vaccinia Related Kinase 2; CHST11, Carbohydrate Sulfotransferase 11; LINC00314, Long Intergenic Non-Protein Coding RNA 314; PDZK3, PDZ Do- main Containing 2; SGSM1, Small G Protein Signaling Modulator 1; CENPF, Centromere Protein F.
Reprinted from Shin, et al. DNA Cell Biol 2012;31:1604-9, with permission of Mary Ann Liebert, Inc.34
Table 3. List of the Top 30 SNPs Associated with NERD nNamers#AlleleChrPositionGene(s)in EXONMutation(s)MAF (NERD, n=165)MAF (ATA, n=397)OR (95% CI) p value 1exm537513rs1042136A>C633048628HLA-DPB1*,** EXONI94L0.1670.0573.28 (2.13–5.04)3.40E-08 2exm537522rs1042151A>G633048661HLA-DPB1* EXONM105V0.1940.0872.50 (1.71–3.67)2.38E-06 3exm-rs3097671rs3097671G>C633047612HLA-DPB1*.Silent0.1910.0882.47 (1.69–3.62)3.19E-06 4exm-rs2179920rs2179920G>A633058874...0.1940.0892.45 (1.67–3.58)3.95E-06 5exm-rs2281389rs2281389T>C633059796...0.1910.0912.43 (1.66–3.55)4.62E-06 6exm537485rs1126504C>G633048457HLA-DPB1EXONSilent, L37V0.2850.1662.17 (1.55–3.02)5.32E-06 7exm-rs2064478rs2064478G>A633072266...0.1940.0922.40 (1.64–3.51)5.88E-06 8exm-rs3117230rs3117230T>C633075635...0.1940.0922.40 (1.64–3.51)5.88E-06 9exm-rs2064474rs2064474C>T633073463...0.1970.0942.38 (1.63–3.46)5.92E-06 10exm-rs3129270rs3129270G>A633097423...0.0880.0264.09 (2.20–7.60)6.00E-06 11exm-rs3129294rs3129294T>G633084671HLA-DPB2*.Silent0.3240.2071.91 (1.41–2.58)2.75E-05 12exm83523rs3818822G>A1111857208CHIA#,**EXONSilent, G102R0.1330.0642.55 (1.64–3.95)3.00E-05 13exm-rs3116999rs3116999C>G633097166...0.1270.0582.74 (1.70–4.41)3.58E-05 14exm537523rs1042153G>A633048663HLA-DPB1EXONM105I0.2580.1522.04 (1.45–2.87)3.91E-05 15exm1884673rs118191745A>G1738241000THRA#,**EXONI170V0.0330.00313.61 (2.89–63.96)6.20E-05 16exm-rs3130267rs3130267T>G633306794...0.4180.3011.78 (1.34–2.36)6.80E-05 17exm538564rs3130100T>C633283766ZBTB22#,**EXONT310A0.3850.2731.79 (1.33–2.39)9.25E-05 18exm-rs3106192rs3106192T>C633326250...0.4000.2881.75 (1.32–2.32)9.59E-05 19exm2264237rs1074373A>C730616761LOC401320#,**.Silent0.3300.4380.57 (0.42–0.76)0.0001 20exm396794rs1047626G>A442003671SLC30A9#,**EXONM50V0.0090.0520.13 (0.03–0.53)0.0001 21exm-rs3117324rs3117324C>A633324527...0.4330.3201.69 (1.28–2.23)0.0002 22exm-rs3128927rs3128927C>T633074288...0.2580.1621.87 (1.35–2.61)0.0002 23exm791954rs7862221T>C9135782221TSC1#,**EXONE444E, E394E, E445E0.1300.0632.38 (1.50–3.76)0.0002 24exm-rs455567rs455567C>T633252115WDR46.Silent0.3760.2661.73 (1.29–2.33)0.0003 25exm1010999rs10876838C>T1256030938OR10P1EXONP88L0.2240.3160.55 (0.39–0.76)0.0003 26exm1011022rs7970885G>A1256031273OR10P1EXONV200M0.2240.3160.55 (0.39–0.76)0.0003 27exm-rs469064rs469064G>T633250476WDR46.Silent0.3760.2661.72 (1.28–2.31)0.0003 28exm-rs2237892rs2237892C>T112839751KCNQ1.Silent0.4580.3361.66 (1.26–2.20)0.0003 29exm1352136rs35489971G>A1772700943RAB37EXONSilent, V19A0.3030.2131.80 (1.31–2.49)0.0003 30exm2259454rs7866939C>T985126163...0.5240.4221.67 (1.26–2.22)0.0003 NERD, nonsteroidal antiinflammatory drug-exacerbated respiratory diseases; MAF, minor allele frequency; ATA, aspirin-tolerant asthma; SNP, single nucleotide polymorphism; AUC, area under the curve; OR, odds ratio. An exonic SNP (exm537513 in HLA-DPB1, rs1042136) exhibited the strongest association with NERD (p=3.4×10⁻⁸, OR=3.28). Among six exonic SNPs within the HLA genes, a combination of four SNPs (marked with *) had the best AUC value of 0.629, with an OR=3.677, 68.4% accuracy, 29.8% sensitivity, and 90.3% specificity. The other six SNPs (marked with #) were then added to the four HLA SNPs, and multiple logistic regres- sion analysis was performed. Relative risk was calculated for each individual subject using a multiple logistic regression analysis examining all 1023 combinations (210-1) of the 10 SNPs. A combination model of sev- en SNPs marked with ** showed the best AUC of 0.75 (p=7.94×10⁻²¹), with OR=7.291, 40.8% sensitivity, 88.0% specificity, and 75% accuracy for discrimination between NERD from ATA. Reprinted from Shin, et al. PLoS One 2014;9:e111887, with permission of Shin, et al.36
in HLA-DPB1, rs1042136) showed the lowest p value (p=3.4×10⁻⁸, OR: 3.28) in association with the risk of NERD, al- though with low sensitivity (16.7%) and accuracy (55.5%) as before, in spite of relatively high specificity (94.3%). These data suggest that SNPs on HLA-DPB1 should contribute to the development of NERD. but are not clinically useful as genetic markers of NERD.
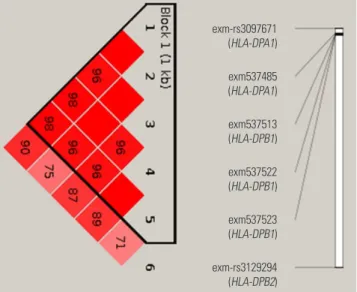
In the exon-wide association study, 16 of the top 20 SNPs were located on chromosome 6 (Table 3). Among them, six SNPs were exonic and located on HLA-DPB1 [exm537513 (rs1042136, I94L), exm537522 (re1042151, M105V), and exm537523 (rs1042153, M105I)], HLA-DPA1 [exm-rs3097671 (silent) and exm537485 (rs1126504, L327V)], and HLA-DPB2 [exm-rs3129294 (silent)]. Furthermore, a strong linkage dis- equilibrium (LD) was noted between the six exonic SNPs in the HLA genes (Fig. 3). AUCs for the combinations of these SNPs (26-1) were calculated by multiple logistic regression analysis, with a combination of four SNPs (exm537513, exm537522, exm-rs3097671, and exmrs3129294) exhibiting the best AUC value of 0.629 with OR=3.677, 68.4% accuracy, 29.8% sensitivity, and 90.3% specificity. To further enhance the diagnostic value of the exonic SNPs, the other six exonic SNPs were selected according to their p values (marked with # in Table 3) and added to the four HLA SNPs. A multiple logis- tic regression analysis was undertaken for all combinations of these 10 SNPs under the additive mode, yielding a total of 1023 models (210-1) generated. From this analysis, a combina- tion of seven SNPs (exm537513, exm83523, exm1884673, exm538564, exm2264237, exm396794, and exm791954) showed the best AUC of 0.75 (p=7.94×10⁻²¹), with OR=7.291, 40.8% sensitivity, 88.0% specificity, and 75% accuracy for the discrimination of NERD from ATA. To date, 2161 SNPs in HLA-DPB1 and 2602 SNPs in HLA-DPA1 have been identified (http://www.ncbi.nlm.nih.gov/snp/?term=HLA-DPB1 and http://www.ncbi.nlm.nih.gov/snp/?term=HLA-DPA1), of which 239 and 193 exonic SNPs are present in HLA-DPB1 and HLA-DPA1, respectively. This indicates that the number of SNPs within the 660K GWAS and 240K exon chips used in our and other studies is still not sufficient to discover all of the SNPs associated with NERD. Thus, further discovery of SNPs in HLA-DPB1 and HLA-DPA1 will be necessary for the devel- opment of diagnostic genetic markers for NERD.
Our third combinatorial analysis of SNPs was performed with the 660W genome-wide association data examining 142 NERD and 996 ATA.28 Fourteen genes [HLA-DPB1, MEIS1, NAB1, NRP2, CLDN1, DCDC2, TMEM196, AK8 (C9orf98), TSC1, ZFYVE1-RBM25, PCSK6, ILVBL, GP6, and RDH13]
were selected on the basis of OR and p values (Table 4). In this study, summed genetic risk scores were calculated as a com- binatorial analysis and used in place of OR.37 To exclude the effect of LD, one SNP on each of the 14 genes was chosen, and the genetic risk score of each of the subjects was calculated by assigning ORs to the risk alleles in comparison to reference al-
leles. This was followed by summing the ORs from multiple variants in different genetic loci into a single RR value using the following formula:
∑ In(odds ratio×risk allele) Summed risk score=EXP nallele . The summed risk scores of the 14 SNPs ranged from 0.774 to 1.142, with an average of 0.973. These summed risk scores were significantly higher in NERD patients than in ATA con-
Table 4. List of the 14 Top SNPs Predictive of NERD from the 660K GWAS SNPID Chr. Gene
(nearest gene) Location
Results of GWAS Odd ratio
(95% CI) p value rs12619205 2 MEIS1 Intron 1.72 (1.30–2.28) 1.14×10⁻⁴ rs10931468 2 NAB1 Intron 1.45 (1.09–1.93) 9.94×10⁻³ rs849530 2 NRP2 Intron 1.8 (1.35–2.41) 6.91×10⁻⁵ rs10513846 3 CLDN1 Intron 0.68 (0.51–0.91) 8.15×10⁻³ rs2281389 6 HLA-DPB1 3’ 2.4 (1.61–3.58) 5.6×10⁻⁶ rs3789224 6 DCDC2 Intron 1.98 (1.41–2.77) 8.55×10⁻⁵ rs9886152 7 (TMEM196) Intron 0.54 (0.39–0.76) 3.09×10⁻⁴ rs2771994 9 AK8 (C9orf98) Intron 1.87 (1.39–2.52) 2.48×10⁻⁵ rs1050700 9 TSC1 3’UTR 1.82 (1.35–2.45) 5.82×10⁻⁵ rs12432987 14 ZFYVE1-RBM25 Intron 1.88 (1.38–2.57) 4.36×10⁻⁵ rs3825915 15 PCSK6 Intron 0.51 (0.37–0.70) 2.5×10⁻⁵ rs2240299 19 ILVBL Intron 0.51 (0.37–0.72) 7.61×10⁻⁵ rs11669150 19 GP6 Intron 0.68 (0.47–0.98) 3.74×10⁻² rs1671215 19 RDH13 3’ 0.49 (0.32–0.74) 6.34×10⁻⁴ SNP, single nucleotide polymorphism; NERD, nonsteroidal antiinflammatory drug-exacerbated respiratory diseases; GWAS, genome-wide association studies; CI, confidence interval.
Using the 14 SNPs listed in the table, combinatorial analysis was performed, and the results are summarized in Table 5. Reprinted from Chang, et al. Phar- macogenomics J 2015;15:316-21, with permission of Springer Nature.37 Fig. 3. Linkage disequilibrium (LD) between the six exonic SNPs in the HLA genes. The number in the box indicates LDr2. Reprinted from Shin, et al. PLoS One 2014;9:e111887, with permission of Shin, et al.36
exm-rs3097671 (HLA-DPA1)
exm537485 (HLA-DPA1)
exm537513 (HLA-DPB1)
exm537522 (HLA-DPB1)
exm537523 (HLA-DPB1)
exm-rs3129294 (HLA-DPB2)
trols (1.033±0.005 vs. 0.963±0.002, p=8.58×10-37). The AUC of the NERD score was 0.821. The best cutoff value with a score of 1.01328 was determined using the ROC curve and the Youden’s Index. A higher proportion of NERD subjects showed summed risk scores above the cutoff value relative to ATA subjects [64.66% vs. 15.04%, p=1.38×10⁻³², OR=10.34 (6.69–
15.96)]. The sensitivity and specificity of the scores were 64.7%
and 85.0%, respectively, with an accuracy of 82.0% (42.1%
positive and 93.4% negative predictive values) (Table 5).
comPArISon of the GenetIc mArKerS In dIAGnoSIS of nerd
The three most significant SNPs identified in the GWAS and exome chip studies exhibited ORs of only 2.4–3.28, with accu- racies of 53.0–55.5% (Table 6). Although the specificity of these markers was very high, nearing 90% in many cases, the sensitivity of these markers was consistently low, typically at less than 20%. In contrast, both the OR and accuracy were el- evated using combinatorial analysis of the top 10 SNPs ob- tained from the GWAS. A combinatorial analysis of several SNPs from GWAS and exome-wide association studies pro- vided a more comprehensive genetic set for the diagnosis of NERD, compared to that of single SNPs alone. In the data pre-
sented here, the combination of eight SNPs obtained from a 100K GWAS and the summed risk score of 14 SNPs obtained from 660K GWAS showed higher accuracy (82.0% and 82.01%), compared with that observed for the 240K exome chip (68.4%
and 75.0%). The improved accuracy of GWAS in these studies was derived from the higher sensitivity of the method (64.7%
and 78.0%), compared to that seen using exome-wide meth- ods (29.8% and 40.8%), despite equal specificities of ~90%.
PerSPectIveS for ImProved dIAGnoStIc vAlueS uSInG combInAtorIAl AnAlySIS of multIPle SnPS
GWAS have been used to identify numerous loci associated with multifactorial complex diseases and quantitative traits.
However, most GWAS have not studied the gene-gene inter- actions (epistasis) that could be important in complex trait genetics and in combinatorial analysis of the SNPs. Existing statistical techniques, such as logistic regression and multifac- tor dimensionality reduction, can be used to identify the com- binatorial effects of multiple SNPs in disease susceptibility;
however, methods for the analysis of these techniques re- mains computationally intensive. To overcome some of these
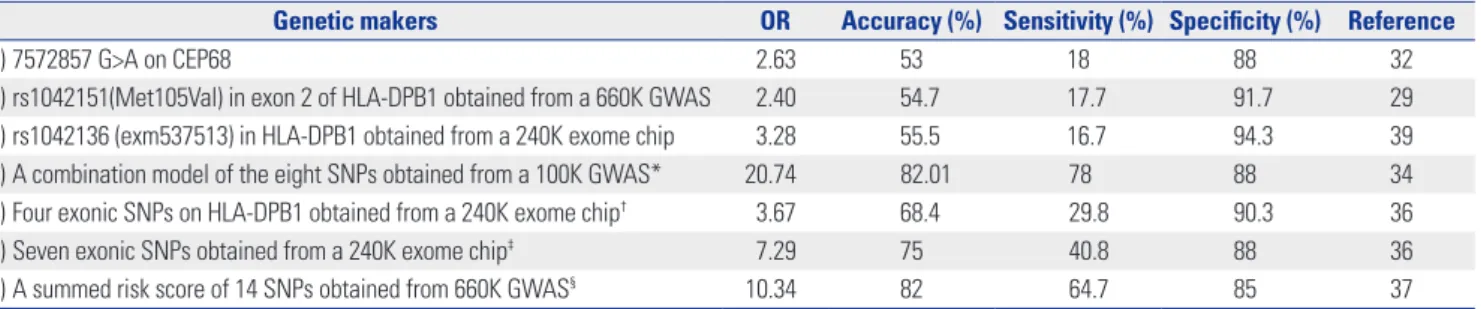
Table 6. Diagnostic Accuracy of SNPs Identified in GWAS and Exon-Wide Association Studies for NERD
Genetic makers OR Accuracy (%) Sensitivity (%) Specificity (%) Reference
1) 7572857 G>A on CEP68 2.63 53 18 88 32
2) rs1042151(Met105Val) in exon 2 of HLA-DPB1 obtained from a 660K GWAS 2.40 54.7 17.7 91.7 29
3) rs1042136 (exm537513) in HLA-DPB1 obtained from a 240K exome chip 3.28 55.5 16.7 94.3 39
4) A combination model of the eight SNPs obtained from a 100K GWAS* 20.74 82.01 78 88 34
5) Four exonic SNPs on HLA-DPB1 obtained from a 240K exome chip† 3.67 68.4 29.8 90.3 36
6) Seven exonic SNPs obtained from a 240K exome chip‡ 7.29 75 40.8 88 36
7) A summed risk score of 14 SNPs obtained from 660K GWAS§ 10.34 82 64.7 85 37
SNP, single nucleotide polymorphism; GWAS, genome-wide association studies; NERD, nonsteroidal antiinflammatory drug-exacerbated respiratory diseases;
OR, odds ratio.
*A combination set of eight SNPs listed in Table 2, †A combination of four exonic SNPs (exm537513, exm537522, exm-rs3097671, and exmrs3129294) listed in Table 3, ‡A combination model of seven SNPs (exm537513, exm83523, exm1884673, exm538564, exm2264237, exm396794, and exm791954) listed in Table 3, §14 SNPs on the genes [HLA-DPB1, MEIS1, NAB1, NRP2, CLDN1, DCDC2, TMEM196, AK8 (C9orf98), TSC1, ZFYVE1-RBM25, PCSK6, ILVBL, GP6 and RDH13] listed in Table 4.
Table 5. Diagnostic Value of the Summed Risk Scores Using the Top 14 SNPs to Predict NERD
RR score Diagnosis, n (%)
Statistics Diagnostic value
ATA NERD Total Sensitivity Specificity Accuracy
<1.01328 582 (72.7) 41 (5.1) 623 (77.8) χ2=141.31 64.70% 85.00% 82.00%
>1.01328 103 (12.9) 75 (9.4) 178 (22.2) p=1.38×10⁻³² +PV 42.1% LR+ 4.300
Total 685 (85.5) 116 (14.5) 801 (100) -PV 93.4% LR- 0.416
SNP, single nucleotide polymorphism; NERD, nonsteroidal antiinflammatory drug-exacerbated respiratory diseases; ATA, aspirin-tolerant asthma; +PV, positive predictive value; -PV, negative predictive value; LR+, positive likelihood ratio; LR-, negative likelihood ratio; OR, odds ratio; RR, relative risk.
To calculate the genetic risk score of each of the subjects, ORs were assigned to the risk alleles in contrast to the value of 1 assigned to reference alleles. ORs from multiple variants in different genetic loci were summed into a single RR value. The summed risk scores of the 14 SNPs in the study subjects ranged from 0.774 to 1.142. The summed risk scores were significantly higher in the NERD group than in the ATA group (1.033±0.005 vs. 0.963±0.002, p=8.58×10-37). A higher proportion of NERD subjects showed summed risk scores above the cutoff value [64.66% vs. 15.04%, p=1.38×10⁻³², OR: 10.34 (6.69–15.96)]. The sensitiv- ity and specificity of the scores were 64.7% and 85.0%, respectively, with 42.1% positive and 93.4% negative predictive values. The overall accuracy of the test was 82.0%. Reprinted from Chang, et al. Pharmacogenomics J 2015;15:316-21, with permission of Springer Nature.37
computational bottlenecks, a series of methods have been de- veloped, including the use of computers equipped with par- ticular graphical processing units, such as the BiForce Toolbox (University of Turku, Turku, Finland). The BiForce Toolbox in- corporates additional tests of interactions involving SNPs with significant marginal effects and identifies interesting interac- tion signals and pathways.38 Pathway-based approaches may also narrow the search space and enhance power, for example by seeking pathways39 or by identifying common pathways enriched in epistatic genes with modest interaction signals de- tected from multiple GWAS populations.40 In either case, rapid screening of pairwise interactions in individual GWAS popu- lations appears to be critical in order to provide the informa- tion necessary to design and perform pathway-based analyses.
Another limitation is the relatively small sizes used in these studies, thereby limiting the ability to replicate significant epistasis signals.41 A recently proposed statistical method, called Limitless Arity Multiple-testing Procedure (LAMP),42 provides the possibility of detecting statistically significant higher-order interactions. LAMP is a multiple testing proce- dure for identifying statistically significant combinatorial ef- fects by introducing a theoretical upper bound for a family- wise error rate tighter than a Bonferroni correction. Its application to GWAS may uncover synergistic effects of SNPs associated with diseases, while filtering out uninformative combinations. Another program, LAMPLINK (National Insti- tute of Advanced Industrial Science and Technology, Tokyo, Ja- pan), also has the ability to quickly identify combinatorial ef- fects of SNPs.
Outside of computational methodologies, an important fac- tor complicating the diagnosis of NERD is the low overall pen- etration of genetic traits. If the genetically susceptible subjects do not take aspirin or NSAID in their lifetime, they will never develop NERD or aspirin-induced urticaria. Thus, a history of aspirin or NSAID use should be available at the time of diag- nosis, although the exact dosage and duration of drug expo- sure remains difficult to estimate for both patients and physi- cians. In the future, better combinatorial data will be possible as more information related to the measurable exposome be- comes available and incorporated into big data-type analyses, including factors such as lifestyle, prescription drug use, and exposure to air pollution.
In the effort to identify SNP markers, GWAS has provided useful information for asthma. Understandably, however, identified SNP markers alone show poor discriminating pow- er for diagnosis, mainly due to biological complexity and phe- notypic heterogeneity of asthma. Research to identify rare variants in asthma not only seems to be unsuccessful at dis- covering genetic markers, but also fails to provide meaningful information on the missing heritability of the disease. In con- trast, studies using sub-phenotypes and combination/inte- gration of SNPs seem to be more successful in achieving clini- cally useful diagnostics. In the near future, it is expected that
statistical methods providing improved sensitivity and speci- ficity could be achieved by the combination and integration of common genetic variants with exposome data for individu- al patients.
AcKnoWledGementS
This study was supported by the Ministry of Health, Welfare and Family Affairs, Republic of Korea (HI13C0319) and a re- search grant from Soonchunhyang University to JS Park.
orcId ids
Jong-Sook Park https://orcid.org/0000-0003-4128-9085 Ji-Hye Son https://orcid.org/0000-0002-5380-1245 Choon-Sik Park https://orcid.org/0000-0003-2977-0255 Hun Soo Chang https://orcid.org/0000-0002-4025-4182
referenceS
1. Edfors-Lubs ML. Allergy in 7000 twin pairs. Acta Allergol 1971;26:
249-85.
2. Van Eerdewegh P, Little RD, Dupuis J, Del Mastro RG, Falls K, Si- mon J, et al. Association of the ADAM33 gene with asthma and bronchial hyperresponsiveness. Nature 2002;418:426-30.
3. Allen M, Heinzmann A, Noguchi E, Abecasis G, Broxholme J, Ponting CP, et al. Positional cloning of a novel gene influencing asthma from chromosome 2q14. Nat Genet 2003;35:258-63.
4. Zhang Y, Leaves NI, Anderson GG, Ponting CP, Broxholme J, Holt R, et al. Positional cloning of a quantitative trait locus on chromo- some 13q14 that influences immunoglobulin E levels and asth- ma. Nat Genet 2003;34:181-6.
5. Laitinen T, Polvi A, Rydman P, Vendelin J, Pulkkinen V, Salmikan- gas P, et al. Characterization of a common susceptibility locus for asthma-related traits. Science 2004;304:300-4.
6. Oguma T, Palmer LJ, Birben E, Sonna LA, Asano K, Lilly CM. Role of prostanoid DP receptor variants in susceptibility to asthma. N Engl J Med 2004;351:1752-63.
7. Hardy J, Singleton A. Genomewide association studies and hu- man disease. N Engl J Med 2009;360:1759-68.
8. Moffatt MF, Gut IG, Demenais F, Strachan DP, Bouzigon E, Heath S, et al. A large-scale, consortium-based genomewide association study of asthma. N Engl J Med 2010;363:1211-21.
9. Manolio TA, Collins FS, Cox NJ, Goldstein DB, Hindorff LA, Hunt- er DJ, et al. Finding the missing heritability of complex diseases.
Nature 2009;461:747-53.
10. 1000 Genomes Project Consortium, Abecasis GR, Altshuler D, Auton A, Brooks LD, Durbin RM, Gibbs RA, et al. A map of hu- man genome variation from population-scale sequencing. Nature 2010;467:1061-73.
11. Igartua C, Myers RA, Mathias RA, Pino-Yanes M, Eng C, Graves PE, et al. Ethnic-specific associations of rare and low-frequency DNA sequence variants with asthma. Nat Commun 2015;6:5965.
12. Green RH, Brightling CE, Bradding P. The reclassification of asth- ma based on subphenotypes. Curr Opin Allergy Clin Immunol 2007;7:43-50.
13. Lee SH, Park JS, Park CS. The search for genetic variants and epi- genetics related to asthma. Allergy Asthma Immunol Res 2011;3:
236-44.
14. Moore WC, Meyers DA, Wenzel SE, Teague WG, Li H, Li X, et al.
Identification of asthma phenotypes using cluster analysis in the Severe Asthma Research Program. Am J Respir Crit Care Med 2010;181:315-23.
15. Jang AS, Kwon HS, Cho YS, Bae YJ, Kim TB, Park JS, et al. Identifi- cation of subtypes of refractory asthma in Korean patients by cluster analysis. Lung 2013;191:87-93.
16. Lee JH, Lee HS, Park MR, Lee SW, Kim EH, Cho JB, et al. Relation- ship between indoor air pollutant levels and residential environ- ment in children with atopic dermatitis. Allergy Asthma Immunol Res 2014;6:517-24.
17. Jeong I, Kim I, Park HJ, Roh J, Park JW, Lee JH. Allergic diseases and multiple chemical sensitivity in Korean adults. Allergy Asth- ma Immunol Res 2014;6:409-14.
18. Hur GY, Ye YM, Koh DH, Kim SH, Park HS. IL-4 receptor α poly- morphisms may be a susceptible factor for work-related respira- tory symptoms in bakery workers. Allergy Asthma Immunol Res 2013;5:371-6.
19. Kim SH, Sutherland ER, Gelfand EW. Is there a link between obe- sity and asthma? Allergy Asthma Immunol Res 2014;6:189-95.
20. Lee SY, Kang MJ, Kwon JW, Park KS, Hong SJ. Breastfeeding might have protective effects on atopy in children with the CD14C-159T CT/CC genotype. Allergy Asthma Immunol Res 2013;5:239-41.
21. Huiyan W, Yuhe G, Juan W, Junyan Z, Shan W, Xiaojun Z, et al.
The importance of allergen avoidance in high risk infants and sensitized patients: a meta-analysis study. Allergy Asthma Immu- nol Res 2014;6:525-34.
22. Peden D, Reed CE. Environmental and occupational allergies. J Allergy Clin Immunol 2010;125(2 Suppl 2):S150-60.
23. von Mutius E. Gene-environment interactions in asthma. J Aller- gy Clin Immunol 2009;123:3-11.
24. Park HJ, Lim HS, Park KH, Lee JH, Park JW, Hong CS. Changes in allergen sensitization over the last 30 years in Korea respiratory allergic patients: a single-center. Allergy Asthma Immunol Res 2014;6:434-43.
25. Kim SH, Cho BY, Park CS, Shin ES, Cho EY, Yang EM, et al. Alpha- T-catenin (CTNNA3) gene was identified as a risk variant for tolu- ene diisocyanate-induced asthma by genome-wide association analysis. Clin Exp Allergy 2009;39:203-12.
26. Bernstein DI, Kashon M, Lummus ZL, Johnson VJ, Fluharty K, Gautrin D, et al. CTNNA3 (α-catenin) gene variants are associated with diisocyanate asthma: a replication study in a Caucasian worker population. Toxicol Sci 2013;131:242-6.
27. Park SM, Park JS, Park HS, Park CS. Unraveling the genetic basis of aspirin hypersensitivity in asthma beyond arachidonate path- ways. Allergy Asthma Immunol Res 2013;5:258-76.
28. Park BL, Kim TH, Kim JH, Bae JS, Pasaje CF, Cheong HS, et al. Ge- nome-wide association study of aspirin-exacerbated respiratory disease in a Korean population. Hum Genet 2013;132:313-21.
29. Steyerberg EW, Vickers AJ, Cook NR, Gerds T, Gonen M, Obu- chowski N, et al. Assessing the performance of prediction models:
a framework for traditional and novel measures. Epidemiology 2010;21:128-38.
30. Jakobsdottir J, Gorin MB, Conley YP, Ferrell RE, Weeks DE. Inter- pretation of genetic association studies: markers with replicated highly significant odds ratios may be poor classifiers. PLoS Genet 2009;5:e1000337.
31. Kim JH, Park BL, Cheong HS, Bae JS, Park JS, Jang AS, et al. Ge- nome-wide and follow-up studies identify CEP68 gene variants associated with risk of aspirin-intolerant asthma. PLoS One 2010;
5:e13818.
32. Chang HS, Park JS, Jang AS, Park SW, Uh ST, Kim YH, et al. Diag- nostic value of clinical parameters in the prediction of aspirin-ex- acerbated respiratory disease in asthma. Allergy Asthma Immu- nol Res 2011;3:256-64.
33. Wei WH, Hemani G, Haley CS. Detecting epistasis in human complex traits. Nat Rev Genet 2014;15:722-33.
34. Shin SW, Park J, Kim YJ, Uh ST, Choi BW, Kim MK, et al. A highly sensitive and specific genetic marker to diagnose aspirin-exacer- bated respiratory disease using a genome-wide association study.
DNA Cell Biol 2012;31:1604-9.
35. McCarthy MI, Hirschhorn JN. Genome-wide association studies:
potential next steps on a genetic journey. Hum Mol Genet 2008;
17:R156-65.
36. Shin SW, Park BL, Chang H, Park JS, Bae DJ, Song HJ, et al. Exonic variants associated with development of aspirin exacerbated re- spiratory diseases. PLoS One 2014;9:e111887.
37. Chang HS, Shin SW, Lee TH, Bae DJ, Park JS, Kim YH, et al. Devel- opment of a genetic marker set to diagnose aspirin-exacerbated respiratory disease in a genome-wide association study. Pharma- cogenomics J 2015;15:316-21.
38. Gyenesei A, Moody J, Laiho A, Semple CA, Haley CS, Wei WH. Bi- Force Toolbox: powerful high-throughput computational analysis of gene-gene interactions in genome-wide association studies.
Nucleic Acids Res 2012;40:W628-32.
39. Zuk O, Hechter E, Sunyaev SR, Lander ES. The mystery of missing heritability: Genetic interactions create phantom heritability.
Proc Natl Acad Sci U S A 2012;109:1193-8.
40. Wei WH, Hemani G, Gyenesei A, Vitart V, Navarro P, Hayward C, et al. Genome-wide analysis of epistasis in body mass index using multiple human populations. Eur J Hum Genet 2012;20:857-62.
41. Gauderman WJ. Sample size requirements for association studies of gene-gene interaction. Am J Epidemiol 2002;155:478-84.
42. Terada A, Okada-Hatakeyama M, Tsuda K, Sese J. Statistical sig- nificance of combinatorial regulations. Proc Natl Acad Sci U S A 2013;110:12996-3001.