Print ISSN: 2288-4637 / Online ISSN 2288-4645 doi:10.13106/jafeb.2021.vol8.no2.0667
Determinant Factors of the Performance of Higher Institutions in Indonesia
Yumhi YUMHI1, Dwi MARTOYO2, Zakiyya TUNNUFUS3, Elkana TIMOTIUS4
Received: November 05, 2020 Revised: December 30, 2020 Accepted: January 08, 2021
Abstract
This causal quantitative research aims to investigate the influence of factors that determine the performance of employees in Indonesian universities. The factors are crucial for organizations in the achievement of their goals. Based on theoretical studies, three independent variables, namely, training, personality, and work motivation were tested for their influence on employee performance, which was the dependent variable. Primary data were obtained from 94 respondents of a total population of 122 individuals at the Education Quality Assurance Institute (LPMP) in Banten Province, Indonesia. They were tested by the normality test using the Kolmogorov-Smirnov approach to ensure their normally distributed population and the linearity test to measure the significant linear relationship between the two variables.
There are five hypotheses in this study. Each hypothesis tested by the F-test to determine the significant effect of all independent variables on the dependent variable, and t-test to analyze the effect. The results of this study answered all hypotheses of the research model. There is a positive direct effect of training and personality on work motivation. Both training and personality also affect positively employee performance. Another finding of this study is that employee performance is positively and directly affected by work motivation.
Keywords: Training, Personality, Work Motivation, Employee Performance JEL Classification Code: D91, I23, J24, M53, O15
education, has become borderless. The quality of education and the determinant factors of the performance at the higher education institutions require an effective and efficient policy (Nguyen, Nguyen, Chu, & Tran, 2020). This basic organizational need is also crucial for universities to maximize the management of the education system.
However, in practice, the problem these institutions face, including other organizations is finding employees that meet these criteria.
In a higher education institution, the faculty members play a significant role in improving the quality of higher education (Tran & Do, 2020). Their performance is determined by many factors, one of them is motivation (Dysvik & Kuvaas, 2013; Caillier, 2014). Rasheed, Humayon, Awan, and Ahmad (2014) discovered that motivation can be generated through the training provided by organizations to their employees, to increase their knowledge and abilities. Moreover, in line with the Self-Determination theory, training that motivates individual improves their performance (Cobblah & Walt, 2016).
The unique characteristic of an organization is the diverse personality of each individual therein. Moreover, Mahlamäki, Rintamäki, and Rajah (2018) and Furnham,
1 First Author and Corresponding Author. Head of Study Program, Department of Management, Postgraduate Program, STIE La Tansa Mashiro, Banten, Indonesia [Postal Address: Jl. Raya By Pass Pasir Jati, Rangkasbitung, Kabupaten Lebak, Banten, 42357, Indonesia]
Email: [email protected]
2 Researcher, Lembaga Penjaminan Mutu Pendidikan, Banten, Indonesia
3Head of STIE La Tansa Mashiro, Banten, Indonesia
4 Assistant Professor, Department of Industrial Engineering, Faculty of Engineering and Computer Science, Universitas Kristen Krida Wacana, Jakarta, Indonesia
© Copyright: The Author(s)
This is an Open Access article distributed under the terms of the Creative Commons Attribution Non-Commercial License (https://creativecommons.org/licenses/by-nc/4.0/) which permits unrestricted non-commercial use, distribution, and reproduction in any medium, provided the original work is properly cited.
1. Introduction
Employee performance plays a role in helping organizations achieve their goals. Therefore, the need for professional and high-performing employees cannot be overemphasized (Colquitt, Lepine, & Wesson, 2019).
Currently, the education ecosystem, particularly higher
Eracleous, and Premuzic (2009) believed that an employee’s personality has a significant relationship with motivation.
According to Yang and Hwang (2014), an employee with a proactive personality will become a human resource that can support the performance of an organization. Based on theoretical studies, the performance of an employee in an organization is highly dependent on training, personality, and motivation. Therefore, these three variables were tested for their influence on employee performance in higher education.
2. Literature Review 2.1. Training
Training is a very important aspect of an organization because of its impact on competitiveness, knowledge management, income, and performance (Mathis & Jackson, 2010). Umar, Tamsah, Mattalatta, Baharuddin, and Latief (2020) found that the effectiveness of practical training would encourage employees’ soft-skill competence, which improves the creativity and team performance. Furthermore, according to Dessler (2017), this process teaches new employees the basic skills needed to carry out their duties.
Training is a very crucial process that every establishment needs to provide for its employees because, according to Jones and George (2015), this process has the potential to develop them into high-performance individuals. However, Cobblah and Walt (2016) stated that this process should always be measured for its effectiveness in providing benefits for the organization.
There are three ways to measure the effectiveness of training (Aziz, 2015). The first is learning performance evaluation, and this measures the increase or change in declarative, knowledge including theory, facts, and methods, procedural knowledge, including technical applications, and meta-cognition, including belief, certainty, and self-confidence. The second is individual performance evaluation and this measures the improvement or change in competence, efficiency, and effectiveness in the workplace. Finally, there is the organizational performance evaluation, which measures improvement or change in teamwork, customer satisfaction, the achievement of organizational goals, and improvement in the organization’s reputation after training. The training variable in this study was based on efforts to improve employee performance by increasing their knowledge, competence, and work methods.
2.2. Personality
Organizations consist of individuals who have various characteristic personalities. Moreover, personality is a
pattern of traits that is relatively permanent and consistent in one’s behavior (Feist & Feist, 2008). Burger (2019) further defined this unique characteristic as a consistent and intrapersonal pattern of behavior that has processes, which originate from within the individual. Personality is described as several ways individuals react and interact with others (Robbins & Judge, 2017) and significantly shaped by genetic and environmental factors (Ivancevich, Konopaske, &
Matteson, 2014). The personality, which was an independent variable in this study, was described as a pattern of employee behavior that occurs as a reaction to their work environment and consists of friendliness, conscience, emotional stability, extraversion, and self-disclosure.
2.3. Work Motivation
Motivation as a trigger for increased work performance has a significant psychological effect on company strategy in various business operations (Paais & Pattiruhu, 2020).
According to Kinicki and Fugate (2018), motivation describes the psychological process that becomes behavior as the direction and intensity of thinking. Another definition is that motivation is the strength of a person that voluntarily exerts certain efforts within a particular period to achieve certain goals (McShane & Glinow, 2018). In a higher education institution, Tran and Do (2020) describes that working motivation is the desire and willingness of lecturers to strengthen their efforts towards the achievement of university goals.
Kinicki and Fugate (2018) stated that there are two kinds of work motivation for an employee, namely, extrinsic and intrinsic motivation. Extrinsic motivation is external factors, which influence employees, such as salaries, awards, promotions, and others. Meanwhile, intrinsic motivation comes from the willingness of these individuals without compulsion from others, including ideals, faith, and the like. This study synthesized work motivation as a person’s strength, which is formed by intrinsic and extrinsic motivation to work seriously and diligently to achieve organizational goals.
2.4. Employee Performance
The individual performance of employees in
an organization is conceptualized as actions and
behaviors that are under their control and contribute
to organizational goals (Rotundo, 2002). Moreover,
Ivancevich, Konopaske, and Matteson (2014) stated that
these individuals contribute to organizations through
quality, efficiency, and effectiveness. Organizations are
advised to continuously evaluate the performance of their
employees, and make policies regarding the performance
of those that do not meet the minimum standards. This is
because their performance has a significant impact on the ability of organizations to achieve their goals (McShane
& Glinow, 2018).
McShane and Glinow (2018) classified employee performance into Proficient, Adaptive, and Proactive Task Performance. The first is based on the ability to work efficiently and accurately, while the second works by aligning attitudes and mindsets towards change. Finally, the third, which is Proactive Task Performance, is based on the ability to use initiatives to take action that benefits the organization. Meanwhile, Pradhan and Jena (2017) classified this performance into Task, Adaptive, and Contextual Performance. The first involves being able to complete the work with high standards, while the second refers to the ability to adapt to job changes. Finally, the third, which is Contextual Performance in the form of Organizational Citizenship Behavior, talks about sincerely involved in work.
McShane and Glinow (2018) discovered that motivation, abilities, role understanding, and situational support affect employee performance. Furthermore, another study by Carlos and Rodrigues (2015) discovered that this performance is influenced by job knowledge, organizational skills, efficiency, persistent effort, coope- ration, organizational awareness, and interpersonal and relational skills. While a study by Nan, Chaiprasit and Pukkeeree (2018) showed that this performance depends on work and job quantity, and work time. Based on theoretical studies, the performance measurement variables in this study are employee behavior such as task, adaptive, and contextual performance that contributes to organi zational goals.
3. Research Method
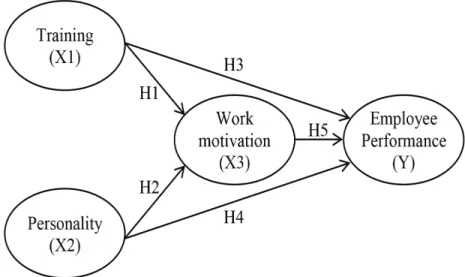
This causal quantitative research was conducted using Structural Equation Model analysis techniques, with the dependent variable (Y), namely, employee performance, and the independent variable (X), namely, training, personality, and work motivation. The relationship between these variables is depicted in Figure 1.
Based on the research model, the following hypotheses were established:
H1: Training (X1) has a positive direct effect on work motivation (X3)
H2: Personality (X2) has a positive direct effect on work motivation (X3)
H3: Training (X1) has a positive direct effect on employee performance (Y)
H4: Personality (X2) has a positive direct effect on employee performance (Y)
H5: Work motivation (X3) has a positive direct effect on employee performance (Y)
The above five hypotheses were tested at an institution that supervises the quality of higher education, namely, the Educational Quality Assurance Institute (LPMP) in Banten Province, Indonesia, which had a population of 122.
Referring to the Slovin formula a population with an error rate of 5% requires a minimum of 94 respondents as the source of data. The questionnaire was used to obtain the primary data based on variables of training, personality, work motivation, and employee performance.
Figure 1: Research Model
Training variables were tested through nine question items adapted from Aziz (2015) for indicators of increasing knowledge, individual competence, and teamwork, while, those of personality were tested through 10 questions adapted from Yang and Hwang (2014) for indicators of friendliness, conscience, emotional stability, extraversion, and self-disclosure. Besides, work motivation variables were tested through eight questions adapted from Gagné et al. (2010) for indicators of intrinsic and extrinsic motivation. Meanwhile, that of employee performance was tested through nine question items adapted from Pradhan and Jena (2017) for indicators of the task, adaptive, and contextual performance.
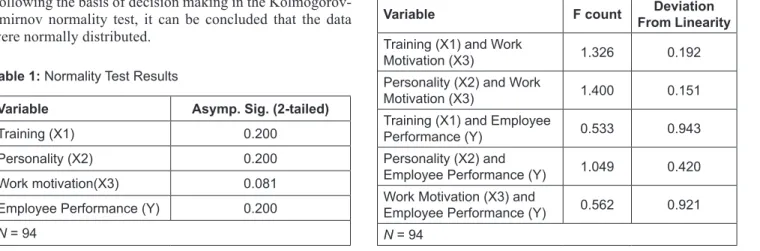
Inferential analysis was carried out before the correlation between variables that answer the hypothesis was tested. This analysis consisted of a normality test, which was conducted using the Kolmogorov-Smirnov approach to ensure that the data was obtained from a normally distributed population and a linearity test, which determined the significant linear relationship between the two variables. Hypothesis testing was carried out through a simultaneous/F test to determine the significant effect of all independent variables on the dependent variable and a partial/t-test to analyze the effect.
4. Data Analysis and Findings 4.1. Normality Test
Data from questionnaires were tested first for the normality of the distribution. Table 1 shows the results of the normality test using the Kolmogorov-Smirnov approach.
The results of the normality test shown in Table 1 indicated that Asymp. Sig (2-tailed) for all variables were greater than the required minimum α value of 0.05.
Following the basis of decision making in the Kolmogorov- Smirnov normality test, it can be concluded that the data were normally distributed.
4.2. Linearity Test
Before testing the hypothesis it was necessary to carry out a linearity test to determine whether the two variables have a significant linear relationship or not. Table 2 shows the results of the linearity test for the relationship between variables.
The results of the test as shown in Table 2 show that the value
of F
countfor all the relationships between variables was smaller
than F
table(0.05; 20; 72), which was 1.718. Furthermore, the deviation value of all relationships between variables was also greater than 0.05. Based on these two references, it can be concluded that there was a linear relationship between each variable.
4.3. F-Test and t-Test
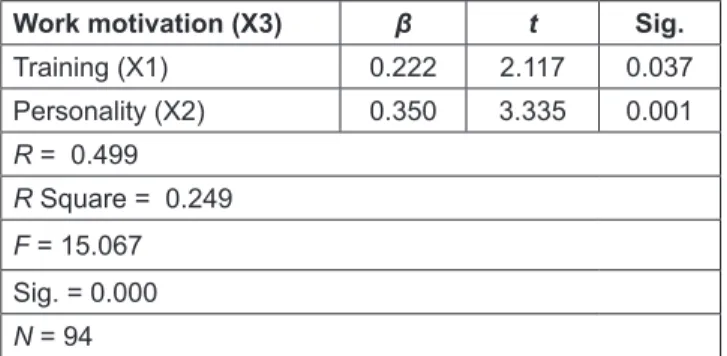
The simultaneous test was conducted to determine the significant effect of all independent variables on the dependent variable. Based on the research model as shown in Figure 1, there were two relationship substructures, namely, Training (X1) and Personality (X2) on Work Motivation (X3), and Training (X1), Personality (X2), and Work Motivation (X3) on Employee Performance (Y).
Table 3 shows that the F
countvalue for the first sub-structure was 15.067, which means it was greater than the F
table (0.05; 2; 94-2)of 3.10 and the significance value was 0.000, which was smaller than 0.05. Therefore, simultaneously the Training variable (X1) and the Personality variable (X2) had a positive and significant direct effect on the Work Motivation variable (X3).
The value of R Square for the first substructure was 0.249, and this indicated that simultaneously the effect of Training (X1) and Personality (X2) on Work Motivation (X3) was 24.9%. Furthermore, this also indicated that there were 75.1% of factors other than training and personality that influenced work motivation.
Table 1: Normality Test Results
Variable Asymp. Sig. (2-tailed)
Training (X1) 0.200
Personality (X2) 0.200
Work motivation(X3) 0.081
Employee Performance (Y) 0.200
N = 94
Table 2: Linearity Test Results
Variable F count Deviation
From Linearity Training (X1) and Work
Motivation (X3) 1.326 0.192
Personality (X2) and Work
Motivation (X3) 1.400 0.151
Training (X1) and Employee
Performance (Y) 0.533 0.943
Personality (X2) and
Employee Performance (Y) 1.049 0.420 Work Motivation (X3) and
Employee Performance (Y) 0.562 0.921 N = 94
The t count of the first substructure for each predictor variable was 2.117 and 3.335, both of which were greater than the t-
table (0.05 / 2; 94-2-1)of 1.990. Furthermore, the significance value of each variable was 0.037 and 0.001, both of which were less than 0.05. This showed that partially the Training (X1) and Personality value (X) both had a positive and significant effect on the Work Motivation variable (X3).
The results of the F-test and t-test for the first substructure reinforced the fact that both simultaneously and partially, training and personality can be used as predictor variables for work motivation. When the residual value for work motivation is calculated by the formula
e1 =1 0 249.
0 867.
and the β value for X1 is 0.222 and X2 is 0.350 then the empirical causal effect for the first substructure can be written in the form of the equation Y = 0.222 . X
1+ 0.350 . X
2+ 0.867. e
1.
Table 4 shows that the value of F
countfor the second substructure was 33.577, which means that it was greater than the F
table(0.05; 3; 94-3)of 2.70 and the significance value was 0.000 which was smaller than 0.05. Therefore, simultaneously the independent variables (X1-3) had a positive and significant direct effect on the Employee Performance variable (Y).
The value of R Square for the second substructure was 0.528, which indicated that simultaneously the effect of the independent variables (X1-3) on Employee Performance (Y) was 52.8%. This showed that there were 47.2% factors other than training, personality, and work motivation that affected employee performance.
The t count value of the second substructure for each predictor variable was 3.496, 2.143, and 4.997, and they were greater than the t-
table value (0.05 / 2; 94-3-1)of 1.990. Furthermore, the significance values of each variable were 0.001, 0.035, and 0.000, all of which were smaller than 0.05. This showed that independent variables (X1, X2, X3) had a positive and significant effect on the employee performance variable (Y).
The results of the F-test and t-test for the second sub- structure reinforced the fact that both simultaneously and partially, training, personality, and work motivation can be used as predictor variables for employee performance.
When the residual value for employee performance is calculated by the formula e2 =
1 0 528.0 687.
and the β value for X1 is 0.299, X2 is 0.190, and X3 is 0.417, then the empirical causal effect for the second substructure can be written in the form of the Y equation = 0.299. X
1+ 0.190 . X
2+ 0.417. X
3+ 0.687. e
2.
5. Discussion and Implications
5.1. Effect of Training on Work Motivation
Rasheed, Humayon, Awan, and Ahmad (2014) discovered that the addition of knowledge and skills through proper training are one of the main factors that motivate employees.
This finding was evidenced in this study and supported the hypothesis (H1) that there is a positive direct effect of training (X1) on work motivation (X3). Higher education institutions need to provide training to their employees to increase their work motivation to complete. Umar, Tamsah, Mattalatta, Baharuddin, and Latief (2020) also posited that training- effectiveness could directly encourage growth in soft skills competence, employee creativity, and team performance.
5.2. The Influence of Personality on Work Motivation
The results of the various tests supported the hypothesis (H2) that there is a positive direct effect of personality (X2) on work motivation (X3). This finding was supported by Mahlamäki, Rintamäki, and Rajah (2018) who believed that personality traits are the basis for building work motivation.
Similarly, Furnham, Eracleous, and Premuzic (2009) proved that personality was significantly related to work motivation.
Therefore, higher education institutions need to ensure that the quality of the personality of their employees is relevant to organizational goals because personality encourages responsible work motivation.
Table 3: Substructure F-Test 1
Work motivation (X3) β t Sig.
Training (X1) 0.222 2.117 0.037
Personality (X2) 0.350 3.335 0.001
R = 0.499 R Square = 0.249 F = 15.067 Sig. = 0.000 N = 94
Table 4: Substructure F-Test 2
Employee Performance (Y) β t Sig.
Training (X1) 0.299 3.496 0.001
Personality (X2) 0.190 2.143 0.035
Work motivation (X3) 0.417 4.997 0.000
R = 0.727 R Square = 0.528 F = 33.577 Sig. = 0.000 N = 94
5.3. Effect of Training on Employee Performance The hypothesis (X3) in this study can be accepted that training has a positive effect on employee performance.
This is because it was believed that training improves the performance of employees in universities. This finding was also supported by Cobblah and Walt (2016) as they argued that training programs contribute to increasing employee knowledge, skills, abilities, and experience, making them both efficient and effective at work. Sopiah, Kurniawan, Nora, and Narmaditya (2020) also emphasizes that training program in talent management has a positive effect on employee performance. That research on nurses in Indonesia, although has a different profession of the respondents, produced similar finding with this study.
5.4. The Influence of Personality on Employee Performance
Yang and Hwang (2014) stated that personality is related to employee performance. Furthermore, according to Bakker, Tims, and Derks (2012), employees that have a proactive personality tend to stay engaged in work and perform efficiently. This supported the hypothesis (X4) that personality has a positive direct effect on employee performance. Therefore, higher education institutions should pay attention to the personality of their employees to get positive performances from them.
5.5. The Effect of Work Motivation on Employee Performance
Paais and Pattiruhu (2020) found that work motivation has a positive and significant effect on performance, but does not have a significant effect on job satisfaction. Although motivation is a driving factor for improving employee performance, they also encourage the role of the leader to change the organizational atmosphere to be more optimal and professional.
In this study, employee performance in higher education institutions depends on their work motivation. This fact was obtained when the test results accepted the hypothesis (X5) that work motivation has a positive direct effect on employee performance. Besides, this was in line with the findings of Caillier (2014) and Dysvik and Kuvaas (2013).
6. Conclusion
Employee performance in higher education was directly and positively influenced by training, personality, and work motivation. Moreover, training and personality simultaneously also affected this motivation. Higher education institutions are encouraged to provide training
for their employees, such as motivation training, as this encourages them to work sincerely and responsibly.
Furthermore, these institutions need to perfect the skills of these individuals according to their potentials because this can increase their self-confidence, which motivates them to work to achieve success. Higher education institutions are advised to create positive personalities in their employees because they can increase motivation and performance.
Also, higher education needs to build a sense of kinship as organizational culture. Close kinship with fellow employees makes them feel comfortable working and being loyal to the organization. Competency-based employee personalities need to be built through mindset, and attitude and behavior patterns that are under organizational values. Higher education arouses employee motivation by providing clarity of duties and responsibilities that needs to be achieved, assessing the results of their work, and giving appreciation for each achievement. Finally, healthy competition in an organization can motivate employees to perform better.
References
Aziz, S. F. A. (2015). Developing general training effectiveness scale for the Malaysian workplace learning. Mediterranean Journal of Social Sciences, 6(4), 47–56. https://doi.org/10.5901/
mjss.2015.v6n4s1p47
Bakker, A. B., Tims, M., & Derks, D. (2012). Proactive personality and job performance: The role of job crafting and work engagement. Human Relations, 65(10), 1359–1378. https://doi.
org/10.1177/0018726712453471
Burger, J. M. (2019). Personality (10th ed.). Boston, MA: Cengage Learning.
Caillier, J. G. (2014). Toward a better understanding of the relationship between transformational leadership, public service motivation, mission valence, and employee performance:
A preliminary study. Public Personnel Management, 43(2), 218–239. https://doi.org/10.1177/0091026014528478
Carlos, V., & Rodrigues, R. G. (2015). Development and validation of a self-reported measure of job performance. Social Indicators Research, 126(1). https://doi.org/10.1007/s11205-015-0883-z Cobblah, M. A., & Walt, T. B. V. (2016). Staff training and
development programmes and work performance in the university libraries in Ghana. Information Development, 33(4), 375–392. https://doi.org/10.1177/0266666916665234
Colquitt, J. A., Lepine, J. A., & Wesson, M. J. (2019). Organizational Behavior: Improving Performance and Commitment in the Workplace (6th ed.). New York, NY: McGraw-Hill.
Dessler, G. (2017). Human Resource Management (15th ed.).
Boston, MA: Pearson Education.
Dysvik, A., & Kuvaas, B. (2013). Intrinsic and extrinsic motivation as predictors of work effort: The moderating role of achievement goals. British Journal of Social Psychology, 52(3), 412–430.
https://doi.org/10.1111/j.2044-8309.2011.02090.x
Feist, J., & Feist, G. J. (2008). Theories of Personality (7th ed.).
New York, NY: McGraw-Hill.
Furnham, A., Eracleous, A., & Premuzic, T. C. (2009). Personality, motivation and job satisfaction: Hertzberg meets the Big Five.
Journal of Managerial Psychology, 24(8), 765–779. https://doi.
org/10.1108/02683940910996789
Gagné, M., Forest, J., Gilbert, M. H., Aubé, C., Morin, E., & Malorni, A. (2010). The motivation at work scale: Validation evidence in two languages. Educational and Psychological Measurement, 70(4), 628–646. https://doi.org/10.1177/0013164409355698 Ivancevich, J. M., Konopaske, R., & Matteson, M. T. (2014).
Organizational Behavior and Management (10th ed.). New York, NY: McGraw-Hill.
Jones, G. R., & George, J. M. (2015). Essentials of Contemporary Management (10th ed.). New York, NY: McGraw-Hill.
Kinicki, A., & Fugate, M. (2018). Organizational Behavior A Practical, Problem-Solving Approach Second Edition (2nd ed.). New York, NY: McGraw-Hill.
Mahlamäki, T., Rintamäki, T., & Rajah, E. (2018). The role of personality and motivation on key account manager job performance. Industrial Marketing Management, 83, 174–184.
https://doi.org/10.1016/j.indmarman.2018.11.013
Mathis, R. L., & Jackson, J. H. (2010). Human Resource Management (13th ed.). Mason, HO: Cengage Learning.
McShane, S. L., & Glinow, M. A Von. (2018). Organizational Behavior: Emerging Knowledge. Global Reality (8th ed.). New York, NY: McGraw-Hill.
Nan, K. N., Chaiprasit, K., & Pukkeeree, P. (2018). Factor analysis- validated comprehensive employee job performance scale.
International Journal of Quality and Reliability Management, 35(7). https://doi.org/10.1108/IJQRM-06-2017-0117
Nguyen, Q. L. H. T. T., Nguyen, D. V., Chu, N. N. M., & Tran, V. H. (2020).
Application of Total Quality Management in developing quality assessment model: The case of Vietnamese higher education.
Journal of Asian Finance, Economics and Business, 7(11), 1049–1057. https://doi.org/10.13106/jafeb.2020.vol7.no11.1049 Paais, M., & Pattiruhu, J. R. (2020). Effect of motivation, leadership,
and organizational culture on satisfaction and employee
performance. Journal of Asian Finance, Economics and Business, 7(8), 577–588. https://doi.org/10.13106/jafeb.2020.
vol7.no8.577
Pradhan, R. K., & Jena, L. K. (2017). Employee performance at workplace: Conceptual model and empirical validation.
Business Perspectives and Research, 5(1), 1–17. https://doi.
org/10.1177/2278533716671630
Rasheed, M. I., Humayon, A. A., Awan, U., & Ahmad, A. D.
(2014). Factors affecting teachers’ motivation: An HRM challenge for public sector higher educational institutions of Pakistan (HEIs). International Journal of Educational Management, 30(1), 101–114. https://doi.org/10.1108/IJEM- 04-2014-0057
Robbins, S. P., & Judge, T. A. (2017). Organizational Behavior (17th ed.). New York, NY: Pearson Education.
Rotundo, M. (2002). The relative importance of task, citizenship, and counterproductive performance to global ratings of job performance: A policy-capturing approach. Journal of Applied Psychology, 87(1), 66–80. https://doi.org/10.1037/0021-9010.
87.1.66
Sopiah, S., Kurniawan, D. T., Nora, E., & Narmaditya, B. S. (2020).
Does talent management affect employee performance?:
The moderating role of work engagement. Journal of Asian Finance, Economics and Business, 7(7), 335–341. https://doi.
org/10.13106/jafeb.2020.vol7.no7.335
Tran, T. T., & Do, Q. H. (2020). Factors affecting job motivation among faculty members: Evidence from Vietnamese public universities. Journal of Asian Finance, Economics and Business, 7(9), 603–611. https://doi.org/10.13106/jafeb.2020.
vol7.no9.603
Umar, A., Tamsah, H., Mattalatta, M., Baharuddin, B., & Latief, A. (2020). Training-effectiveness and team-performance in public organization. Journal of Asian Finance, Economics and Business, 7(11), 1021–1031. https://doi.org/10.13106/
jafeb.2020.vol7.no11.1021
Yang, C. L., & Hwang, M. (2014). Personality traits and simultaneous reciprocal influences between job performance and job satisfaction. Chinese Management Studies, 8(1), 6–26.
https://doi.org/10.1108/CMS-09-2011-0079