Progress in Superconductivity and Cryogenics
Vol.15, No.1, (2013), pp.25~28 http://dx.doi.org/10.9714/psac.2013.15.1.025
```
1. 서 론
Magneto optical Imaging(MOI) 시스템은 magneto-optical faraday effect의 원리를 이용하여 구현된 것으로 고온초전도체의 critical current density와 flux 분포를 이해하고 연구하는데 중요한 역할을 수행하였다.[1] MOI method는 Hall probe method와 더불어 초전도체 내부의 flux와 critical current density의 분포를 알 수 있는 대표적인 연구 방법 중 하나이다. Hall probe 측정은 대부분 probe에 보호층이 있기 때문에 시료 표면의 자기장을 바로 분석하지 못하며 시료와 최대한 가깝게 움직여야 하기 때문에 시료 표면 상태의 영향을 받는 단점이 있다.[2],[3] 이에 비해 빛을 이용하여 시료 표면에서의 자기장 값을 직접 알 수 있는 MOI method는 효율적으로 높은 해상도를 얻을 수 있다는 장점이 있다.
CCD
LED source
pumping
LN polarizer
analyzer
magnet magnet
Indicator on superconducting film
B
COM
He gas
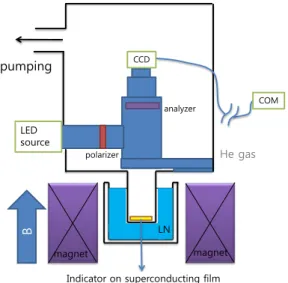
Fig. 1. Schematic of MOI measurement system.
* Corresponding aurhor: [email protected]
본 연구에서는 MOI 측정 장비에 대한 간단한 설명과 MO image를 수치적으로 처리하는 방법을 설명하고자 한다. 실 험에 사용된 샘플은 BZO rod pinning center가 c축으로 13도 기울어져 성장된 YBCO 시료이다.
2. Magneto-optical Imaging 측정 장비 Fig 1.은 MOI측정 장치 개략도이다. 진공챔버에는 LED 램프 광원 및 CCD카메라(Moticcam 2300)와 polarizer가 있다. 그리고 자기장의 방향을 조절할 수 있는 원형 자석이 있다. 챔버 바닥에 원기둥 모양의 구멍이 있는 곳에 MO film과 초전도 박막을 놓는다. 챔버 내에 헬륨가스를 흘려보내주고, 샘플 주위를 액체질소에 담궈 냉각한다.
샘플 위에는 Faraday effect를 이용하는 MO film(Bi-YIG/Al/GGG)이 놓인다. 자기장에 반응하는 Bi-YIG층을 샘플에 접촉시켜 샘플 표면의 자기장을 관측할 수 있다.
3. MO image의 자기장 변환
측정된 데이터는 CCD에 의해 광신호 형태로 얻어져 디지털 신호로 바뀌게 된다. 이렇게 기록된 디지털 전자 신호와 컴퓨터에 의한 image processing을 통하여 초전도체 표면에서의 magnetic flux density 분포를 자세하고 정량적인 분석이 가능하다.[4] 하지만 그전에 빛의 세기를 자기장 값으로 변환하기 위해 빛의 세기와 자기장 사이의 관계식을 구해야 한다. 초전도가 깨진 상태인 약 100K에서 외부 자기장의 세기를 일정한 간격으로 변화시켜 calibration할 background data를 얻는다.
이상적으로 system을 구축하여 편광 vector의 변형에 영향을 주지 않고, polarizer, MO film, analyzer를 통과한 빛의 경우, 다음과 같은 Malus law를 따르게 된다.
θF
I
I≈ 'sin2 (1)
Data processing technique for data measured in MO image measurement system
a Korea Advanced Institute of Science and Technology, Daejeon, Korea
b Chonbuk National University, Jeonju, Korea
(Received 28 February 2013; revised 14 March 2013; accepted 15 March 2013)
Abstract
We report processing technique in the MO image measurement system. Calibration procedure is not only considered to perpendicular field but also in-plane field. Current density and field profiles are obtained by Biot-savart law and inversion method.
We show example of (Gd,Y)1Ba2Cu3O7-δ-BaZrO3 film that have tilted nano rod pinning centers about 13° from the c-axis.
keywords: MO image, data processing technique
Wongi Leea, Hyoyeon Leea, Jaeun Yoo*,b, and Dojun Youma
Data processing technique for data measured in MO image measurement system
Fig. 2. Intensity of the perpendicular magnetic field Bz.
I'은 두께 d, 흡수계수 γ를 가지는 MO film에 의해 반사된 빛의 세기를 나타내며, θF는 Faraday rotation angle이다. MO indicator 필름은 수직 자기장뿐만 아니라 수평 자기장에도 반응하며 θF는 다음 관계식에 비례한다.
(
A zx)
2 2zF B B B
q B
θ ∝ = + + (2)
Bz는 수직 자기장, Bx는 수평 자기장, 그리고 Bz는 이방성 자기장이다. 평형상태인 100K에서 Bx와 Bz를 가하여 빛의 세기를 측정한 뒤 fitting곡선을 구하여 MO film의 BA를 구할 수 있다. Fig 2.는 BZO 피닝이 첨부된 YBCO 시료를 에 따른 빛의 세기를 측정하고 fitting한 것이다. 실험에 사용된 샘플의 경우 약 BA =90±1mT로 나타났다.
t x-axis y-axis z-axis
h
x x’
plane of observation R
Fig. 3. The geometry of the inversion method.
4. Inversion method
일차원 inversion 문제는 오랫동안 많은 사람들이 연구해왔다. 본 연구에서는 Biot-savart law를 수치적으로 풀었던 Johansen의 방법을 사용하였으며 간단히 설명하면 다음과 같다.[4] Fig 3.과 같이 x-y평면에 놓인 두께 t의 planar sheet에 전류가 흐른다고 가정하면 전류로부터 생성되는 자기장은 x-z plane에 놓여있게 된다. 샘플 두께가 샘플 표면과 MO film 과의 거리보다 충분히 얇다면 current distribution은 1차원으로 처리할 수 있다. 시료의 특정부분에서의 전류값 J
( )
xdx 로부터 x'만큼 떨어진 곳에서의 수직 magnetic flux값은 다음과같다.
( )
R x x R
dx x J π
dBz μ '
20
= − (3)
여기서 R= h2+
(
x− 'x)
2 이다. 이를 모든 전류에 대해 적분한 후, integral kernel의 fourier 변환함수를 Hanning window filtering 함수를 추가하면, inversion formula를 다음과 같이 구할 수 있다.0G↑
39G↑
182G↑
461G↑
301G↓
179G↓
-223G↓
-458G↓
(a) (b)
Fig. 4. MO images (a) when applied magnetic field up, (b) when applied magnetic field down.
26
( )
( ) ( )
( )
[ ] [ ( ) ]
( )
[ ] [ ( ) ]
( )
' 1' 1
'
1 1 1 ' ' 1 1
' 2 2 2 2
' 2 2
2 2
' 0
n B n
n d n n d
e n
n d
n n d
e n
J μ
z
n n n πd
d π n n
×
−
− + +
− +
− +
−
− + +
− +
−
−
=
∑
−−
(4)
여기서 n ≡x/Δ , n ≡' x/'Δ , d ≡h/Δ , 그리고 K
π /
Δ ≡ 이며 K는 cut-off frequency를 나타낸다.
본 연구에서 사용된 샘플은 두께 t가 1 μm , 그리고 샘플표면과 MO film간 거리 h가 100nm이다. h는 MO film이 샘플에 완전히 밀착했다고 가정하고, TEM을 통해 샘플의 보호막 두께로 결정한다. MO film이 완전히 밀착되지 않아 h가 불균일할 경우 위치에 따른 MO image의 선명도 차이가 발생하므로 균일도를 판단할 수 있다.
5. 결 과
MO image를 수치적으로 계산하기 위해서 식 (2)를 통해 intensity에 따른 Bx, Bz 값을 구하고 inversion method를 사용하여 current density를 구한다. Current
density를 Biot-savart 법칙을 이용하여 Bx를 구하고 식 (2)를 통하여 다시 Bz를 구한다. 이 과정을 iteration하면 magnetic fulx와 current density 값이 수렴하게 된다.
YBCO 시료에 외부자기장을 0G부터 600G까지 증가시킨 후 -600G까지 단계적으로 감소시켰다.
Fig 4.는 외부 자기장 변화에 따른 MO images를 나타낸 것이다. 자기장을 0에서 600G 까지 증가시킬 때에 샘플의 내부에 Meissner 영역이 형성되고 자기장을 더욱 증가시킴에 따라 Meissner 영역이 줄어들다가 Meissner 영역이 사라진다. 자기장을 감소시키면 볼텍스가 모두 빠져나가게 되고 안티 볼텍스가 외부에서 침투하게 된다.
Fig 5. (a)는 시료에 수직으로 외부자기장을 0G 로부터 600G 까지 증가시켰을 때의 magnetic flux profile이고, fig 5. (b)는 외부자기장을 감소시켰을 때의 magnetic flux profile이다. 시료의 폭은 3mm이다. 자기장을 증가시켰을 때 시료의 가장자리에서 자기장의 세기가 가장 강하며, 시료 내부로 들어올수록 침투하는 자기장의 세기가 점차 줄어들면서 Meissner 영역이 존재하는 것을 볼 수 있다.
자기장을 더 증가시키면 Meissner 영역은 사라지고 초전도체는 critical state에 놓여지게 된다. 자기장의 세기가 가장 약한 지점인 x0 값은 시료 중앙에서 약간 오른쪽으로 치우쳐져 있다. 증가된 외부자기장을 감소시키자 시료 가장자리에서의 자기장 값이 급격하게 줄어들게 되며, 약 1mm 영역에서 자기장이 trap된 영역이
-2 0 2
0 200 400 600
Bz(x) (G)
x (mm)
-2 -1 0 1 2
-300 -200 -100 0 100 200 300
J(x) (A/cm)
x (mm)
-2 0 2
0 200 400 600
Bz(x) (G)
x (mm)
-2 -1 0 1 2
-300 -200 -100 0 100 200 300
J(x) (A/cm)
x (mm) Sample edge
x
0x
0(c) (d)
(a) (b)
x
0Fig. 5. Bz and J profiles (a) Bz profile when applied magnetic field up, (b) Bz profile when applied magnetic field down, (c) J profile when applied magnetic field up, (d) J profile when applied magnetic field down.
27
Wongi Lee, Hyoyeon Lee, Jaeun Yoo, and Dojun Youm
Data processing technique for data measured in MO image measurement system
나타남을 볼 수 있다. 또한 외부자기장을 감소시킴에 따라 x0의 위치가 왼쪽으로 이동하는 것을 볼 수 있다. 이는 rod pinning center가 c축과 13도 기울어져 성장되었기 때문에 나타난 것으로 자세한 분석은 선행연구에서 이루어졌다.[5]
Fig 5. (c)는 시료에 수직으로 외부자기장을 0G 로부터 600G 까지 증가시켰을 때의 current profile이고 fig 5.
(d)는 외부자기장을 감소시켰을 때의 current profile이다.
Current 값은 어느 순간까지 증가되다가 다시 감소하게 되는데, 이 추세는 critical state 영역에서도 이어지는 것을 확인할 수 있다. 실험으로 얻은 current profile은 Brandt의 계산으로부터 얻은 current profile과 유사하나,
( )
x J( )
x constantJ = c = 를 가정한 Brandt의 경우와는 차이가 있다. Current profile에서 시료의 가운데 부분에서 이 되는 지점을 값으로 정할 수 있다. rod pinning center에 의해 자기장을 증가시킬 때 x0 가 오른쪽으로 치우쳐 있으며, 외부 자기장을 감소시키면 x0 가 왼쪽으로 이동하는 것을 확인할 수 있다.
6. 결 론
MO 이미지 데이터 처리 기술을 만들었다. 수직 자기장 뿐만 아니라 수평 자기장까지 고려하여 calibration을 하였다. Biot-savart law와 Johansen의 inversion method를 이용하여 magnetic flux profile과 current profile을 얻었다. (Gd,Y)1Ba2Cu3O7-δ-BaZrO3 시료를 사용하여 MO image를 얻었으며, Brandt model과 비슷한 경향성을 가진 profile을 구하였다.
ACKNOWLEDGMENT
이 논문은 2012년도 정부(교육과학기술부)의 재원으로 한국연구재단의 기초연구사업 지원을 받아 수행된 것임 (2012R1A1A2008745) (NRF-2011-R1A4A003-2011-0013170).
REFERENCE
[1] Ch. Jooss, J. Albrecht, H. Kuhn, S. Lenhadt and H. Kronmuller,
“Magneto-optical studies of current distributions in high-Tc superconductors”, Rep. Prog. Phys. 65, 651 (2002).
[2] Jaeun Yoo, Yonghwan Jung, Jaeyoung Lee, Sunme Lim, SangMoo Lee, YeHyun Jung, Dojun Youm, HosupKim, HongSoo Ha and Sangsoo Oh, “Scanning Hall probe measurements of field distributions of a coated conductor under applied fields”, Supercond. Sci. Technol. 19, 1291 (2006).
[3] J. Yoo, K. Kwak, J. Rhee, C. Park, D. Youm, B. J. Park, and Y. H.
Han, “Estimation of hysteresis loss in Sm1Ba2Cu3O7− δ coated conductor via scanning Hall probe measurements with simultaneously applied field and current”, Supercond. Sci. Technol.
22, 04500 (2009).
[4] T. H. Johansen, M. Baziljevich, H. Bratsberg, and Y. Galperin, P. E.
Lindelof, Y. Shen and P. Vase, “Direct observation of the current distribution in thin superconducting strips using magneto-optic imaging”, Phys. Rev. B 54, 16294 (1996).
[5] Y Jung, K Kwak, W Lee, J Rhee, D Youm, J Yoo, Y H Han, and B J Park, “Effects of the vortex line shape on the critical current density in high Tc superconducting film with nanorod pinning centers”, Supercond. Sci. Technol. 25, 065001 (2012).
28