Vol.19, No.2, (2017), pp.53~57 https://doi.org/10.9714/psac.2017.19.2.053
c```
1. INTRODUCTION
High temperature superconducting (HTS) 2G coated conductor (CC) tapes have been achieved many improvement in its current transport properties and acquired more demands in the field due to their significantly high power density [1, 2]. The major applications of CC tapes are the HTS power devices such as electrical power transmission cables, fault current limiters (SFCL), motors, and generators. Superconducting transmission lines with the used of large power cables are an innovative option to transfer large amount of energy, which are now being utilized as a part of the electric distribution grid and now constructed and enhanced up to its highest potential to transfer such energy [3]. The HTS cable system was intrinsically composed of HTS tapes including its constituent components, cooling system and electrical insulation [4, 5].
Due to the development of HTS tapes and its high demand for HTS device applications, insulation materials should also improve its characteristics suitable for different cryogenic applications so that can survive multiple thermal cycles between the room temperature (RT) and the cryogenic operating temperatures. And the dielectric designs have to minimize the mechanical stresses experiencing by the superconducting material [6,7]. Many studies on the evaluation of the mechanical and thermal properties of some insulation materials used in superconducting applications have recently been reported
[6-9]. Coefficient of thermal expansion (CTE) compatiblitiy of insulation materials with CC tapes is also necessary and it should be reliable so not to degrade the superconducting properties of the CC tapes under thermal contraction. In this manner, the compatibility of the thermal properties of each layer of the CC tapes enables the cable system to cool efficiently [10]. Thus, verification of the thermal compatibility of CC tapes to insulation materials adopted is important. On the other hand, the mechanical properties at cryogenic temperature are also necessary to determine its limitations, especially when designing a HTS cable system.
Understanding the different behavior of the insulation materials due to the anisotropy may lead in creating a new insulation system that can enhance the performance of the whole cable system. Therefore, in this study, both mechanical and thermal properties of insulation materials such as PPLP, Kapton, Cryoflex, and Teflon were characterized at RT and at liquid nitrogen temperature (77 K). They have different orientations of the machine direction (MD) and cross-machine direction (CD), respectively. The influences of the anisotropy of the samples on the properties were investigated.
2. EXPERIMENTAL PROCEDURES 2.1 Samples
Four different kinds of cryogenic insulation materials such as PPLP, Cryoflex, Kaption and Teflon were supplied for this study. PPLP is the polypropylene laminated paper
Evaluation of mechanical and thermal properties of insulation materials for HTS power devices at liquid nitrogen temperature
Hyung-Seop Shin
*,and Mark Angelo Diaz
a
Department of Mechanical Design Engineering, Andong National University, Andong, Kyungbuk, 36729 Korea
(Received 7 June 2017; revised or reviewed 20 June 2017; accepted 21 June 2017)
Abstract
In superconducting power devices including power cables in which high temperature superconducting (HTS) tapes are utilized, a reliable electrical insulation should be achieved for its maximum performance. For an efficient design of HTS superconducting devices, a comparative evaluation of the mechanical and thermal propperties for various insulation materials at cryogenic temperatures is required. Especially, in the process of the property evaluation of the sheet-shaped insulation materials, anisotropy according to the machining direction should be considered because the mechanical and thermal properties are significantly influenced by the sample orientation. In this study, the cryogenic thermal and mechanical properties of various insulation material sheets such as PPLP, Cryoflex, Teflon, and Kapton were determined considering sample orientation. All samples tested at cryogenic temperature showed significantly higher tensile strength as compared with that of room temperature. The ultimate tensile strength at both temperature conditions significantly depended upon the sample orientation. The thermal properties of the insulation materials exhibited a slight difference among samples depending on the orientation: for the PPLP and Cryoflex, the CD orientation showed larger thermal contraction up to 77 K as compared to the MD one. MD samples in PPLP and Cryoflex showed a lower CTE and thermal contraction which made it more promising as an insulation material due to its comparable CTE with HTS CC tapes.
Keywords: Insulation materials, Tensile failure load, Thermal contraction, Cryogenic temperature, Sample orientation
* Corresponding author: [email protected]
which is a composite insulator comprised of polypropylene ,PP laminated by Kraft papers. A polyethylene (PE) tape (Cryoflex™), which was developed by Ultera and used as a dielectric material in LN
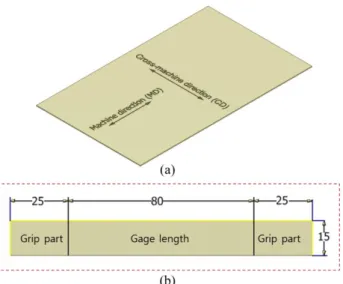
2cooled HTS cables [6]. A Polyimide HN-type sheet (Kapton™) is a general-purpose insulation material which was used over a wider temperature range. Finally, a polytetrafluoroethylene (PTFE) sheet (Teflon™) is widely used materials for various purposes. The material thickness of the single sheet was 100 μm and 90 μm (for PPLP and Cryoflex), and 120 μm and 160 μm (for Kapton and Teflon), respectively. Fig. 1 (a) shows a schematic for the designation of two orientations; the one having a length parallel to machine-direction (MD) and the other having a length parallel to cross-machine direction (CD). The specimen for testing was cut from commercially available insulation sheets with the dimensions of 130 mm and 15 mm for the length and width, respectively, using a razor sharp cutter, as shown in Fig. 1 (b). In the cases of PPLP, Cryoflex and Teflon samples, specimens are prepared with different orientation of MD and CD, respectively.
2.2 Mechanical properties measurement
The setup for mechanical property evaluation of insulation material samples is shown in Fig. 2. The specimen was fixed by gripping blocks at both ends. The upper grip was connected to the loadcell of the material testing machine used and the lower grip was set fixed on the loading frame. To prevent the slippage of the specimen during tensile loading, a sand paper (#800) was inserted on both sides at the gripping parts. Tensile load was applied to the specimen until fracture by a universal material testing machine (Shimadzu AG-IS, load cell capacitiy: 5 kN) [11].
A 25 mm Nyilas-type double extensometer was placed at the middle part of the specimen to measure the deformation induced in the insulation material during tension test [12]. It was connected to the signal conditioner (Kyowa, CDV-700, sampling rate: 500 kHz). The output voltage from the signal conditioner was used to measure the elongation occurred in the specimen. In order to prevent the damage caused at the edge part when the double extensometer is mounted on the flexible test piece, the mounting place of the specimen was wrapped with an aluminum foil, then the double extensometers were attached. For testing at cryogenic temperature, the specimen was submerged on a bath of liquid nitrogen (LN
2) and held for 10 min before applying the tensile load to keep thermal equilibrium within the specimen. The tension test was carried out at a constant ram rate of 5 mm/min.
In this study, the displacement from extensometer was used to derive both the elastic modulus, E and the yield strength, σ
yof each sample. The extensometer was removed after it reached the yield point. After removing the extensometer, the specimen was tested continuously until failure occured. Details on the derivation of mechanical properties of the specimen like percent strain, ε
fand the breaking stress, σ
fare described in reference [7].
2.3 Thermal properties measurement at 77 K
Fig.1(a) Orientation designation in insulation materials and (b) dimensions of specimen.
Fig. 2 Photograph of setup for tension testing of insulation material sheet at 77 K with attachment of double extensometers.
A similar setup was used to measure the coefficient of
thermal expansion (CTE) and the thermal contraction of
the insulation materials induced during cool down to 77 K
[9]. The upper end of the specimen was held by the upper
grip, and a deadweight was added to the lower part of
specimen to ensure vertical flatness of the specimen while
measuring thermal contraction. The measurement was
done by submerging the setup including the specimen into
liquid nitrogen bath. The contraction of the specimen was
measured using the same 25 mm Nyilas double
extensometers described on the previous section. The
output voltage from the signal conditioner was used to
calculate the CTE, as well as the thermal contraction of the
specimen.
The CTE and the thermal contraction of the specimen during cool down from RT to 77 K were calculated using the following formulas [9, 13]:
α =
∆VCF@T(L@RT)(∆T)
=
∆𝐿L@RT 1
∆𝑇
.
ε
thermal= α∆T =
∆LL@RT
=
L@RT−LTL@RT
where α is the CTE, ∆V is the output voltage change due to thermal contraction, CF
@Tis the calibration factor of the double extensometers at a specified temperature which is 77 K with a value of 0.1721 in this study, L
@RTis the initial length at RT which corresponds to the gauge length of the extensometer, and ∆T represents the temperature difference during cool down from RT to 77 K. ∆L is the change in specimen length during cool down which corresponds to ∆V/CF
@T, and L
@Tis the length measured at a specified temperature.
3. RESULTS AND DISCUSSION
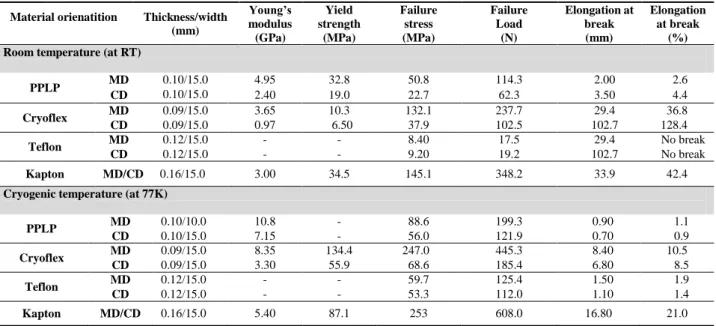
3.1 Mechanical properties at RT and 77 K
For the evaluation of mechanical properties of various insulation materials, the tension tests were performed for
each orientation of samples at RT and 77 K, repectively.
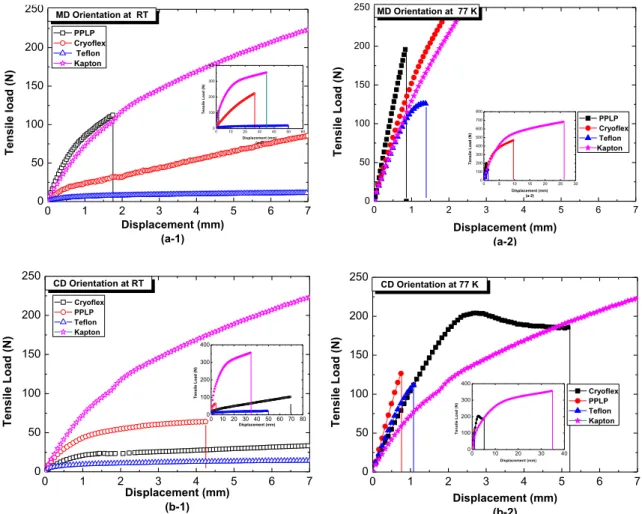
Fig. 3(a) and (b) show the load-displacement curves measured along MD and CD orientation for each insulation materials at RT and 77 K, respectively. Practically, all the samples at cryogenic temperature (77 K) exhibited higher tensile load in both MD and CD orientation, but showed smaller displacement compared to RT. The displacement breakage at RT in MD orientation decreased in the order Kapton→Cryoflex→Teflon→PPLP, on the other hand, in the CD orientation the sequence begins at Cryoflex
→Teflon→PPLP. In this study, Kapton considered to have only one orientation which is MD among the experiments.
At cryogenic temperature, the displacement breakage of specimens showed a significant reduction as compared with the ones at RT. The data gathered in this study agreed with the result in [6] that especially Teflon has significant reduction in the breakage displacement at 77 K.
The failure load at RT decreased in the order of Kapton
→Cryoflex→PPLP→Teflon both in CD and MD orientations. In the tensile failure load, the samples tested at cryogenic temperature also showed similar decreasing sequence both in MD and CD orientation. Kapton exhibited the highest failure load among the samples, Cryoflex being the second while Teflon and PPLP have the lower tensile failure load.
Considering the displacement at breakage and tensile
0 1 2 3 4 5 6 7
0 50 100 150 200
250 MD Orientation at RT
0 10 20 30 40 50 60
0 100 200 300 400
Tensile Load (N)
Displacement (mm) (a-2)
Tensile load (N)
Displacement (mm) (a-1)
PPLP Cryoflex Teflon Kapton
0 1 2 3 4 5 6 7
0 50 100 150 200 250
0 5 10 15 20 25 30
0 100 200 300 400 500 600 700 800
Tensile Load (N)
Displacement (mm) (a-2)
MD Orientation at 77 K
Tensile Load (N)
Displacement (mm) (a-2)
PPLP Cryoflex Teflon Kapton
0 1 2 3 4 5 6 7
0 50 100 150 200 250
0 10 20 30 40 50 60 70 80 0
100 200 300 400
Tensile Load (N)
Displacement (mm)
CD Orientation at RT
Tensile Load (N)
Displacement (mm) (b-1)
Cryoflex PPLP Teflon Kapton
0 1 2 3 4 5 6 7
0 50 100 150 200
250 CD Orientation at 77 K
0 10 20 30 40
0 100 200 300 400
Tensile Load (N)
Displacement (mm)
Tensile Load (N)
Displacement (mm) (b-2)
Cryoflex PPLP Teflon Kapton