Discrepancy between frequency domain optical coherence tomography and intravascular ultrasound in human coronary arteries and in a
phantom in vitro coronary model
In-Cheol Kim, Chang-Wook Nam⁎, Yun-Kyeong Cho, Hyoung-Seob Park, Hyuck-Jun Yoon, Hyungseop Kim, In-Sung Chung, Seongwook Han, Seung-Ho Hur, Yoon-Nyun Kim, Kwon-Bae Kim
Division of Cardiology, Department of Internal Medicine, Keimyung University Dongsan Medical Center, Daegu, Republic of Korea
a b s t r a c t a r t i c l e i n f o
Article history:
Received 16 January 2016 Accepted 4 July 2016 Available online 5 July 2016
Background: This purpose of this study is to evaluate, concomitantly with quantitative coronary angiography (QCA), the potential discrepancy between frequency domain optical coherence tomography (FD-OCT) and intra- vascular ultrasound (IVUS) measurements in a phantom coronary model and in human coronary arteries within and outside stented segments.
Methods: FD-OCT and IVUS images sequentially obtained from a phantom coronary model and 57 stented human coronary arteries were compared between each other and with QCA.
Results: Lumen area (LA) by IVUS was 10.1% larger (6.43 ± 0.09 mm2) while by FD-OCT was similar (5.78 ± 0.09 mm2) to actual phantom LA (5.72 mm2); IVUS vs. FD-OCT stent area (SA) was 4.2% larger. In human coro- nary artery, diameter by QCA was smaller than by IVUS and OCT in reference (by 10.5% and 3.5%, both pb 0.001) and stented (3.6%, p b 0.001; and 1.7%, p = 0.012) segments. IVUS vs. FD-OCT distal reference LA was significantly larger (6.19 ± 2.18 mm2vs. 5.49 ± 2.49 mm2, pb 0.001, respectively), and SA was numerically larger (7.42 ± 2.28 mm2vs. 7.22 ± 2.48 mm2, p = 0.059) with larger discrepancy in reference (11.3%) than stented (2.7%) segments. IVUS vs. FD-OCT correlation for diameter was significantly higher for stented than ref- erence segments (R2= 0.8670 vs. 0.7351, p = 0.047), while numerically higher for area (R2= 0.8663 vs. 0.7806, p = 0.157).
Conclusions: In phantom model and human coronary arteries, IVUS vs. FD-OCT measurements were larger, par- ticularly in non-stented than stented segments, and diameter was smaller by QCA vs. IVUS or FD-OCT. Despite undefined clinical significance, said discrepancy warrants consideration.
© 2016 The Authors. Published by Elsevier Ireland Ltd. This is an open access article under the CC BY-NC-ND li- cense (http://creativecommons.org/licenses/by-nc-nd/4.0/).
Keywords:
Frequency domain optical coherence tomography
Intravascular ultrasound Size discrepancy
1. Introduction
In coronary artery measurement to inform stent size selection and to optimize stent deployment during percutaneous coronary intervention (PCI), both intravascular ultrasound (IVUS) and optical coherence to- mography (OCT) have benefits over simple coronary angiography[1, 2]. However, studies have shown that IVUS depict significantly larger di- ameter and area compared to time domain (TD)-OCT with obstructive technique[3–5]and the more recent frequency domain (FD)-OCT with non-occlusive technique[5–7]. The size discrepancy between the modalities might interfere adequate stent sizing during the procedure.
This study evaluated, in conjunction with quantitative coronary angiog- raphy (QCA), the nature, magnitude and mechanism of the discrepancy
between FD-OCT and IVUS measurements in a phantom coronary model and in human coronary arteries both within and outside stented segments.
2. Material and methods
2.1. Study population— phantom model and human coronary artery
To evaluate accuracy of FD-OCT and IVUS measurements in vitro, cylindrical plastic coronary model with stent was used. Sirolimus-eluting stent (Cypher™ stent, Cordis, Johnson and Johnson, Miami Lakes, Florida, USA; 2.5 mm in diameter; 33 mm long) was implanted in a 2.70 mm lumen diameter plastic model using inflation for 30 s at a rated pressure of 16 atm.
The in vivo study retrospectively enrolled consecutive patients with coronary artery disease who had undergone percutaneous coronary intervention following standard pro- tocol with drug eluting stent implantation after which both FD-OCT and IVUS were per- formed. Inclusion criteria were complete pullback andN70% analyzable frames in both modalities[7]. Cases with 1. bifurcation lesions in which the side branch occupied more than 45° of the cross section; 2. poor FD-OCT or IVUS images due to heavy calcification or artifact; and 3. left main coronary lesion, were excluded to avoid other factors that might have an effect on measurement error and cause further size discrepancy of the
⁎ Corresponding author at: Division of Cardiology, Department of Internal Medicine, School of Medicine, Keimyung University Dongsan Medical Center, 56 Dalseong-ro, Junggu, Daegu 700-712, Republic of Korea.
E-mail address:[email protected](C.-W. Nam).
http://dx.doi.org/10.1016/j.ijcard.2016.07.080
0167-5273/© 2016 The Authors. Published by Elsevier Ireland Ltd. This is an open access article under the CC BY-NC-ND license (http://creativecommons.org/licenses/by-nc-nd/4.0/).
Contents lists available atScienceDirect
International Journal of Cardiology
j o u r n a l h o m e p a g e :w w w . e l s e v i e r . c o m / l o c a t e / i j c a r d
the coronary ostium. The location of the catheter transducer was documented at the initi- ation of pullback with angiography.
2.3. Post-stenting FD-OCT and IVUS image analysis
Quantitative FD-OCT and IVUS analyses were performed by two independent experi- enced analysts. IVUS images were analyzed with commercially available software (echoPlaque, Indec Systems, Mountain View, California), and FD-OCT images with LightLab OCT imaging proprietary software (LightLab Imaging). Post-stenting images were analyzed at 1 mm intervals for 5 mm within the stent starting from its distal edge.
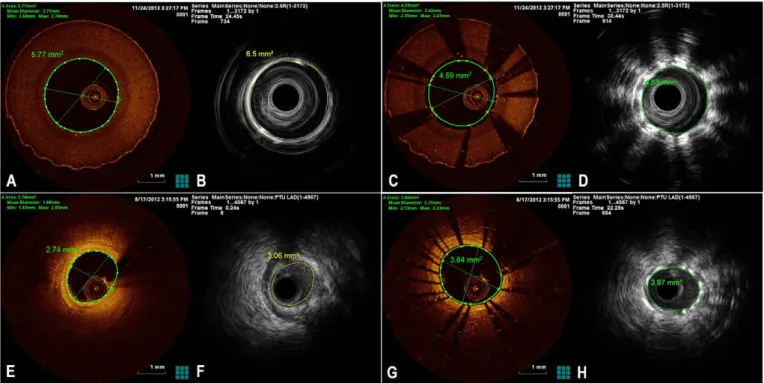
Measurements of the distal native vessel were also performed at 1 mm intervals for 5 mm length starting from thefirst segment outside the distal stent edge. All FD-OCT im- ages were matched with corresponding IVUS images according to the distance from the distal stent edge. To quantify size discrepancy between the FD-OCT and IVUS measure- ments, relative difference percentage [(IVUS measurement value− FD-OCT measurement value) divided by IVUS measurement value] was calculated and compared with previous studies[5]. Representative cases of phantom and human coronary artery measurements are displayed inFig. 1.
2.4. Post-stenting quantitative coronary analysis
To compare FD-OCT and IVUS measured mean and QCA diameters, post-stenting cor- onary angiograms were analyzed using Clinical Measurements Solutions system (CAAS 5.7 QCA system, Pie Medical, Maastricht, The Netherlands). The automatic edge detection pro- gram determines the vessel contours by assessing brightness along scan lines perpendic- ular to the vessel center. Post-stenting QCA was performed retrospectively by an independent analyst supervised by an expert physician. Best image at end-diastolic frame was selected to measure, well visualizing stent site and distal reference lumen
as a Bland–Altman plot depicting the difference between each pair of measurements in the y-axis and the average of both techniques in the x-axis with reference lines for the mean difference. The correlation coefficients among FD-OCT, IVUS and QCA were compared using the Fisher r-to-z transformation. Inter-observer agreement and intra- observer agreement were estimated for both FD-OCT and IVUS measurements. Inter- observer agreement was analyzed by blind measurement from two independent ob- servers. To assess intra-observer agreement, independent analysis was blindly performed twice by one of the observers.
3. Results
3.1. Phantom coronary model
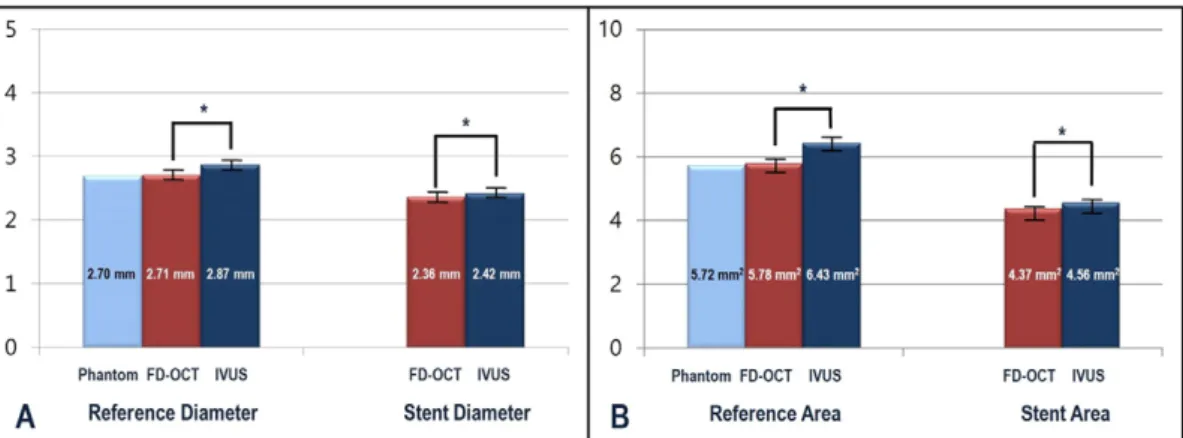
FD-OCT showed similar lumen diameter (LD) (phantom 2.70 mm vs. FD-OCT 2.71 ± 0.02 mm) and lumen area (LA) (phan- tom 5.72 mm2vs. FD-OCT 5.78 ± 0.09 mm2) as actual phantom size in the reference segment. In contrast, IVUS measurements were larger for LD (2.87 ± 0.02 mm, pb 0.001), and LA (6.43 ± 0.09 mm2, p = 0.001) when compared to FD-OCT measurements. In the stented segment, stent diameter (SD) measured by IVUS was larger than that measured by FD-OCT (FD-OCT 2.36 ± 0.04 vs. IVUS 2.42 ± 0.04, pb 0.001), as was stent area (SA) (FD-OCT 4.37 ± 0.12 vs. IVUS 4.56 ± 0.15, pb 0.001) (Fig. 2A and B).
Fig. 1. Representative images of FD-OCT and IVUS at the same segment of phantom reference (A and B), phantom stent (C and D), human coronary artery (E and F), and human coronary artery with stent (G and H).
3.2. Human coronary arteries
Among 57 patients (mean age, 65 years; 65% male), each of 285 matched images from 5 mm distal stent segments and 5 mm distal ref- erence segments were investigated. Left anterior descending artery (LAD) was most commonly treated (73.7%). In human coronary arteries, IVUS depicted larger diameter than FD-OCT in the distal reference seg- ment (2.77 ± 0.49 mm vs. 2.57 ± 0.60 mm, pb 0.001) and in the stented segment (3.05 ± 0.45 mm vs.2.99 ± 0.49 mm, p = 0.003).
The difference in mean diameter was more prominent in the distal reference segment (7.2%) than in the stented segment (2.0%). When compared with IVUS and FD-OCT measured diameter, QCA measured diameter in the reference segment (2.48 ± 0.57 mm) was smaller than that by IVUS by 10.5% (p b 0.001) and by OCT by 3.5%
(pb 0.001). In the stented segment, QCA measured diameter (2.94 ± 0.50 mm) was smaller than IVUS by 3.6% (pb 0.001) and OCT by 1.7%
(p = 0.012) (Fig. 3A). Mean distal reference LA by IVUS measurement was also significantly larger than by FD-OCT (6.19 ± 2.18 mm2vs.
5.49 ± 2.49 mm2, pb 0.001). Mean SA was numerically larger by IVUS measurement as compared with FD-OCT measurement (7.42 ± 2.28 mm2vs. 7.22 ± 2.48 mm2, p = 0.059). The difference in mean area by FD-OCT and IVUS measurements was more pronounced at the reference (11.3%) than stented (2.7%) segments (Fig. 3B). Bland–Altman plot showed greater difference between FD-OCT and IVUS measure- ments at the reference than stented segments (Fig. 4). In addition, cor- relation between FD-OCT and IVUS measurements was significantly
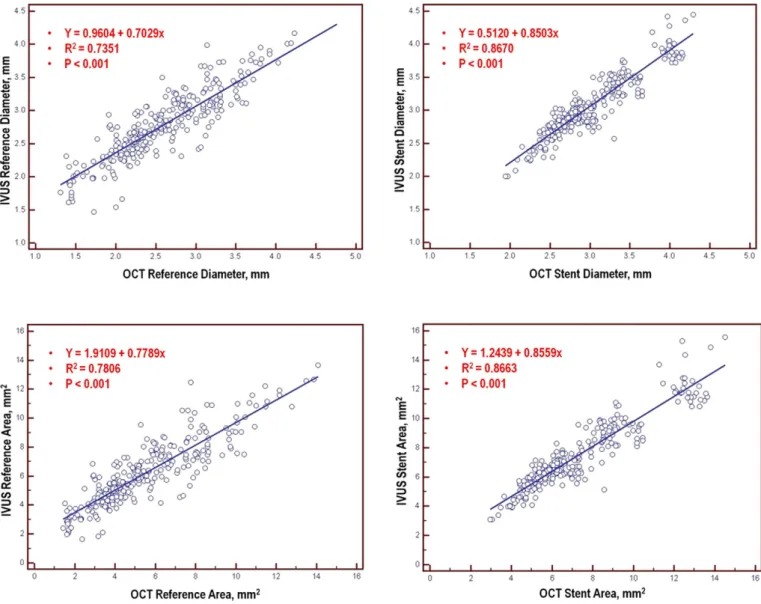
higher in the SD than in the reference segment LD (stented segment di- ameter R2= 0.8670, reference segment diameter R2= 0.7351, p = 0.047), while the correlation was numerically higher in the SA than in the reference segment LA (stented segment area R2= 0.8663, reference segment area R2= 0.7806, p = 0.157) (Fig. 5).
3.3. Inter- and intra-observer reproducibility
In OCT measurements, inter- and intra-observer agreement for reference lumen diameter and area, and stent diameter and area was 0.9936 [95% confidence interval: 0.9887–0.9964] and 0.9989 [0.9981–0.9994]; 0.9953 [0.9917–0.9973] and 0.9986 [0.9974–
0.9992]; 0.9955 [0.9921–0.9975] and 0.9984 [0.9972–0.9991]; and 0.9966 [0.9941–0.9981] and 0.9988 [0.9978–0.9993], respectively. The corresponding values for IVUS measurements were: 0.9766 [0.9588– 0.9867] and 0.9984 [0.9971–0.9991]; 0.9749 [0.9559–0.9858] and 0.9985 [0.9973–0.9991]; 0.9943 [0.9899–0.9967] and 0.9978 [0.9960–
0.9987]; and 0.9952 [0.9915–0.9973] and 0.9981 [0.9967–0.9989], respectively.
4. Discussion
Thefindings of this study are as follows: 1) diameter and area measured by FD-OCT were similar to real phantom model values, while those by IVUS were larger; 2) in human coronary arteries, IVUS vs. FD-OCT demonstrated larger diameter and area compared in Fig. 2. Comparisons of diameter and area among actual phantom size (light blue), and FD-OCT (red) and IVUS (dark blue) measurements at the non-stented reference site (A) and stented segment (B) of phantom coronary model. (*, pb 0.001; FD-OCT, frequency domain optical coherence tomography; IVUS, intravascular ultrasound).
Fig. 3. Comparisons of diameter (A) and area (B) among FD-OCT (red), IVUS (dark blue) and QCA (green) measurements at the non-stented reference site and stented segment of human coronary artery. (QCA, quantitative coronary angiography; FD-OCT, frequency domain optical coherence tomography; IVUS, intravascular ultrasound; *, pb 0.05; **, p b 0.001).
both reference and stented segments; 3) the IVUS vs. FD-OCT measure- ment discrepancy was more prominent in reference than stented seg- ments which can be affected by physiologic vascular response; and 4) lumen dimensions were larger by IVUS and FD-OCT than QCA in human coronary arteries.
IVUS and OCT provide better information than coronary angiogra- phy for coronary lesion assessment and stent optimization. However, because IVUS is a sound based imaging technique[8,9]and OCT is a light based imaging technique[10], the different characteristics of IVUS and OCT images can produce different size measurements in the same lesion[5–7]. Previous studies comparing TD-OCT and IVUS dem- onstrated smaller lumen by TD-OCT measurement. Proximal occlusion technique to obtain blood free space was an explanation for the smaller measurement by conventional OCT [3,11–13]. Recent studies also showed smaller FD-OCT estimations, even though they used contrast in- jection technique rather than proximal balloon occlusion[4,6,7]. The results from our study were mostly consistent with those of previous studies. Therefore, to evaluate the nature and mechanism of the discrepancy between FD-OCT, IVUS and QCA measurements, phantom coronary model and human coronary artery with and without stent were analyzed by 3 modalities sequentially.
Earlier studies showed significantly smaller size by QCA compared with OCT or IVUS measurements. The mechanisms of this phenomenon have been studied: 1) difficulty in image sequence selection with mini- mal foreshortening or overlap with other structures; 2) less accurate
border detection; and 3) insufficient vessel filling by contrast media during image acquisition[4,14–17].
In ex-vivo coronary artery, IVUS and FD-OCT both have shown larger diameter than the actual measurement of the pathologic specimen due to the shrinkage of the vessel during the preparation for histology[13, 18]. Therefore, the true size of the vessel could not be estimated using ex-vivo coronary artery and in vitro model has been used to estimate ac- curacy of FD-OCT and IVUS measurement. A recent study by Kubo et al.
showed that minimum lumen area (MLA) by FD-OCT measurement was similar to the actual phantom silicon coronary model size. However, IVUS overestimated the size by 8%, which was in line with our observa- tion[6]. In the current study, although FD-OCT depicted similar size with actual phantom coronary model, IVUS overestimated LD by 5.6%
and LA by 10.1% compared to actual phantom size in the reference seg- ment. In the stented segment of phantom model, SD and SA measured by IVUS were larger than those by FD-OCT by 2.5% and 4.2%, respective- ly. In human coronary artery, IVUS LD was 7.2% larger than FD-OCT LD in the distal reference segment, while SD was 2.0% larger. IVUS LA and SA were larger by 11.3% and 2.7% than FD-OCT measurement.
According to Bezerra et al., possible explanations for the size discrep- ancy between IVUS and FD-OCT are: 1) lumen discrimination— clear vi- sualization with lesser blurring from the image attenuating material (e.g. calcium) by FD-OCT may allow more precise lumen identification than IVUS; 2) beating effect— faster pullback speed precludes selection of frames at maximum diastole in FD-OCT image; and 3) Dotter effect— Fig. 4. Bland–Altman plots of differences between reference (left) and stent (right) diameter (upper panel) and area (lower panel) between IVUS and FD-OCT. (IVUS, intravascular ultrasound; OCT, optical coherence tomography).
the smaller caliber FD-OCT catheter (2.7 Fr) when compared with IVUS (3.2 Fr) may cause less stretch of the vessel in high-grade stenosis[7]. In real clinical practice, when dealing with coronary artery with stent, the
latter mechanisms might differentially contribute to the size discrepan- cy between FD-OCT and IVUS in each situation. Therefore, previous studies showed inconsistent results on the degree of size discrepancy Fig. 5. Correlation between IVUS measured diameter and FD-OCT measured diameter at the reference segment and the stented segment (upper panel). Correlation between IVUS measured area and FD-OCT measured area at the reference segment and the stented segment (lower panel). Note correlation between IVUS and OCT measured diameter and area are greater at the stented segment than at the reference segment. (IVUS, intravascular ultrasound; OCT, optical coherence tomography).
Fig. 6. Relative difference in percentage of mechanism contribution to difference between IVUS and FD-OCT measurements in previous studies and the present study. (LA, lumen area; SA, stent area; MLA, minimum lumen area; Relative difference percentage (%) = 100 × (IVUS measurement− OCT measurement) / IVUS measurement).
aggerated in the MLA site of native vessel, which was reported from 11.1% in the study by Kubo et al.[6]to 29.8% in that by Bezerra et al.
[7]. Diverse plaque characteristics in MLA site including calcium can provide different lumen discrimination power. Narrow lumen area can augment beating and Dotter effects. In the reference segment of the stented vessel, lumen discrimination can be better than in the MLA site because of the relatively normal looking surface with lesser plaque.
The discrepancy between IVUS and FD-OCT was less pronounced and each measurement showed a stronger correlation in the stented than reference segment. In the stented segment, stent struts provide a clear landmark for lumen discrimination for both FD-OCT and IVUS.
The beating effect is minimized in the stented segment because stent struts can provide enhanced radial strength during coronary systole and diastole. But in the reference segment, effect of stent strut nearby may provide some extent of radial strength, so the beating effect is less influenced than the native vessel MLA without effect of stent. Dotter effect might be almost absent both in the reference and stented seg- ments with sufficient LA. Therefore, size discrepancy between FD-OCT and IVUS and inter-study variability are minimized when measuring stented segment which is least affected by those mechanisms. A previ- ous report also showed attenuation of size discrepancy in the stented segment when compared to the reference native vessel site[5].
It is difficult to define the standard value of size discrepancy which can be universally applicable in clinical practice because of the high rel- ative difference value and inter-study variability owing to the diverse contribution of size discrepancy mechanisms. Also, long-term clinical impact of those discrepancies might not be significant because of the numerically small difference among modalities. However, a better understanding of the mechanism underlying the measurement discrepancy between each modality in different situations can inform adequate device selection and result in a better coronary interventional procedure.
4.1. Study limitations
The present study has several limitations. First, it was a single center observational study with the inherent limitations of small number with possibility of selection bias. Second, the vessels studied had fairly simple lesions. Size discrepancy on complex lesions such as bifurcation lesion, side branch and bended lesions warrants further investigation. Third, the small number of the measurements in phantom coronary model might lack the statistical power to evaluate true size differences. Never- theless, the size discrepancy estimated in phantom model was similar with the previous report, adding reliability of the results[6]. Fourth, there is no definite modality that can measure absolute vessel size. Fur- thermore, complex geometry of native coronary lesion and stented ves- sel as well as dynamic size change according to bloodflow, temperature, and eccentric catheter placement may interfere with accurate measure- ment of definite vessel size[20]. Future devices which can measure real time vessel size without artifact should overcome the latter limitations.
Conflict of interest statement
The authors have no conflict of interest.
References
[1] H.J. Yoon, S.H. Hur, Optimization of stent deployment by intravascular ultrasound, Korean J. Intern. Med. 27 (2012) 30–38.
[2] F. Prati, L. Di Vito, G. Biondi-Zoccai, M. Occhipinti, A. La Manna, C. Tamburino, et al., Angiography alone versus angiography plus optical coherence tomography to guide decision-making during percutaneous coronary intervention: the Centro per la Lotta contro l'Infarto-optimisation of percutaneous coronary intervention (CLI-OPCI) study, EuroIntervention 8 (2012) 823–829.
[3] T. Yamaguchi, M. Terashima, T. Akasaka, T. Hayashi, K. Mizuno, T. Muramatsu, et al., Safety and feasibility of an intravascular optical coherence tomography image wire system in the clinical setting, Am. J. Cardiol. 101 (2008) 562–567.
[4] T. Okamura, Y. Onuma, H.M. Garcia-Garcia, R.J. van Geuns, J.J. Wykrzykowska, C.
Schultz, et al., First-in-man evaluation of intravascular optical frequency domain im- aging (OFDI) of Terumo: a comparison with intravascular ultrasound and quantita- tive coronary angiography, EuroIntervention 6 (2011) 1037–1045.
[5] S.J. Kim, H. Lee, K. Kato, T. Yonetsu, I.K. Jang, In vivo comparison of lumen dimensions measured by time domain-, and frequency domain-optical coherence tomography, and intravascular ultrasound, Int. J. Card. Imaging 29 (2013) 967–975.
[6] T. Kubo, T. Akasaka, J. Shite, T. Suzuki, S. Uemura, B. Yu, et al., OCT compared with IVUS in a coronary lesion assessment: the OPUS-CLASS study, JACC Cardiovasc. Im- aging 6 (2013) 1095–1104.
[7] H.G. Bezerra, G.F. Attizzani, V. Sirbu, G. Musumeci, N. Lortkipanidze, Y. Fujino, et al., Optical coherence tomography versus intravascular ultrasound to evaluate coronary artery disease and percutaneous coronary intervention, JACC Cardiovasc. Interv. 6 (2013) 228–236.
[8] B.F. Waller, C.A. Pinkerton, J.D. Slack, Intravascular ultrasound: a histological study of vessels during life. The new‘gold standard’ for vascular imaging, Circulation 85 (1992) 2305–2310.
[9] G.S. Mintz, J.J. Popma, A.D. Pichard, K.M. Kent, L.F. Satler, Y.C. Chuang, et al., Limita- tions of angiography in the assessment of plaque distribution in coronary artery dis- ease: a systematic study of target lesion eccentricity in 1446 lesions, Circulation 93 (1996) 924–931.
[10] D. Huang, E.A. Swanson, C.P. Lin, J.S. Schuman, W.G. Stinson, W. Chang, et al., Optical coherence tomography, Science 254 (1991) 1178–1181.
[11] Y. Kawase, K. Hoshino, R. Yoneyama, J. McGregor, R.J. Hajjar, I.K. Jang, et al., In vivo volumetric analysis of coronary stent using optical coherence tomography with a novel balloon occlusion-flushing catheter: a comparison with intravascular ultra- sound, Ultrasound Med. Biol. 31 (2005) 1343–1349.
[12]D. Capodanno, F. Prati, T. Pawlowsky, M. Cera, A. La Manna, M. Albertucci, et al., Comparison of optical coherence tomography and intravascular ultrasound for the assessment of in-stent tissue coverage after stent implantation, EuroIntervention 5 (2009) 538–543.
[13]N. Gonzalo, P.W. Serruys, H.M. Garcia-Garcia, G. van Soest, T. Okamura, J. Ligthart, et al., Quantitative ex vivo and in vivo comparison of lumen dimensions measured by optical coherence tomography and intravascular ultrasound in human coronary arteries, Rev. Esp. Cardiol. 62 (2009) 615–624.
[14] P. Garrone, G. Biondi-Zoccai, I. Salvetti, N. Sina, I. Sheiban, P.R. Stella, et al., Quantita- tive coronary angiography in the current era: principles and applications, J. Interv.
Cardiol. 22 (2009) 527–536.
[15] R. Puri, A.J. Nelson, G.Y. Liew, S.J. Nicholls, A. Carbone, D.T. Wong, et al., Variations in coronary lumen dimensions measured in vivo, JACC Cardiovasc. Imaging 5 (2012) 123–124.
[16] S. Tu, L. Xu, J. Ligthart, B. Xu, K. Witberg, Z. Sun, et al., In vivo comparison of arterial lumen dimensions assessed by co-registered three-dimensional (3D) quantitative coronary angiography, intravascular ultrasound and optical coherence tomography, Int. J. Cardiovasc. Imaging 28 (2012) 1315–1327.
[17] J.L. Gutierrez-Chico, P.W. Serruys, C. Girasis, S. Garg, Y. Onuma, S. Brugaletta, et al., Quantitative multi-modality imaging analysis of a fully bioresorbable stent: a head-to-head comparison between QCA, IVUS and OCT, Int. J. Cardiovasc. Imaging 28 (2012) 467–478.
[18]J.S. Choy, O. Mathieu-Costello, G.S. Kassab, The effect offixation and histological preparation on coronary artery dimensions, Ann. Biomed. Eng. 33 (2005) 1027–1033.
[19] M. Habara, K. Nasu, M. Terashima, H. Kaneda, D. Yokota, E. Ko, et al., Impact of frequency-domain optical coherence tomography guidance for optimal coronary
stent implantation in comparison with intravascular ultrasound guidance, Circ.
Cardiovasc. Interv. 5 (2012) 193–201.
[20]J.S. Chae, A.F. Brisken, G. Maurer, R.J. Siegel, Geometric accuracy of intravascular ultrasound imaging, J. Am. Soc. Echocardiogr. 5 (1992) 577–587.