1. INTRODUCTION
Prostate cancer (PCa) usually refers to prostate adenocarcinoma, where the term “adeno” and “car- cinoma” means the gland and uncontrolled growth of cells, respectively. This condition only affects males. Typically, when there is a PCa it is consid- ered as malignant (cancerous), which means that the tumor cells can metastasize, or invade and de- stroy surrounding tissues [1]. The prostate is a small gland that looks like a walnut and lies under
the bladder and in front of the rectum. In general, the diagnosis and detection of PCa are carried out by a biopsy test and perform histological scoring using the Gleason grading system. It identifies the two most common cell patterns within a prostate tissue and assigns a score between one and five to both of them. A score of 1 represents normal cells (well differentiated), and a score of 5 repre- sents abnormal cells (poorly differentiated) that barely resemble the normal prostate tissue [2]. The biopsy test is an invasive process and patients feel
Multichannel Convolution Neural Network Classification for the Detection of Histological Pattern in
Prostate Biopsy Images
Subrata Bhattacharjee†, Deekshitha Prakash††, Cho-Hee Kim††††, Heung-Kook Choi†††††
ABSTRACT
The analysis of digital microscopy images plays a vital role in computer-aided diagnosis (CAD) and prognosis. The main purpose of this paper is to develop a machine learning technique to predict the histological grades in prostate biopsy. To perform a multiclass classification, an AI-based deep learning algorithm, a multichannel convolutional neural network (MCCNN) was developed by connecting layers with artificial neurons inspired by the human brain system. The histological grades that were used for the analysis are benign, grade 3, grade 4, and grade 5. The proposed approach aims to classify multiple patterns of images extracted from the whole slide image (WSI) of a prostate biopsy based on the Gleason grading system. The Multichannel Convolution Neural Network (MCCNN) model takes three input channels (Red, Green, and Blue) to extract the computational features from each channel and concatenate them for multiclass classification. Stain normalization was carried out for each histological grade to standardize the intensity and contrast level in the image. The proposed model has been trained, validated, and tested with the histopathological images and has achieved an average accuracy of 96.4%, 94.6%, and 95.1%, respectively.
Key words: Histological, Prostate Biopsy, Multichannel, Stain Normalization, Classification
※ Corresponding Author : Heung-Kook Choi, Address:
(50834) 197, Inje-ro, Inje University, Gimhae, Gyeong- nam, Republic of Korea, TEL : +82-10-6733-3437, E-mail : [email protected]
Receipt date : Nov. 12, 2020, Revision date : Nov. 23, 2020 Approval date : Nov. 25, 2020
††Dept of Computer Engineering, u-AHRC, Inje University (E-mail : [email protected])
††Dept of Computer Engineering, u-AHRC, Inje University (E-mail : [email protected])
††††Dept of Digital Anti-Aging Healthcare, u-AHRC, Inje University
(E-mail : [email protected])
††††Dept of Computer Engineering, u-AHRC, Inje University (E-mail : [email protected])
※ This research was financially supported by the Ministry of Trade Industry, and Energy (MOTIE), Korea, under the “Regional Specialized Industry Development Program (R&D), P0002072)” supervised by the Korea Institute for Advancement of Technology (KIAT).
a lot of uncomfortable. This clinical examination is performed based on the result of the pros- tate-specific antigen (PSA) test [3]. However, us- ing the biopsy images, an automatic CAD techni- que can potentially help the pathologists in making the decision more accurately.
To guide the adjuvant (immunological agent) treatment decision, many researchers and patholo- gists, and radiologists are trying to examine the role of histopathological parameters as new bio- markers. However, long term experienced patholo- gist and radiologist is required for successful de- tection of biomarkers [4].
The whole slide biopsy image is analyzed by staining with hematoxylin and eosin (H&E) com- pounds. Tissue fixation, embedding, cutting, and staining vary significantly across laboratories and affect the appearance of histopathology samples.
Therefore, to solve this problem, the stain normal- ization (SN) technique has been recently developed that can be useful for the preprocessing step to ad- just intensity level and reduce random noise in the image [5].
In recent years, deep learning (DL) algorithms get a lot of attention to solve different types of problems in the medical imaging field. Also, many researchers around the world are using artificial neural network (ANN) techniques to analyze vari- ous medical images, such as histopathology, mag- netic resonance (MR), radiology, ultrasound, com- puted tomography (CT), etc. [6].
In this paper, we introduce the MCCNN model for multiclass classification and predicting the his- tological grades in a prostate biopsy. The model is designed to be easy to implement, train, test, and use. This paper is organized as follows. We first introduce material and methods which include data collection, data pre-processing, and proposed net- work architecture with detailed explanation. We then present the experimental results, which show the performance of the MCCNN model. Finally, we conclude the paper with a brief description.
2. RELATED WORKS
Litjens et al. [7] examined a fully automated CAD system to detect prostate cancer in MRI. They detect initial candidates using multi-atlas-based prostate segmentation, voxel feature extraction, classification, and local maxima detection. A total of 347 (165 patients with cancer and 182 patients without cancer) patients with MR-guided biopsy were used to evaluate their automated system.
Kim et al. [8] used prostate cancer samples of benign, grade 3, grade 4, and grade 5 to perform texture analysis using the gray label co-occur- rence matrix (GLCM) technique. The author ex- tracted a total of 12 features and selected 10 best features using the ANOVA statistical test. Finally, they performed a machine learning classification using support vector machine (SVM) and k-near- est neighbor (k-NN) algorithms.
Turki et al. [9] performed machine classification for cancer detection. They used three types of sample data, such as colon cancer, liver cancer, and thyroid cancer. The machine learning algorithms they applied are AdaBoost, deep boost, XgBoost, and support vector machine (SVM). A cross-vali- dation technique was carried out for checking the generalizability of the model. The author concluded that among all the algorithms, SVM performed the best.
Chakraborty et al. [4] used a dual-channel re- sidual convolution neural network (DCRCNN) for the detection of cancerous tissue in histopatho- logical images of lymph node sections. The data samples primarily belonged to two different classes, namely benign and malignant. Stain separation (i.e., hematoxylin and eosin) was performed for bi- nary DCRCNN classification.
Tai et al. [10] proposed a novel method for the classification of histopathology images according to the Gleason grading system. Their method ana- lyzed the fractal dimension features of each sub- bands from the prostate biopsies. The SVM and
leave-one-out were adopted as the classifier and to estimate error rate, respectively.
Doyle et al. [11] presented a CAD system for detecting prostate cancer from the digitized images of histological specimens. They extracted nearly 600 texture features to perform pixel-wise Baye- sian classification at each image scale to obtain corresponding likelihood scenes. Their CAD sys- tem was tested on 22 studies by comparing the CAD result to a manual cancer segmentation that was carried out by a pathologist and achieved an overall accuracy of 88%.
3. MATERIALS AND METHODS
3.1 Data Collection
The histology images used for this research has been collected from the Severance Hospital of Yonsei University, and the biopsy test was per- formed on 10 patients. The histological grades (benign, grade 3, grade 4, and grade 5) observed in the prostate biopsy are used in this paper for DL classification. The histopathological slides were scanned at 40× optical magnification with 0.3 NA objective using a digital camera (Olympus C- 3000) attached to a microscope (Olympus BX-51).
The collected images were of size 256 × 256 pixels and were further used to generate patches of size 128 × 128 pixels. The patch generating process was carried out to increase the number of data samples for MCCNN classification, shown in Table 1.
The biopsy tissue extracted from different pa- tients was sectioned in and the deparaffinization and rehydration process was carried out to stain with H&E compounds using an automated stainer
(Leica Autostainer XL). Before staining, removal of paraffin wax is important to avoid poor staining of the tissue section.
3.2 Stain Normalization
Stain normalization is a great approach for ad- justing the color intensity in histopathology images.
Generally, to diagnose the tissue samples, colored chemical stains are used to identify and analyze different components under a microscope.
It has been analyzed that the constancy of color in histology sections is a problem for segmentation, texture analysis, and classification. Incubation time, temperature and the accurate amount of chemical compounds to be mixed are very important to maintain the quality of staining and for histological analysis [12]. Therefore, we used a method pro- posed by Reinhard et al. [13] for color normalization.
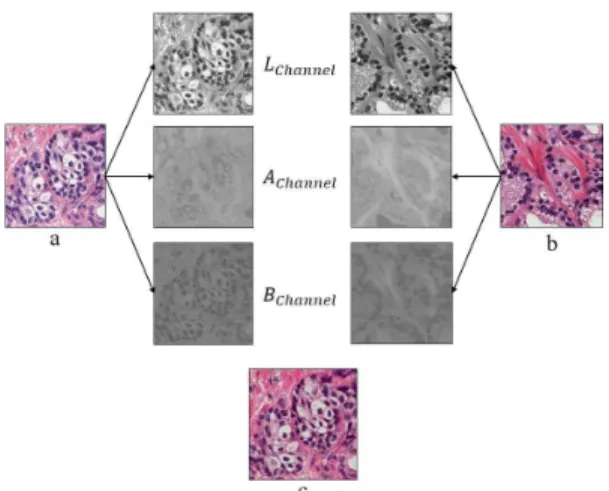
The color distribution of a source image is matched to that of a target image using a set of linear trans- forms in a Lab color space. Fig. 1 shows the proc- ess of stain normalization and figure 2 shows the normalized histological images of four classes.
Each channel was normalized based on statistics of the source and target images, and the computa- tion process can be expressed as:
×
(1)
×
(2)
×
(3)
(4) Table 1. The arrangement of the dataset for multiclass classification
Data Selection From Each Class (256 × 256 pixels)
Benign (400) Grade 3 (400) Grade 4 (300) Grade 5 (400) Total (1500) Patches Generated From Each Class (128 × 128 pixels)
Benign (1600) Grade 3 (1600) Grade 4 (1200) Grade 5 (1600) Total (6000) Dataset Splitting for Classification
Train (3600) Validation (1200) Test (1200)
where , and are the channel means and ,
, and are the channel standard deviation,
is the source image, is the target image, and
is the normalized image, which was further converted to .
3.3 Convolutional Neural Network
This paper introduces a MCCNN model for PCa classification. For medical images, the texture is an important characteristic that provides useful in- formation by extracting the group of features con- taining positive and negative properties and visu- alizing the pixel distribution for pattern analysis.
It has been proven that texture analysis using computational method perform better than human eyesight [14].
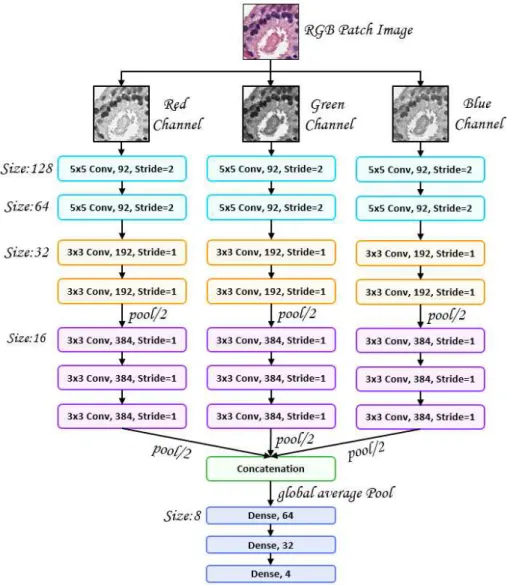
Convolutional neural network (CNN) based deep texture features are more effectual than hand- crafted ones. In this paper, a 2D MCCNN model has been developed for the detection of cancerous and non-cancerous grades from microscopy biopsy images. The model was built based on three differ- ent channels (Red, Green, and Blue), and the split- ting channels from the RGB image are passed re- spectively, shown in Fig. 3.
The model is divided into four sections: input, convolution, concatenation, and classification. The Input section takes grayscale images of three dif- ferent channels separated from the original RGB image and they are passed to the next section separately. In the convolution section, three con- volutional blocks are presented with a different number of filters (92, 192, and 384). Kernel size used for convolutional block 1 and 2&3 is 5 × 5 and 3 × 3. Max pooling (22) is used after the second and third convolutional blocks to reduce the height and width of the features map. It also reduces the com- putational cost by reducing the number of parame- ters to learn. ReLU activation function is applied after each convolutional layer, first and second dense layers. In the concatenation section, all the features maps from each channel are concatenated and passed through a global average pooling (GAP) layer to the classification section where three dense layers of 64, 32, and 4 neurons are used for multi- class classification. Softmax classifier. To reduce overfitting, the GAP layer is used instead of flat- tening, which reduces the total number of parame- ters in the model. A dropout of 0.5 was applied after the second and third convolutional blocks and sec- ond dense layer, respectively. Fig. 3 shows the overall architecture of the developed model. ReLU is used for not activating all the neurons in the net- work at the same time, and thus, the model weights and biases for some neurons are not updated dur- Fig. 1. The process of stain normalization. (a) Source
image. (b) Target image. (c) Normalized images.
Fig. 2. Stain normalized images of the histological grades.
ing the backpropagation process. The equation for this activation function can be defined as,
max (5)
where belongs to the activation value of the
feature map at the location (), is the out- put patch, and are the weight vector and bias term, respectively, of the filter.
The model took 4 hours 30 minutes to train the data samples and less than 1 minute to test. The model was trained with an Intel corei7 processor, one NVIDIA GeForce RTX 2080 GPU, and 18GB
RAM.
3.4 Model Optimization and Loss
To control the training process while building a DL model, the initial learning rate (LR) was set to 0.01 and Keras function called ReduceLROn Plateau (patience=10 and factor=0.8) was used to reduce the initial LR automatically by a factor of 0.8 if there is no improvement in validation loss while training for 10 consecutive epochs. Stochas- tic gradient descent (SGD) optimizer was used for optimizing the weight and biases of the network.
Fig. 3. Multichannel CNN architecture.
The loss functions are very important part of the deep learning models, which are used to determine the changeability between the actual and prediction value. In general, the loss function of a model can be expressed as,
(6)
where is the parameters of the model, is the feature matrix, is the actual value of a feature set.
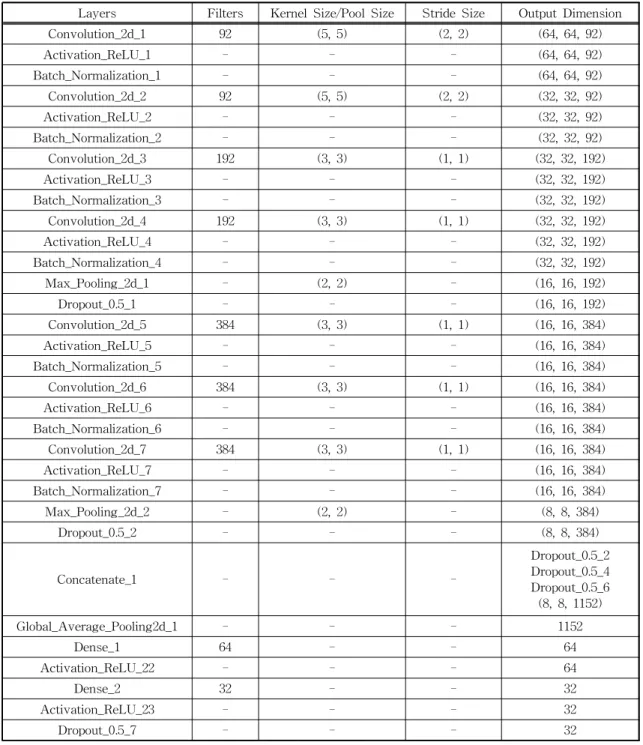
Table 2. The architecture of 2D MCCNN
Layers Filters Kernel Size/Pool Size Stride Size Output Dimension
Convolution_2d_1 92 (5, 5) (2, 2) (64, 64, 92)
Activation_ReLU_1 - - - (64, 64, 92)
Batch_Normalization_1 - - - (64, 64, 92)
Convolution_2d_2 92 (5, 5) (2, 2) (32, 32, 92)
Activation_ReLU_2 - - - (32, 32, 92)
Batch_Normalization_2 - - - (32, 32, 92)
Convolution_2d_3 192 (3, 3) (1, 1) (32, 32, 192)
Activation_ReLU_3 - - - (32, 32, 192)
Batch_Normalization_3 - - - (32, 32, 192)
Convolution_2d_4 192 (3, 3) (1, 1) (32, 32, 192)
Activation_ReLU_4 - - - (32, 32, 192)
Batch_Normalization_4 - - - (32, 32, 192)
Max_Pooling_2d_1 - (2, 2) - (16, 16, 192)
Dropout_0.5_1 - - - (16, 16, 192)
Convolution_2d_5 384 (3, 3) (1, 1) (16, 16, 384)
Activation_ReLU_5 - - - (16, 16, 384)
Batch_Normalization_5 - - - (16, 16, 384)
Convolution_2d_6 384 (3, 3) (1, 1) (16, 16, 384)
Activation_ReLU_6 - - - (16, 16, 384)
Batch_Normalization_6 - - - (16, 16, 384)
Convolution_2d_7 384 (3, 3) (1, 1) (16, 16, 384)
Activation_ReLU_7 - - - (16, 16, 384)
Batch_Normalization_7 - - - (16, 16, 384)
Max_Pooling_2d_2 - (2, 2) - (8, 8, 384)
Dropout_0.5_2 - - - (8, 8, 384)
Concatenate_1 - - -
Dropout_0.5_2 Dropout_0.5_4 Dropout_0.5_6 (8, 8, 1152)
Global_Average_Pooling2d_1 - - - 1152
Dense_1 64 - - 64
Activation_ReLU_22 - - - 64
Dense_2 32 - - 32
Activation_ReLU_23 - - - 32
Dropout_0.5_7 - - - 32
In the present study, the loss function used for multiclass classification is categorical cross-en- tropy [15,16,17]. This loss function measures the classification model performance by predicting a probability value between 0 and 1. The equation used for computing the loss function can be ex- pressed as,
log (7)
where is the number of an output class in the model, is the target value, and is the true pre- dicted score for each in .
4. RESULTS AND DISCUSSION
The MCCNN model proposed in this paper pro- vided promising results compared to our previous research results for multiclass classification. Py- thon programming language was used for stain normalization and developing the model. In total, 6000 data samples were used for GP classification.
Training, validation, and the testing split was per- formed in two steps: 1.) A ratio of 80% and 20%
was applied on the total number of samples for splitting training and testing data, respectively. 2.) Further 25% was applied to the training set for splitting validation data. The performance metrics used for the classification problem in this paper are
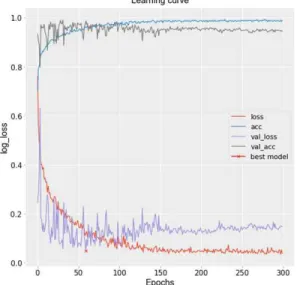
accuracy, precision, recall, f1-score. Fig. 4 shows the confusion matrix [18,19] generated using the confidence probability values for four classes, namely benign, grade 3, grade 4, and grade 5. Fig.
5 shows the learning graph of the model plotted using the accuracy and loss scores of training and validation.
The test data set was fed to the trained network to cross-check the performance of the proposed model. The outstanding results we obtained after testing are 95.1%, 94.8%, 95.1%, and 94.9% for ac- curacy, precision, recall, and f1-score, respectively.
Table 3 shows the overall performance of the MCCNN model based on the unseen data.
In this paper, we mainly focused on multiclass classification instead of binary. The multiclass classification is performed simultaneously and there are high chances of data misclassification as the error of one class can affect the results of the other classes, whereas, in binary classification, there are fewer chances of misclassification because the classification is performed separately and inde- pendently. In our previous study [20], we carried out a morphology analysis of the cell nucleus and lumen tissue components and extracted handcrafted features for the binary and multiclass classification
Fig. 4. Confusion matrix for multiclass classification. Fig. 5. Learning graph of MCCNN model.
using SVM and multi-layer perceptron (MLP).
However, the performance was poor for multiclass classification, and the average accuracy obtained using SVM and MLP was 65.5% and 55.5%, re- spectively. On the other hand, the accuracy of 92.0% and 82.5 was obtained for the proposed bina- ry classification.
The present results in this paper were obtained based on the computational features extracted us- ing a proposed multichannel 2D CNN model. We performed the classification by restricting the pri- mary hypothesis, 1.) The recall of benign and high cancer classes (grade 4 and grade 5) must be more than 95%. 2.) The recall of low cancer class (grade 3) must be more than 85%.
Grade 3 biopsy images are quite similar to be- nign and grade 4, therefore it is difficult to classify and achieve high accuracy compared to other cla- sses. We can say that CNN based computational features are more effective than the handcrafted ones, and are useful for both binary and multiclass classification. The stain normalization technique was used for image preprocessing to equalize the color values in the image. Further, the normalized images were cropped and converted to grayscale by splitting the RGB channels for MCCNN classi- fication.
The feature extraction from three different chan- nels is performed separately using a customized model, and the extracted features from three dif- ferent channels are concatenated to generate a sin- gle feature representation and subjected to the
dense layers for the classification.
5. CONCLUSION
In this paper, a customized multichannel 2D CNN model was developed and experimented with using the histopathological images, to classify benign, grade 3, grade 4, and grade 5 classes. Stain nor- malization and RGB splitting were effective for multiclass classification. Different types of per- formance metrics were used to evaluate the CNN model, and according to the primary hypothesis mentioned in the previous section, the model dem- onstrated amazing results. As we know that multi- class classification is a challenging task for detect- ing PCa, we proposed MCCNN approach for pre- dicting the histological grades accurately.
In conclusion, the proposed model showed prom- ising results and we can say that this research is very encouraging. In the future, we will improve the model performance and recall percentage for low cancer class by modifying the customized model and using other algorithms for image pre- processing and model optimization.
REFERENCE
[ 1 ] M.S. Chung, M. Shim, J.S. Cho, W. Bang, S.I.
Kim, S.Y. Cho, et al., “Pathological Character- istics of Prostate Cancer in Men Aged< 50 Years Treated with Radical Prostatectomy: A Multi-centre Study in Korea,” J ournal of Korean Medical Science, Vol. 34, No. 10, pp.
1-10, 2019.
[ 2 ] D. Albashish, S. Sahran, A. Abdullah, A.
Adam, and M. Alweshah, “A Hierarchical Classifier for Multiclass Prostate Histopathol- ogy Image Gleason Grading,” Journal of Information and Communication Technology, Vol. 17, No. 2, pp. 323-346, 2018.
[ 3 ] S. Yoo, I. Gujrathi, M.A. Haider, and F. Khalvati,
“Prostate Cancer Detection Using Deep Con- volutional Neural Networks,”Scientific Reports, Table 3. Performance evaluation of 2D MCCNN using
test dataset
Precision Recall F1-Score
Benign 100% 99.6% 99.7%
Grade 3 100% 87.5% 93.3%
Grade 4 83.4% 96.2% 89.3%
Grade 5 95.9% 97.2% 96.5%
Mean Accuracy 94.8% 95.1% 94.9%
Overall Accuracy 95.1
Vol. 9, No. 1, pp. 1-10, 2019.
[ 4 ] S. Chakraborty, S. Aich, A. Kumar, S. Sarkar, J.S. Sim, and H.C. Kim, “Detection of Cancer- ous Tissue in Histopathological Images Using Dual-channel Residual Convolutional Neural Networks (DCRCNN),” Proceeding of Inter- national Conference on Advanced Communi- cation Technology, pp. 197-202, 2020.
[ 5 ] A.M. Khan, N. Rajpoot, D. Treanor, and D.
Magee, “A Nonlinear Mapping Approach to Stain Normalization in Digital Histopathology Images Using Image-specific Color Deconvo- lution,” IEEE Transactions on Biomedical Engineering, Vol. 61, No. 6, pp. 1729-1738, 2014.
[ 6 ] M. Sinecen and M. Makinaci, “Classification of Prostate Cell Nuclei Using Artificial Neural Network Methods,” Proceeding of Interna- tional Enformatika Conference, pp. 170-172, 2005.
[ 7 ] G. Litjens, O. Debats, J. Barentsz, N. Karsse- meijer, and H. Huisman, “Computer-aided Detection of Prostate Cancer in MRI,”IEEE Transactions on Medical Imaging, Vol. 33, No. 5, pp. 1083-1092, 2014.
[ 8 ] C.H. Kim, J.H. So, H.G. Park, N. Madusanka, P. Deekshitha, and S. Bhattacharjee, “Anal- ysis of Texture Features and Classifications for the Accurate Diagnosis of Prostate Can- cer,” Journal of Korea Multimedia Society, Vol. 22, No. 8, pp. 832-843, 2019.
[ 9 ] T. Turki, “An Empirical Study of Machine Learning Algorithms for Cancer Identifica- tion,”Proceeding of International Conference on Networking, Sensing and Control, pp. 1-5, 2018.
[10] S.K. Tai, C.Y. Li, Y.C. Wu, Y.J. Jan, and S.C Lin, “Classification of Prostatic Biopsy,”Pro- ceeding of International Conference on Digital Content, Multimedia Technology and Its Applications, pp. 354-358, 2010.
[11] S. Doyle, A. Madabhushi, M. Feldman, and J.
Tomaszeweski, “A Boosting Cascade for Automated Detection of Prostate Cancer from Digitized Histology,”Proceeding of Interna- tional Conference on Medical Image Com- puting and Computer-Assisted Intervention, pp. 504-511, 2006.
[12] F. Ciompi, O. Geessink, B.E. Bejnordi, G.S.
Souza, A. Baidoshvili, and G. Litjens, “The Importance of Stain Normalization in Colorec- tal Tissue Classification with Convolutional Networks,”Proceeding of International Sym- posium on Biomedical Imaging, pp. 160- 163, 2017.
[13] E. Reinhard, M. Adhikhmin, B. Gooch, and P.
Shirley, “Color Transfer between Images,”
IEEE Computer Graphics and Applications, Vol. 21, No. 5, pp. 34-41, 2001.
[14] M. Lucas, I. Jansen, C.D. Savci-Heijink, S.L.
Meijer, O.J. Boer, and T.G. Leeuwen, “Deep Learning for Automatic Gleason Pattern Classification for Grade Group Determination of Prostate Biopsies,” Virchows Archiv, Vol.
475, No. 1, pp. 77-83, 2019.
[15] R.C. Martin and J.R. Pomerantz, “Visual Dis- crimination of Texture,” Perception and Psychophysics, Vol. 24, No. 5, pp. 420-428, 1978.
[16] F. Xing, Y.H. Su, F. Liu, and L. Yang, “Deep Learning in Microscopy Image Analysis: A Survey,” IEEE Transaction on Neural Net- works and Learning Systems, Vol. 29, No. 3, pp. 4550-4568, 2017.
[17] C. Angermueller, T. Pärnamaa, L. Parts, and O. Stegle, “Deep Learning for Computational Biology,”Molecular System Biology, Vol. 12, No. 7, pp. 1-17, 2016.
[18] A. Qayyum, S.M. Anwar, M. Awais, and M.
Majid, “Medical Image Retrieval Using Deep Convolution Neural Network,” Neurocomput- ing, Vol. 266, No. C, pp. 8-20, 2017.
[19] T.T. Tang, J.A. Zawaski, K.N. Francis, A.A.
Qutub, and M.W. Gaber, “Image-based Clas- sification of Tumor Type and Growth Rate
Using Machine Learning: A Preclinical Study,”
Scientific Report, Vol. 9, No. 1, pp. 1-10, 2019.
[20] S. Bhattacharjee, H.G. Park, C.H. Kim, D.
Prakash, N. Madusanka, and J.H. So, “Quanti- tative Analysis of Benign and Malignant Tumor in Histopathology: Predicting Prostate Cancer Grading Using SVM,”Applied Scien- ces, Vol. 9, No. 15, pp. 1-18, 2019.
Subrata Bhattacharjee He received the B.S. degree in information technology (IT) from the University of Derby, UK, in 2016. Currently, he is pursuing his M.S. leading Ph.D. degree from the Graduate School of Computer Engineering, Inje Uni- versity, Korea. He is currently a Research Scholar of Medical Image Technology Laboratory (MITL) at Inje University. His research interests includes multimodal medical imaging, tissue and cell image analysis, digital pathology, image reconstruction, cell and gland seg- mentation, machine learning and deep learning. He has a number of SCIE paper publications and has partici- pated in International and Domestic conferences. He has served as a reviewer of academic journal “IEEE Access“ and he is also a member of Korea Multimedia Society (KMMS).
Prakash Deekshitha She was born in Puttur City, Karnataka, India, in 1996. She pursued her Bachelor of Engin- eering (B.E.) in the department of computer science and en- gineering from St. Joseph Eng- ineering College affiliated under Visvesvaraya Technological University (VTU), Kar- nataka, India, in 2018. Currently, she is pursuing her M.S. degree in computer engineering at Inje Universi- ty, Gimhae, South Korea. She is a Researcher Assistant at the Inje University Medical Image Technology La- boratory (MITL). She has published over 10 papers in journals and conferences. She has also been awarded as the best paper by the Korea Institute of Science and Technology Information during the domestic confer- ence held in Seoul, South Korea. Her research interests include deep learning, image processing and analysis, and computer graphics programming.
Cho-Hee Kim She pursued her B.E. degree in the department of computer en- gineering from Inje University, South Korea, in 2018. Since 2019, she is pursuing her M.S. degree in the department of Digital Anti-Aging Healthcare in the same university. She is also a researcher at the Inje University Medical Image Technology Laboratory (MITL). She has published over 10 papers in journals and conferences. She has also been awarded as the best paper during one of the international conference.
Her interests include image processing and analysis on medical images.
Heung-Kook Choi
He was born in Cheong-Ju City, South Korea in 1955. In 1988 and 1990, he received his Bachelor of Engineering and Master of Eng- ineering, respectively, from Lin- köping University in Sweden. In 1996, he pursued his Ph.D. at the centre for Image Analysis in Computerized Image Analysis from Uppsala University, Sweden. From 1996 to 1997, he was a Researcher at Biomedical Laboratory at Seoul National University, Seoul, Korea. Since 1997, he has been an Assistant Professor with the School of Information and computer Engineering at Inje University, South Korea. Currently, he is an Associate Professor of Computer Engineering at Inje University and operates the Medical Image Technology Laboratory (MITL). He is the author of eight books, more than 300 articles and more than 15 inventions. His research interests include computer graphics, multimedia, image processing and analysis.