韓 國 水 資 源 學 會 論 文 集 第44卷 第3號․2011年 3月
pp. 169 ~177
고해상도 기후자료를 이용한 우리나라의 논 관개요구량 예측
Projecting Future Paddy Irrigation Demands in Korea Using High-resolution Climate Simulations
정 상 옥 *
Chung, Sang-Ok
...
Abstract
The impacts of climate change on paddy irrigation water demands in Korea have been analyzed.
High-resolution (27 × 27 km) climate data for the SRES A2 scenario produced by the Korean Meteorological Research Institute (METRI) and the observed baseline climatology dataset were used. The outputs from the ECHO-G GCM model were dynamically downscaled using the MM5 regional model by the METRI.
The Geographic information system (GIS) was used to produce maps showing the spatial changes in irrigation water requirements for rice paddies. The results showed that the growing season mean temperature for future scenarios was projected to increase by 1.5℃ (2020s), 3.3℃ (2050s) and 5.3℃ (2080s) as compared with the baseline value (1971~2000). The growing season rainfall for future scenarios was projected to increase by 0.1% (2020s), 4.9% (2050s) and 19.3% (2080s). Assuming cropping area and farming practices remain unchanged, the total volumetric irrigation demand was projected to increase by 2.8% (2020s), 4.9% (2050s) and 4.5% (2080s). These projections are contrary to the previous study that used HadCM3 outputs and projected decreasing irrigation demand. The main reason for this discrepancy is the difference with the projected climate of the GCMs used. The temporal and spatial variations were large and should be considered in the irrigation water resource planning and management in the future.
Keywords : climate change, GIS, irrigation, paddy, RCM
...
요 지
기후변화가 우리나라의 논 관개요구량에 미치는 영향을 분석하였다. 기상연구소의 SRES A2 시나리오에 대한 고해상 도 (27 × 27 km) 기후 자료와 기준년도 (1971~2000)의 관측 기상자료를 이용하였다. 기상연구소가 전지구모형 ECHO-G 예측자료를 MM5 모형으로 역학적으로 상세화한 결과를 이용하였다. 논 관개요구량의 공간적인 변화를 분석하기 위하여 GIS 기법을 이용하였다. 연구결과는 벼 생육기간의 평균기온은 기준년도에 비해 1.5℃ (2020s), 3.3℃ (2050s) 및 5.3℃
(2080s) 상승할 것으로 예측되었다. 벼 생육기간의 강우량은 0.1% (2020s), 4.9% (2050s) 및 19.3% (2080s) 증가할 것으로 예측되었다. 영농 형태와 논 면적이 변하지 않는다고 가정하면 우리나라 논의 총 관개용수량은 2.8% (2020s), 4.9%
(2050s) 및 4.5% (2080s) 증가할 것으로 예측되었다. 본 연구의 결과는 총 관개용수량이 다소 감소할 것으로 예측한 다른 연구결과와는 상반된 결과를 나타내었으며, 그 주원인은 사용된 GCM에 따른 기후 예측치의 차이에서 온 것으로 판단된 다. 관개용수량의 시공간적 변동성이 큰 것으로 나타났으며 이는 앞으로 관개계획과 물 관리에서 고려되어야 할 것이다.
핵심용어 : 기후변화, GIS, 관개, 논, RCM
...
* 경북대학교 농업토목공학과 교수 (e-mail: [email protected])
Professor, Department of Agricultural Engineering, Kyungpook National University
DOI: 10.3741/JKWRA.2011.44.3.169
1. INTRODUCTION
Climate change will affect temperature and rainfall patterns (IPCC, 2007), these will impact irrigation water requirements. Agricultural water use constitutes about 47% (61% excluding stream maintenance water require- ment) of the total water usage in South Korea (MOCT, 2006). Most of the agricultural water expenditure in Korea is for irrigating paddy rice, thus efficient irrigation water management is very important.
Many studies have been performed on the climate change impacts on irrigation water requirements world- wide. Doll (2002) studied long-term average irrigation requirements worldwide using two GCM (ECHAM4 and HadCM3) outputs, and projected that two-thirds of the area equipped for irrigation in 1995 would possibly suffer from increased water requirements. De Silva et al. (2007) studied the impacts of climate change on paddy irrigation requirements in Sri Lanka and found that average rainfall would decrease and potential evapotr- anspiration (ETo) and average paddy irrigation require- ments would increase in the future. Rodríguez Díaz et al. (2007) did a similar study for field crops in Spain and projected a significant increase in irrigation demand for 2050s. Thomas (2008) used a regression method to predict the irrigation demand in China for the year 2030 by using long-term observed monthly climate data. He found that irrigation demand showed considerable temporal and spatial variations during the period of 1951?1990, and that irrigation demand was projected to increase with a varied pattern and the subtropical cropping zone was projected to enlarge for the future scenarios. Matthews et al. (1997) predicted climate change impact on rice production in Asia using two crop models (ORYZA1 and SIMRIW), and found rice production would decrease on average by 3.8% in the next century. In general, the increased temperature will make the rice growing region move to higher. Tao et al.
(2006, 2008) predicted that rice production would face challenges from global warming and water shortages.
The impact of global warming on rice production has become a key concern, and many researchers have studied climate change impacts on rice production in Asia using crop models (e.g., Matthews et al., 1997; Yao et al., 2007, Hayashi and Jung, 2000). In Korea,
concerning climate change modeling, several studies have been done using the MM5 and RegCM3 regional models along with ECHO-G GCM model outputs for Special Report on Emission Scenarios (SRES) A2 scenario (e.g., METRI, 2004; Oh et al., 2004; Im et al., 2007). Chang et al. (2007) studied the vulnerability of Korean water resources to climate change and Bae et al. (2008) studied potential changes in Korean water resources. Both researchers used high-resolution climate data produced by downscaling the ECHO-G outputs using the MM5 regional climate model (RCM) for the SRES A2 scenario (METRI, 2004). They found that runoff would increase in the northern part and decrease in the southern part of South Korea and that spatial and temporal variation would increase. Yoo and Kim (2007) studied impact of climate change on rice production in Korea using the CERES-rice model for the MM5 simulation results for the SRES A2 scenario and found that the rice production would decline about 16.5% on average in the 2080s. Chung (2009a,b) studied climate change impacts on paddy irrigation water requirement in the Nakdong river basin and Chung et al. (2010) studied the impacts of climate change on the irrigation water demand for paddy in Korea using downscaled HadCM3 outputs for the SRES A2 and B2 scenarios.
They found that the projected irrigation water demand would vary between scenarios and decrease in general with large temporal and spatial variability. The objec- tive of this research is to assess the impacts of climate change on paddy irrigation water demand in the Republic of Korea by using high-resolution climate simulations.
The projected irrigation demands from this study were compared with the results of a previous study that used HadCM3 outputs.
2. MATERIALS AND METHODS 2.1 Study Area and Rice Culture
The Republic of Korea is located in the Far East between China and Japan (33° N, 125° E to 39° N, 131°
E) with land area of 9.97 × 10
6ha, of which 17.9% is
farmland and 64.0% is forest (MFAFF, 2008a). Farm-
land comprises of 1.07 × 10
6ha (10.8%) paddy and 0.71 ×
10
6ha (7.1%) upland field. It was reported that 0.95 ×
10
6ha was planted to japonica variety rice (Oryza
Fig. 1. Map of South Korea with 8 Provincial Major Rice Areas (after Chung et al., 2010)
sativa L.) and 4.41 million metric tons of rice were produced in Korea in 2007 (MFAFF, 2008b). Rice is the main staple crop in Korea. The climate of Korea is Asian monsoon with an annual mean temperature 12.
2℃ and a 1,274 mm mean precipitation. Two thirds of the annual precipitation falls in summer months, June to September. The rice growing period is from May to September and monoculture is the general practice.
May is the nursery period and seedlings are transp- lanted in late May. Irrigation water is supplied from May to September to keep the water depth at 5~10 cm and rice is harvested in late October. Fig. 1 shows major paddy growing regions within the 8 provinces.
About 70% of the total paddy fields lie in the west and south lowlands and the rest in valleys between mountains (Chung et al., 2010).
2.2 Climate Scenarios
Despite rapid advances in the GCM models, their outputs generally show some biases in climate predic- tion. Temperature is generally well represented, but precipitation less so (Bae et al., 2007). In this study, the climate data produced by METRI (2004) and the observed baseline (1971~2000) monthly mean values were used. METRI used the MM5 model developed by the Pennsylvania State University/National Center for Atmospheric Research to downscale the ECHO-G outputs for the A2 scenario. ECHO-G was developed by the Max-Planck Institute for Meteorology and is one of the 23 atmosphere-ocean general circulation models (AOGCMs) used for the IPCC 4th assessment report
(IPCC, 2007). The downscaled climate data have 27 × 27 km of high-resolution over Korea. Since high-resolu- tion data of mean monthly precipitation and temperature were available, these two climate parameters were used in this study. The A2 scenario represents strong econo- mic values under increasing regionalization (IPCC- TGICA, 2007). The projections are monthly for 2001~
2100 year periods. We used mean monthly data centered on the decades of 2020s (2010~2039), 2050s (2040~
2069) and 2080s (2070~2099) by averaging each 30 year monthly values.
The projected changes in climate need to be con- sidered relative to observed baseline values. A baseline climate dataset observed at 58 weather stations for 1971
~2000 was used. The observed climate parameters are averaged monthly values of the mean, maximum, minimum temperatures, precipitation, sunshine, wind speed and humidity.
As the resolutions of the MM5 outputs and observed climate data are not the same, an interpolation technique was applied to generate baseline climate data at MM5 grid pixels. Then, the relative changes of the MM5 simulated average monthly temperature and precipitation for the future scenarios as compared with those of baseline (1971~2000) were computed. Finally, the relative changes were applied to the generated baseline data to obtain projected future climate data.
These climate data were used in ETo calculations for each month from May to September at each pixel.
2.3 Estimating Volumetric Irrigation Demand The paddy irrigation requirement is defined as the depth of water required for the rice growing per unit area, and paddy irrigation demand is volume of water obtained by multiplying the irrigation requirement and paddy area. The former includes crop ET, deep percola- tion and land preparation water minus effective rainfall, and it does not include other water losses. The effective rainfall is the portion of total rainfall that is used directly in the paddy field, i.e. total rainfall minus losses due to surface runoff and deep percolation. To estimate monthly effective rainfall, the USDA-SCS method was used:
(1)
Symbol in Fig. 1 Province Baseline (mm)
2020s (mm, %)
2050s (mm, %)
2080s (mm, %)
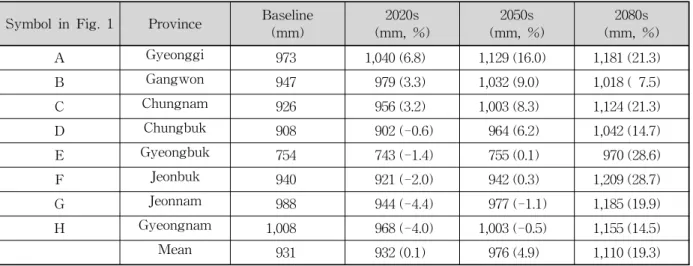
A Gyeonggi 973 1,040 (6.8) 1,129 (16.0) 1,181 (21.3)
B Gangwon 947 979 (3.3) 1,032 (9.0) 1,018 ( 7.5)
C Chungnam 926 956 (3.2) 1,003 (8.3) 1,124 (21.3)
D Chungbuk 908 902 (-0.6) 964 (6.2) 1,042 (14.7)
E Gyeongbuk 754 743 (-1.4) 755 (0.1) 970 (28.6)
F Jeonbuk 940 921 (-2.0) 942 (0.3) 1,209 (28.7)
G Jeonnam 988 944 (-4.4) 977 (-1.1) 1,185 (19.9)
H Gyeongnam 1,008 968 (-4.0) 1,003 (-0.5) 1,155 (14.5)
Mean 931 932 (0.1) 976 (4.9) 1,110 (19.3)
Table 1. Comparison of Predicted Rainfall During the Growing Season (May to Sept.) for the Future Scenarios in the 8 Provincial Paddy Areas
(2) where P
effis monthly effective rainfall (mm) and P
totis monthly total rainfall (mm).
The paddy irrigation requirement can be estimated using a water balance model such as CROPWAT developed by the Food and Agriculture Organization (Smith, 1992). The model requires data such as rainfall, reference crop evapotranspiration (ETo), crop coeffici- ents, and water allowances for land preparation and seepage losses. The ETo was calculated for each pixel using the baseline and projected temperature dataset for 2020s, 2050s and 2080s. Since only temperature data were available, the Hargreaves ETo equation is used as recommended by Allen et al. (1998):
(3) where ETo is reference evapotranspiration (mm day-1), T
mean, T
max, T
minare monthly mean, maximum, and minimum temperatures (°C), and R
ais extraterrestrial radiation (mm day
-1). For the irrigation requirement calculation, there are many grid points rather than one point, therefore, we used a spreadsheet model to replicate the CROPWAT methodology following De Silva et al. (2007). The mean monthly values of rainfall, ETo, percolation, land preparation allowance and crop coefficient were input into the spreadsheet model and the paddy water requirements were calculated across Korea. Land preparation water of 140 mm and nursery area of 5% of the total paddy area and deep percolation value of 2 mm/d assuming clay or loam soil were used
following the design standards (MOAF, 1998). Monthly crop coefficients of 1.05, 1.13, 1.2, 1.2 and 0.9 for May to September were obtained by interpolating those for growth stages from the FAO (Allen et al., 1998).
The volumetric irrigation demands for 8 provinces were computed. The irrigation demand is for the average year and water losses are not included. The computed irrigation requirements were average values in the major paddy regions in each province. Then, they were multiplied by the paddy area of each province to get the provincial volumetric irrigation demand. Then, changes of paddy irrigation demand for the future scenarios in each province and whole country were analyzed.
2.4 Mapping Irrigation Water Requirements The precipitation and paddy irrigation requirement gridded data for the baseline and future scenarios were imported into a GIS. Then, a series of raster maps showing the spatial variation in precipitation and paddy irrigation requirements for the baseline and future scenarios were produced.
3. RESULTS AND DISCUSSION 3.1 Climate Change Projection
The spatial variations of rainfall in Korea during the
growing season (May to September) for the baseline
and 2020s, 2050s and 2080s for A2 scenario are shown
in Fig. 2. Tables 1 and 2 show the total and effective
rainfall amounts during the growing season for the
Symbol in Fig. 1 Province Baseline (mm)
2020s (mm, %)
2050s (mm, %)
2080s (mm, %)
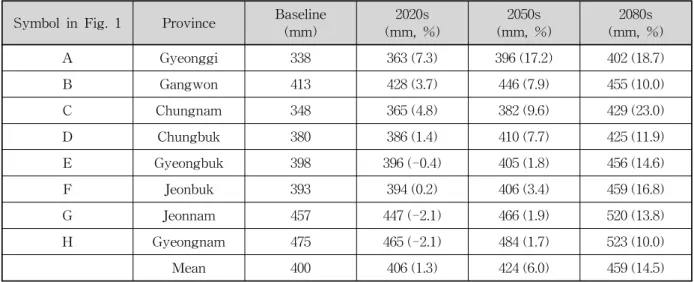
A Gyeonggi 338 363 (7.3) 396 (17.2) 402 (18.7)
B Gangwon 413 428 (3.7) 446 (7.9) 455 (10.0)
C Chungnam 348 365 (4.8) 382 (9.6) 429 (23.0)
D Chungbuk 380 386 (1.4) 410 (7.7) 425 (11.9)
E Gyeongbuk 398 396 (-0.4) 405 (1.8) 456 (14.6)
F Jeonbuk 393 394 (0.2) 406 (3.4) 459 (16.8)
G Jeonnam 457 447 (-2.1) 466 (1.9) 520 (13.8)
H Gyeongnam 475 465 (-2.1) 484 (1.7) 523 (10.0)
Mean 400 406 (1.3) 424 (6.0) 459 (14.5)
Table 2. Comparison of Predicted Effective Rainfall for the Future Scenarios in the 8 Provincial Paddy Areas
baseline and future scenarios in the 8 provincial rice areas. Average growing season rainfall amounts were projected to increase by 0.1% (2020s), 4.9% (2050s) and 19.3% (2080s) as compared with the baseline (1971~
2000). However, the effective rainfall amounts were projected to increase by 1.3% (2020s), 6.0% (2050s) and 14.5% (2080s) since the larger the rainfall amounts are, the smaller the effective rainfall ratios are. The 2080s scenario showed the largest increase in rainfall volume.
The rainfall amounts in southern provinces were projected to either increase little or decrease for 2020s and 2050s and to increase significantly in the 2080s.
Rainfall variations are strongly influenced by vertical movement of air due to atmospheric instabilities of various kinds and by the flow of air over orographic features. For models to accurately simulate the seaso- nally varying pattern of precipitation, they must cor- rectly simulate a number of processes that are difficult to evaluate at a global scale. Many models therefore individually display substantial precipitation biases.
Biases can be attributed to errors in the sea surface temperature field of the ocean-atmosphere coupled model, and failure of models to capture the regional rainfall patterns. The inaccuracy of predicted rainfall by the GCM is carried over to the downscaled rainfall predictions. Therefore, the irregular trend among the scenarios can be attributed to the lower confidence in rainfall predictions of the GCM (Nkomozepi and Chung, 2011).
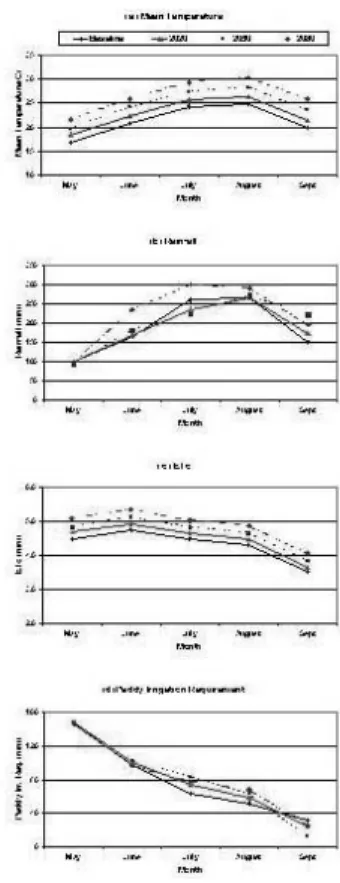
The growing season mean temperature for the
baseline was 21.3℃ and it was projected to increase by 1.5℃ (2020s), 3.3℃ (2050s) and 5.3℃ (2080s).
3.2 Paddy Irrigation Demand
Average baseline ETo was 509.0 mm and the future ETo was projected to increase by 3.8% (2020s), 8.6%
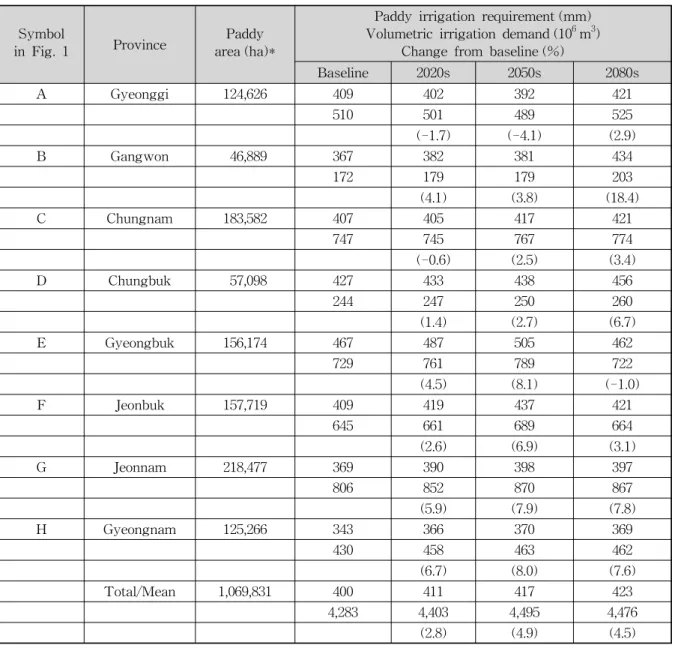
(2050s) and 13.8% (2080s). Since the ETo was projected to increase more than the effective rainfall the irrigation requirements increased for the future scenarios. In addition, the spatial variation of paddy irrigation requi- rements was large as shown in Fig. 3. The southern and northeastern parts of the country have the smallest irrigation requirements, while the east central region has the largest. Table 3 shows the irrigation require- ments and volumetric irrigation demands for the base- line and future scenarios in the 8 provincial rice regions.
The projected provincial irrigation demands vary from -4.1% to 8.1% from the baseline values excluding 2080s Gangwon province that showed 18.4% increase.
However, the paddy area in Gangwon province is only 4.4% of the total paddy area in Korea, the influence of Gangwon province will be minimal to the national irrigation water demand. Total volumetric paddy irrigation demand for the baseline was 4,283 × 10
6m
3and future demands were projected to increase by 2.8%
(2020s), 4.9% (2050s) and 4.5% (2080s). These projec-
tions are contrary to the previous study (Chung et al.,
2010) that had used the HadCM3 outputs and projected
decreasing irrigation demand. The main reason for this
discrepancy is the difference in the projected rainfalls of
Symbol
in Fig. 1 Province Paddy
area (ha)*
Paddy irrigation requirement (mm) Volumetric irrigation demand (10
6m
3)
Change from baseline (%)
Baseline 2020s 2050s 2080s
A Gyeonggi 124,626 409 402 392 421
510 501 489 525
(-1.7) (-4.1) (2.9)
B Gangwon 46,889 367 382 381 434
172 179 179 203
(4.1) (3.8) (18.4)
C Chungnam 183,582 407 405 417 421
747 745 767 774
(-0.6) (2.5) (3.4)
D Chungbuk 57,098 427 433 438 456
244 247 250 260
(1.4) (2.7) (6.7)
E Gyeongbuk 156,174 467 487 505 462
729 761 789 722
(4.5) (8.1) (-1.0)
F Jeonbuk 157,719 409 419 437 421
645 661 689 664
(2.6) (6.9) (3.1)
G Jeonnam 218,477 369 390 398 397
806 852 870 867
(5.9) (7.9) (7.8)
H Gyeongnam 125,266 343 366 370 369
430 458 463 462
(6.7) (8.0) (7.6)
Total/Mean 1,069,831 400 411 417 423
4,283 4,403 4,495 4,476
(2.8) (4.9) (4.5)
*Source: MFAFF, 2008