1. 서 론
지진격리장치는 지진에너지 소산 효과가 뛰어나고 구조물의 고유주기 를 장주기 영역으로 이동시켜 하부구조에 전달되는 지진력을 저감시키는 역할을 하며, 주요 구조부재의 단면 감소와 시공비를 절감할 수 있고, 비교 적 저비용으로 내진성능을 향상시킬 수 있어 교량 설계 시 많이 적용하고 있 는 추세이다[1-3].
여러 종류의 지진격리장치 중 마찰 형식을 사용한 교량은 지진응답이 지 진의 주기 특성 변화나 강도 변화에 민감하지 않으며, 마찰에 의한 감쇠효과 가 뛰어나고 타 지진격리장치 보다 변위 응답을 크게 줄일 수 있어[4], 장대
교량에 마찰형식을 많이 사용하고 있다. 마찰형식 지진격리장치 중 마찰복 원형 지진격리장치(Resilient-Friction Base Isolation systems, R-FBI)는 국내 교량용 지진격리장치로 가장 널리 쓰이는 제품으로 면진 성능과 내구 성 및 지진 후 구조물을 원위치로 복구시키는 복원 성능이 탁월한 것으로 알 려져 있다[1]. 일반 구조물 보다 높은 신뢰성을 요구하는 국내 원전 구조물 에도 마찰복원형 지진격리창치를 많이 사용하고 있어 내진 성능 및 적용성 향상에 대한 연구가 활발히 수행되고 있다[3, 5].
마찰복원형 지진격리장치는 폴리우레탄 스프링의 강성과 불소수지판 인 PTFE(Polytetrafluoroethylene) 마찰재로 구성된 교량형 지진격리장 치로 지진시 마찰거동에 의한 에너지 소산 능력과 지진후 원 위치로 복구시 키는 복원 성능을 갖고 있다. 기존 연구에 의하면, 마찰계수는 미끌림 속도 가 증가함에 따라 같이 증가하나 150 m/s 이상인 경우에는 대기 온도 및 면 압에 관계없이 거의 일정하게 유지되며, PTFE의 마찰계수는 접촉 압력이
2020년 7월 https://doi.org/10.5000/EESK.2020.24.4.157
마찰복원형 지진격리장치가 설치된 케이블교량의 성능 기반 내진설계법 개선(I-실 교량 실험 결과 분석)
Improvement of the Performance Based Seismic Design Method of Cable Supported Bridges with Resilient-Friction Base Isolation Systems (I- Analysis of Field Testing of Cable Supported Bridge)
길흥배 1) ・ 박선규 2) ・ 한경봉 3) ・ 윤완석 4) *
Gil, Heungbae 1) ・ Park, Sun Kyu 2) ・ Han, Kyoung Bong 3) ・ Yoon, Wan Seok 4) *
1) 한국도로공사 초장대교량연구단 연구위원, 2) 성균관대학교 건설환경시스템공학과 교수, 3) 한국도로공사 초장대교량연구단 수석연구원, 4) 한국도로공사 스마트건설사업단 차장
1) Research Fellow, Super Long Span Bridge R&D Center, Korea Expressway Corporation, 2) Professor, Department of Civil Engineering, Sungkyunkwan University, 3) Chief Researcher, Super Long Span Bridge R&D Center, Korea Expressway Corporation, 4) Senior manager, Center for Smart Construction Technology, Korea Expressway Corporation
/ A B S T R A C T /
In this study, a field bridge test was conducted to find the dynamic properties of cable supported bridges with resilient-friction base isolation systems (R-FBI). Various ambient vibration tests were performed to estimate dynamic properties of a test bridge using trucks in a non-transportation state before opening of the bridge and by ordinary traffic loadings about one year later after opening of the bridge. The dynamic properties found from the results of the tests were compared with an analysis model. From the result of the ambient vibration tests of the cable supported bridge with R-FBI, it was confirmed that the dynamic properties were sensitive to the stiffness of the R-FBI in the bridge, and the seismic analysis model of the test bridge using the effective stiffness of the R-FBI was insufficient for reflecting the dynamic behavior of the bridge. In the case of cable supported bridges, the seismic design must follow the “Korean Highway Bridge Design Code (Limit State Design) for Cable supported bridges.” Therefore, in order to reflect the actual behavior characteristics of the R-FBI installed on cable-supported bridges, an improved seismic design procedure should be proposed.
Key words: Cable supported bridges, Resilient-friction base isolation system, Field bridge test, Dynamic properties, Friction analysis
*Corresponding author: Yoon, Wan Seok E-mail: [email protected]
(Received November 18, 2019; Revised April 13, 2020; Accepted April 27, 2020)
증가함에 따라 감소하고 감소율은 미끌림 속도 및 대기 온도의 영향을 받는 것으로 나타났다[6, 7].
교량의 지진시 거동특성을 명확히 파악하기 위해서는 지진격리장치가 설치된 교량의 동특성 값을 실험적으로 산정하는 것이 매우 중요하다[8].
그러나 마찰복원형 지진격리장치를 적용한 사장교에 대해 자유진동실험 을 실시하여 교량 위치별 가속도 계측을 통해 실제 거동 특성을 파악하고 이를 고려한 합리적인 내진설계 절차를 제시하는 연구는 미흡한 실정이다.
이에 본 논문에서는 마찰복원형 지진격리장치가 설치된 케이블교량의 동특성을 파악하기 위한 실교량 실험을 2차례 실시하여 실험결과로부터 얻 어진 대상교량의 탄성거동 상태에서의 동특성 값을 해석모델과 비교·분석 하였다.
2. 실험 대상 케이블교량 및 지진격리장치 배치 현황
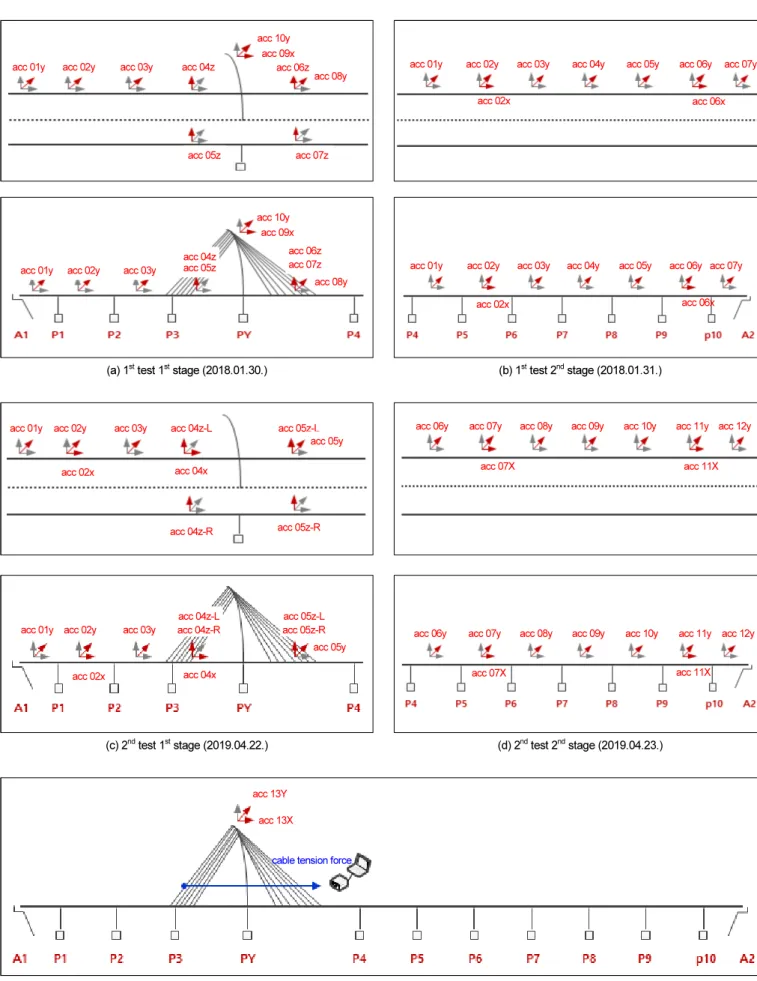
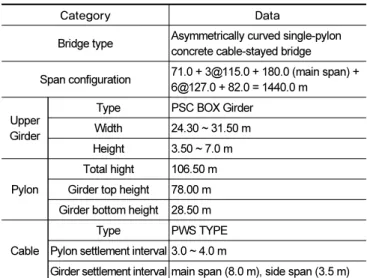
본 논문에서는 부산외곽순환 고속도로상에 있는 비대칭 1주탑 콘크리 트 사장교인 □□대교를 대상으로 현장 실험을 수행하였다. 대상 교량은 2011년 설계되고, 2018년 개통되어 현재 공용중인 교량이며, 설계 시기상 2015년 제정된 도로교설계기준(한계상태설계법) 케이블교량편[9]의 성 능기반 내진설계법이 아닌 이전 설계기준을 준용한 결정론적 내진설계가 적용된 교량이다. 대상 교량은 접속교를 포함한 총 연장이 1,440 m인 12경 간 FCM 교량이며, 주요 교량 제원은 Table 1 및 Fig. 1과 같다. 본 논문에서 수행한 현장실험 대상 케이블교량에 설치된 지진격리장치는 교대와 전체 10개의 교각에 총 50개의 마찰복원형 지진격리장치를 설치하였으며, 세부 제원 및 배치 현황은 Table 2 및 Fig. 1과 같다.
A1 P1 P2 P3 PY P4 P5 P6 P7 P8 P9 P10 A2
(a) Span Configuration of the test bridge
A1 P1 P2 P3 PY P4 P5 P6 P7 P8 P9 P10 A2
7,000kN 30,000kN 30,000kN 25,000kN 35,000kN 35,000kN 35,000kN 35,000kN 35,000kN 40,000kN 35,000kN 35,000kN 15,000kN
EQS OMEQS* OMEQS+STU*
* Shock Transmission Unit
(b) R-FBI layout of the test bridge
Fig. 1. Span Configuration and R-FBI layout of the test bridge Table 1. Test bridge specifications
Category Data
Bridge type Asymmetrically curved single-pylon concrete cable-stayed bridge
Span configuration 71.0 + [email protected] + 180.0 (main span) + [email protected] + 82.0 = 1440.0 m
Upper Girder
Type PSC BOX Girder Width 24.30 ~ 31.50 m Height 3.50 ~ 7.0 m Pylon
Total hight 106.50 m Girder top height 78.00 m Girder bottom height 28.50 m Cable
Type PWS TYPE
Pylon settlement interval 3.0 ~ 4.0 m
Girder settlement interval main span (8.0 m), side span (3.5 m) Table 2. Parameters of R-FBI installed in the test bridge
Type Capa-
city (kN)
Ku (kN/m) Kd (kN/m) Keff (kN/m) ratio X dir Ydir X dir Ydir X dir Ydir (kd/ku)
OMEQS*
7000 233,071 233,071 0 510 1,850 2,360 0.0022 15000 459,846 459,846 0 1,006 3,650 4,656 0.0022 30000 1,165,357 1,165,357 0 2,549 9,250 11,799 0.0022 35000 1,354,330 1,354,330 0 2,963 10,750 13,713 0.0022 40000 1,700,788 1,700,788 0 3,720 13,500 17,220 0.0022 EQS 25000 913,388 913,388 1,998 1,998 9,248 9,248 0.0022
* One Directional Mer Spring Eradi Quake System
3. 개통 전‧ 후 현장 재하 실험
이전의 많은 연구에서 케이블교량을 대상으로 차량에 의한 충격하중, 상 시 교통하중, 풍하중 등에 의한 자유진동실험(ambient vibration test)을 수 행하여 고유주기, 모드형상, 감쇠비 등의 교량 동특성을 파악하였고, 차량 하중과 풍하중에 의한 자유진동실험은 교량의 동특성을 파악하는데 유용 한 것으로 나타났다[10].
본 연구에서는 우선 개통 전 비공용 상태에서 자유진동 데이터를 측정할 수 있도록 차량충격하중에 의한 강제 자유진동실험을 1차로 실시하였고, 약 1년이 경과한 교량 개통 후 차량 공용 상태에서 상시 자유진동실험을 2 차로 추가 실시하였다.
3.1 교량 개통 전 1차 강제 자유진동실험
대상 교량의 실험은 1차적으로 개통 전 비공용 상태에서 교량의 동특성 값을 파악하기 위해 접속교를 포함한 전체 교량에 가속도계를 설치하고, 트
럭에 의한 충격 하중을 재하시켜 강제 자유진동 실험을 실시하였다. 이러한 실험법은 Fig. 2와 같이 제3보스포러스교량의 동특성 파악 등의 실험에 사 용되었고 본 논문에서도 이를 참조하여 강제 자유진동실험을 실시하였다.
전체적인 실험 절차 및 방법은 Fig. 3과 같다.
접속교를 포함한 전체 교량의 동적 특성을 파악하기 위해, 사장교 및 접 속교의 중앙지점에 가속도계를 설치하고 구간을 2개소로 나누어 각 구간별 로 트럭하중을 재하시켜 계측신호를 획득하였으며 100 Hz Sampling Rate 로 약 1시간 가량의 데이터를 지속적으로 저장하였다.
계측센서는 1축 가속도계 10개를 이용하여 Fig. 6과 같이 1구간에 10개, 2구간에 9개를 설치하였으며, 데이터를 획득하기 위한 동적 데이터 로거는 각 구간에 2대를 설치하였다. 재하차량은 150 kN 덤프트럭 2대를 사용하 였으며, 재하차량의 제원 및 축 중량은 Table 3과 같다.
차량 재하 실험은 Fig. 4와 같이 ① 덤프차량 주행 실험(속도 30 km/h,
Fig. 2. Vehicle impact free vibration test of 3 rd Bosphorus Br. [11]
No. Procedure Method
1 Installation of
sensors ∙ Establishment of temporary measuring system using attached sensor and mobile DAQ 2 Confirmation of
safety of data acquisition
∙ On-site verification of data acquisition safety of installed temporary measuring system
∙ On-site checking of FFT analysis using collected sensor data
3
Ambient vibration test
with impact driving of trucks
∙ Loading of impact driving trucks for acquisition of acceleration data of the test bridge
∙ Installation bump to vibrate the test bridge (X dir. and Y dir. of the test bridge)
4 Sensor data acquisition
∙ Acquisition of sensor data by loading of impact driving trucks
∙ Sensor data (natural frequency) comparison with field FFT analysis and seismic analysis model 5
Ambient vibration test with driving of
trucks
∙ Loading of driving trucks for acquisition of acceleration data of test bridge
6 Sensor data
acquisition ∙ Continuous loading of dynamic load of trucks for 30 minutes to 1 hour
7 End of test ∙ Terminate the test in no re-test is required Fig. 3. Procedure of dynamic characteristic identification test
Table 3. Specifications of test truck
L3 L4
L1 3.26 m L2 1.30 m L3 2.00 m L4 1.85 m
Truck 1 Truck 2
Front axle 60.6 kN Front axle 64.30 kN
Back axle 226.0 kN Back axle 210.4 kN
Total weight 288.2 kN Total weight 276.4 kN
(a) Driving test (b) Impact driving test (X dir)
(c) Impact driving test (Y dir) (d) Installation of sensor
(e) Data logger (f) Data acquisition
Fig. 4. 1 st ambient vibration test using vehicles (trucks)
50 km/h), ② 덤프차량 교축방향 충격 강제 자유진동실험, ③ 덤프차량 교 축직각방향 충격 강제 자유진동실험으로 구분하여 시행하였다.
데이터 계측 센서별 설치 위치 및 설치 방향은 Tables 4-5와 같다. 현장 계측은 데이터로거 2대로 나누어 수행하였으며, 계측 시작 전 두 대의 로거
의 시간 동기화를 진행한 이후에 현장 실험을 시작하였다.
3.2 교량 개통 후 2차 상시 자유진동실험
본 논문에서는 1차 강제 자유진동실험 후 약 1년이 경과된 교량 개통 상 태에서 통행차량에 의한 상시 자유진동실험을 추가적으로 실시하였다. 2차 실험은 교량의 개통 전‧ 후 동적특성을 비교하기 위하여 Figs. 5-6와 같이 1 차 실험과 유사한 위치에 가속도계를 설치하여 데이터를 측정하였으며, 실 험 방법 및 절차 등은 유사하게 시행하였다. 가속도 계측센서의 세부 설치 현황(방향, 위치)은 Tables 6-8과 같다.
Table 4. Collection of 1 st stage dynamic data on 1 st test Load Type Sensor Installation
Direction Installation Location
Truck driving
test
acc01y Y dir. A1-P1
acc02y Y dir. P1-P2
acc03y Y dir. P2-P3
acc04z Z dir.
P3-PY
acc05z Z dir.
acc06z Z dir.
PY-P4
acc07z Z dir.
acc08y Y dir.
acc09x X dir. PY
(top of the pylon)
acc10y Y dir.
Truck impact driving test
acc01y Y dir. A1-P1
acc02y Y dir. P1-P2
acc03y Y dir. P2-P3
acc04z Z dir.
P3-PY
acc05z Z dir.
acc06z Z dir.
PY-P4
acc07z Z dir.
acc08y Y dir.
acc09x X dir. PY
(top of the pylon)
acc10y Y dir.
Table 5. Collection of 2 nd stage dynamic data on 1 st test Load Type Sensor Installation
Direction Installation Location
Truck driving
test / impact driving test
acc01y Y dir. P4-P5
acc02y Y dir.
P5-P6
acc02x X dir.
acc03y Y dir. P6-P7
acc04y Y dir. P7-P8
acc05y Y dir. P8-P9
acc06y Y dir.
P9-P10
acc06x X dir.
acc07y Y dir. P10-A2
Truck impact driving test
acc01y Y dir. P4-P5
acc02y Y dir.
P5-P6
acc02x X dir.
acc03y Y dir. P6-P7
acc04y Y dir. P7-P8
acc05y Y dir. P8-P9
acc06y Y dir.
P9-P10
acc06x X dir.
acc07y Y dir. P10-A2
(a) Ordinary traffic loadings (b) cable vibration test
(c) Installation of sensor (girder) (d) Data logger
(e) Installation of sensor (cable) (e) Data acquisition Fig. 5. 2 nd ambient vibration test by ordinary traffic loadings and
cable impact vibration test to estimate cable tension
Table 6. Collection of 1 st stage dynamic data on 2 nd test Load Type Sensor Installation
Direction Installation Location
Traffic
acc01y Y dir. A1-P1
acc02x X dir.
P1-P2
acc02y Y dir.
acc03y Y dir. P2-P3
acc04x X dir.
P3-PY
acc04z-L Z dir.
acc04z-R Z dir.
acc05y Y dir.
PY-P4
acc05z-L Z dir.
acc05z-R Z dir.
acc 01y acc 02y acc 03y acc 04z
acc 10y acc 09x
acc 06z acc 08y
acc 05z acc 07z
acc 01y acc 02y acc 02x
acc 03y acc 04y acc 05y acc 06y acc 06x
acc 07y
acc 01y acc 02y acc 03y acc 04z acc 05z
acc 10y acc 09x
acc 06z acc 07z
acc 08y
acc 01y acc 02y acc 02x
acc 03y acc 04y acc 05y acc 06y acc 06x
acc 07y
(a) 1 st test 1 st stage (2018.01.30.) (b) 1 st test 2 nd stage (2018.01.31.)
acc 01y acc 02y acc 03y acc 02x
acc 04z-L
acc 04z-R acc 04x
acc 05z-L acc 05y
acc 05z-R
acc 06y acc 07y acc 08y acc 09y acc 10y acc 11y acc 12y
acc 07X acc 11X
acc 01y acc 02y acc 03y acc 04z-L
acc 04z-R acc 05z-L
acc 05z-R acc 05y
acc 02x acc 04x
acc 06y acc 07y acc 08y acc 09y acc 10y acc 11y acc 12y
acc 07X acc 11X
(c) 2 nd test 1 st stage (2019.04.22.) (d) 2 nd test 2 nd stage (2019.04.23.)
acc 13Y acc 13X
cable tension force
(e) 2 nd test 3 rd stage (2019.04.25.)
Fig. 6. Location and type of measurement sensor installation
4. 실험 결과 및 분석
4.1 대상 교량 개통 전‧ 후 실혐 결과 비교
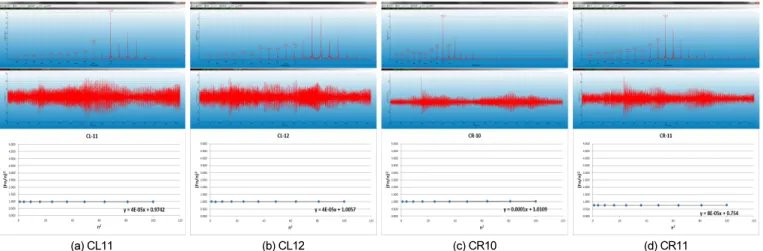
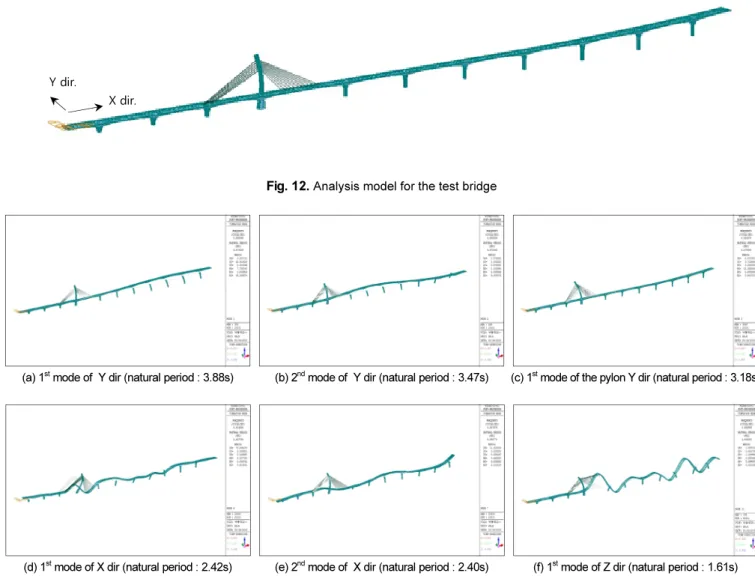
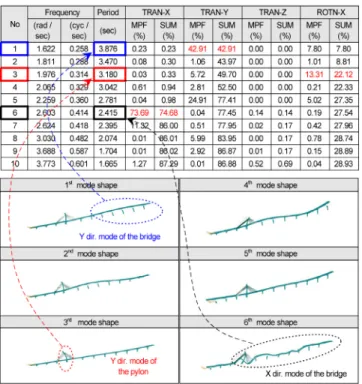
대상 교량의 동특성을 파악하기 위하여 개통 전‧ 후 2차에 걸친 실험을 실시하였고, Figs. 7-9와 같이 계측된 데이터를 바탕으로 FFT분석 등을 통 해 대상 케이블교량의 고유진동수 및 케이블장력을 산정하였다. 주요 모드 에 대한 고유주기 산정 및 케이블 장력 결과는 Tables 9-10과 같다.
Table 9에서 확인할 수 있듯이 2차 공용중 상시 자유진동실험에서는 교 량의 교축방항(X) 2차 모드는 노이즈로 인해 결과를 산정할 수 없었으며, 이는 상시진동에 의한 교량의 응답이 다른 모드에 비해 상대적으로 작다는 것을 의미한다. 그러나 기타 다른 모드의 경우 실험결과에서 확인할 수 있듯 이 교량의 개통 전‧ 후 고유진동수는 차이가 없었다.
Table 10에서 확인할 수 있듯이 케이블 장력의 경우 포장 타설 전 도입 장력과 개통후 측정 장력의 비교 결과 약 0.04%~9.4% 정도 증가 되었음을 알 수 있었다. 이는 포장 타설과 공용 하중에 의한 장력의 증가가 정상적으 로 이루어 졌음을 의미한다.
일반적으로 사장교의 경우 시공 전‧ 후 케이블 장력의 조정이 반드시 필 요하다. 설계시 요구되는 긴장력과 시공시 형상관리를 위해 현장에서 조정 하는 긴장력과는 현실적으로 차이가 발생할 수밖에 없으며, 이는 설계나 시공시 형상 관리를 위하여 요구되었던 장력 목표치가 제대로 도입되었는 지 반드시 확인할 필요가 있음을 의미한다. 본 실험 대상 교량과 같은 사장 교의 경우 지진 해석시 케이블 장력에 의한 교량 단면의 초기 응력상태가 중요하며, 해석모델의 정확도를 향상시키고 지진시 거동을 예측하기 위해 서는 실교량 실험에 의한 케이블 장력 변화값을 파악하는 것이 매우 중요 하다.
Table 7. Collection of 2 nd stage dynamic data on 2 nd test Load Type Sensor Installation
Direction Installation Location
Traffic
acc06y Y dir. P4-P5
acc07x X dir.
P5-P6
acc07y Y dir.
acc08y Y dir. P6-P7
acc09y Y dir. P7-P8
acc10y Y dir. P8-P9
acc11x X dir.
P9-P10
acc11y Y dir.
acc12y Y dir. P10-A2
Table 8. Collection of 3rd stage dynamic data on 2nd Test Load Type Sensor Installation
Direction Installation Location
Traffic acc13x X dir. PY
(top of the pylon)
acc13y Y dir.
Cable impact vibration
test
Right - hand side of
pylon the (CR-)
acc01 ~ 11 vibration dir. CR01 ~ 11
CR01 주탑부
2차선
1차선
1차선
2차선 김해
기장 CR02 CR03 CR04 CR05 CR06
CR07CR08 CR09 CR10 CR11
pylon
lane 1 lane 2
lane 1 lane 2
Left - hand side of
pylon the (CL-)
acc01 ~ 12 vibration dir. CL01 ~ 12
CL01
CL02 CL03
CL04 CL05
CL06 CL07
CL08 CL09
CL10 CL11
CL12
주탑부 2차선
1차선
1차선
2차선 김해
기장
pylon
lane 1 lane 2
lane 1 lane 2
frequency(Hz) frequency(Hz) frequency(Hz) frequency(Hz)
(a) acc04y sensor (Y dir) data (b) acc05y sensor (Y dir) data (c) acc07z sensor (Z dir) data (d) acc10y sensor (Y dir) data Fig. 7. Time History and FFT result data of 1 st ambient vibration test
F=0.3265(Lateral 1st)
![Fig. 2. Vehicle impact free vibration test of 3 rd Bosphorus Br. [11]](https://thumb-ap.123doks.com/thumbv2/123dokinfo/5072895.560262/3.892.464.830.414.1102/fig-vehicle-impact-free-vibration-test-bosphorus-br.webp)