1. Introduction
To increase the classification accuracy, the noise removal as a preprocessing is usually done with average filter, median filter or wavelet. Here the wavelet is reviewed as a filter to remove noises. The average and median filter operate by moving the window over the array, from the start to the end regardless of image. Meanwhile, wavelet based noise reduction method is frequency filtering like Fourier transform based noise reduction. The wavelet filter allows specific parts of the spectrum to be filtered.
The average and median filters lose a more detail than
the wavelet filters. To the extent that this detail might be of interest, these filters are not as powerful as the wavelet filters (Kaplan, 2001; Bruce et al., 2006).
Since 1990’s wavelet transform has been extensively used in 2D image processing techniques:
compressing large-sized image sets, reducing the noise of imagery, fusing and analyzing multi-scale images (Koger et al., 2003; Pijares and Cruz, 2004;
Solbø and Eltorft, 2004; Boucheron and Creusere, 2005; Tso and Olsen, 2005; Yunhao et al., 2006).
In the study on reducing the noise, selecting adequate wavelet is very important because different results can be obtained according to the type of basis
Wavelet Pair Noise Removal for Increasing the Classification Accuracy of a Remotely Sensed Image
Hong-Sung Jin*, Hee-Young Yoo**†, Joo-Young Eom**, Il-Su Choi*, and Dong-Yeob Han*
*Applied Mathematics Department, Chonnam National University, San96-1, Doondeok-dong, Yeosu, Jeonnam, Korea
**Earth Science Education Department, Seoul National University, Gwanak _ 599, Gwanak-ro, Gwanak-gu, Seoul, 151-742, Korea
Abstract :The noise removal as a preprocessing was tried with various kinds of wavelet pairs. Wavelet transform for 2D images generally uses the same wavelets as basis functions in horizontal and vertical directions. A method with different wavelets was tried for each direction separately, which gives more precise interpretation of the classification. Total 486 pairs of wavelets from nine basis functions were tried to remove image noises. The classification accuracies before and after the noise removal were compared.
Although all kinds of wavelet pairs showed the increased accuracies in classification, there were best and worst wavelet pairs depending on the data sets. Wavelet pairs with low energy percentage of LL band showed the high classification accuracy. A pattern was found in the results that very similar vertical accuracy was distributed for each horizontal ones. Since Haar is the shortest length filter, Haar could be a predictor wavelet to find the good wavelet pairs.
Key Words :basis function, classification, noise removal, wavelet pair, wavelet transform.
Received May 22, 2009; Revised June 29, 2009; Accepted June 29, 2009.
†Corresponding Author: Hee Young Yoo ([email protected])
function in classification. However, it is not easy to choose the basis function which is effective to improve classification accuracy (Yoo et al., 2008b).
Wavelet transform for 2D images generally uses the same basis function in horizontal and vertical directions. However, it is possible to use different basis functions for wavelet decomposition in horizontal and vertical directions because wavelet decomposition is independently performed in each direction (Yoo et al., 2008a).
In this study, different horizontal and vertical wavelet pair transforms are done separately to remove image noises. The classification accuracies before and after the noise removal are compared to select optimal basis function.
2. Methodology
1) Fundamentals of basis function in wavelet transform
The 2D discrete wavelet transform (DWT) results are obtained by first filtering the signal in row direction then re-filtering the output in column direction by the basis filter. When an image is decomposed by 2D DWT in one level, four sub- bands are formed. Each sub-band is named by directions and frequency filter passed in LL, LH, HL and HH. L means low-frequency filter and H means high-frequency filter. 4 sub-bands contain approximation component, horizontal detail component, vertical detail component and diagonal detail component, respectively.
All the bases have different results in expressing a certain function in a finite space. Since wavelet transform is a change of bases, signals and images can be expressed in another space through wavelet transform. Different wavelet transform means different change of bases. It means that we can pick
good or bad wavelets for a certain function for applications. Therefore efficiency should be considered in choosing wavelets. Which wavelet should we choose? The characteristics of wavelets should be considered before processing. As an example, if the signal is regular enough and the wavelet with enough vanishing moment is chosen, then the output wavelet coefficients of fine scales are small. The brief properties of wavelets are categorized in Table 1. More precise information can be found in many texts such as Daubechies (1992).
Unfortunately there is no rule of thumb to choose right wavelets for signals and images. Either the shape or the pattern of the objects should be considered at first. If the image is box shaped then Haar wavelet can be better than others. Hence the objects must be carefully treated for us to pick the proper wavelets.
In this paper various kinds of wavelets were tested heuristically to find the better wavelets for a remotely sensed image. In the image, six areas were classified.
The classification accuracies before and after the speckle noise removal was compared. Compactly supported wavelets were used as filters in denoising (Daubechies, 1992). The increased accuracies were calculated for each wavelet pairs. The hard threshold was used in the removal of speckle noises. Since this paper aims at checking the possibility of picking up the right wavelet pair, level one was enough to proceed. Wavelet pair means that vertical and
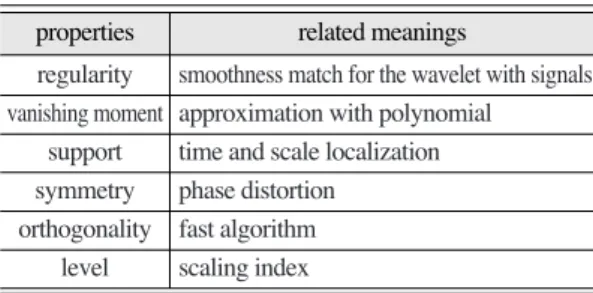
Table 1. Related meanings of the wavelet properties (Matlab wavelet toolbox user’s guide)
properties related meanings
regularity smoothness match for the wavelet with signals vanishing moment approximation with polynomial
support time and scale localization symmetry phase distortion
orthogonality fast algorithm level scaling index
properties related meanings
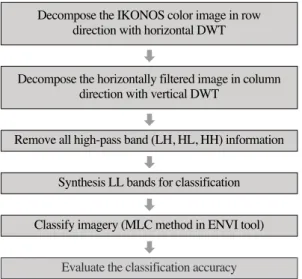
horizontal wavelets were chosen. These all procedures are expressed in Fig. 1.
2) The test dataset
The Ikonos imagery in Hobart, Australia is one of ISPRS dataset collections (http://www.isprs.org/data/
index.html) and is composed of red, green, blue, near infrared bands (4m). Fig. 2 shows the test image (a), the training data sets (b) and reference data sets (c) for Ikonos image. In this paper various kinds of wavelets were tested heuristically to find the better wavelets for a remotely sensed image. In the image, five classes were classified using MLC (Maximum Likelihood Classifier) with ENVI software. The reference dataset of Ikonos image is divided into residential area, forest, water, commercial area and grass. The number of reference pixels by class is 142277 in residential area, 42546 in forest, 84391 in water, 29224 in commercial area and 1892 in grass, Fig. 1. The image classification procedure for selecting the
wavelet pair.
Evaluate the classification accuracy Classify imagery (MLC method in ENVI tool)
Synthesis LL bands for classification Remove all high-pass band (LH, HL, HH) information
Decompose the horizontally filtered image in column direction with vertical DWT
Decompose the IKONOS color image in row direction with horizontal DWT
Fig. 2. Ikonos dataset: (a) The original image, (b) Training data set, (c) The reference data collected from the original image by visual check.
respectively. This reference dataset was collected from image by visual check because classes in high resolution image can be divided by visual check. The training data sets of this image also are obtained by 10% random sampling of each reference dataset.
3. Experiment
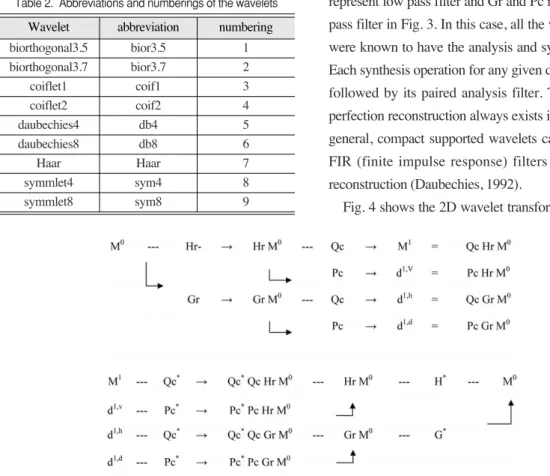
Nine kinds of wavelets were tried as filters to the vertical and horizontal pixels. Table 2 shows the name of the wavelets and their abbreviations. They were numbered from 1 to 9. Wavelets filtered image through vertical and horizontal directions separately.
81 wavelet pairs were tested for 5 classes and overall case. Therefore 486 wavelet pairs were tested for
updating classification accuracies. The hard threshold was taken so that the vertically and horizontally high frequency part was removed.
The pixels, which are recognized as noises, could be different according to filter type and threshold.
Generally, the results of wavelet filtering have changed pixels and non-changed pixels like the results of average filter or median filter and changed pixels are altered similar values to neighbor pixels’
values. In reducing noise with wavelet pair filter, every pixel is changed and the values of noise pixels would be more different from original pixel than that of non-noise pixels.
Suppose that we have two wavelets A for horizontal and B for vertical filter, and that (Hr, Gr) is a row operation for the filter A and (Qc, Pc) is a column operation for another filter B. Hr and Qc represent low pass filter and Gr and Pc represent high pass filter in Fig. 3. In this case, all the wavelets used were known to have the analysis and synthesis pairs.
Each synthesis operation for any given data is directly followed by its paired analysis filter. Therefore the perfection reconstruction always exists in this case. In general, compact supported wavelets can be used as FIR (finite impulse response) filters with perfect reconstruction (Daubechies, 1992).
Fig. 4 shows the 2D wavelet transform diagram of Table 2. Abbreviations and numberings of the wavelets
Wavelet abbreviation numbering
biorthogonal3.5 bior3.5 1
biorthogonal3.7 bior3.7 2
coiflet1 coif1 3
coiflet2 coif2 4
daubechies4 db4 5
daubechies8 db8 6
Haar Haar 7
symmlet4 sym4 8
symmlet8 sym8 9
Wavelet abbreviation numbering
Fig. 3. Analysis and synthesis diagram.
wavelet analysis. M0 represents the original image.
The image was analyzed via wavelet pairs and the hard threshold was taken by removing high frequency part. In Fig. 4 d1,v= Pc Hr M0, d1,h= Qc Gr M0, and d1,d= Qc Gr M0were removed. Then the images were synthesized.
To reduce noises, only the approximation component M1is used. For the classification, all we need is the signal part with less noise, hence M1part was fairly enough to increase the accuracies. The energy parameter shows that M1part, which is LL band, has enough information for image classification.
The energy parameter of the signal is the sum of the squares of wavelet coefficients; it is computed by sub-bands after the wavelet decomposition process.
The energy parameter is calculated via Equation 1.
ef= f2i,j (1)
The wavelet transform conserves the energy of the
original signal or image, and the energy parameter of the trend sub-band approximation--LL band-- accounts for a large percentage of the energy of the transformed signal. Since the energy of every LL band is greater than 90%, only the LL band information is used for image classification in this study.
For more precise informational view the PSNR (peak signal to noise ratio) values are calculated as follows
PSNR = 10·log10
( )
(2),where
MSE = ΩΩM0(i, j) _M1(i, j)ΩΩ2
In the above equation MSE (mean square error) represents the mean squared error for m by n monochrome images M0and M1in Fig. 3. MAXIis the maximum possible pixel value of the image.
4. Results and discussion
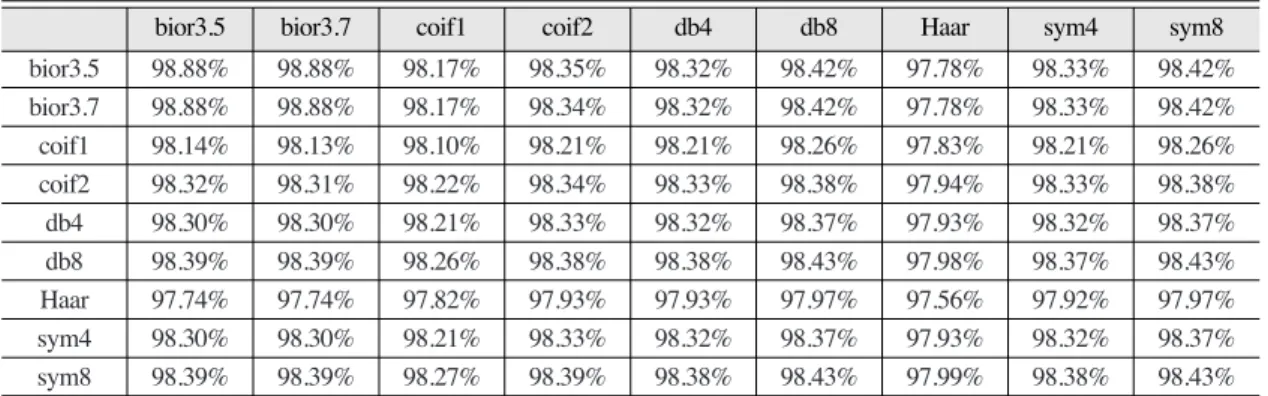
Table 3 shows the energies of LL band obtained from wavelet decomposition with 9 basis functions.
The wavelet pairs with Haar show slightly lower percentage close to 2% than other pairs. In a different point of view the percentage of noise changes at least
n_1 j=0
S
m_1
S
i=01 mn
MAX2I MSE
S
n j=1S
m i=1Fig. 4. Level 1 Analysis using vertical and horizontal filters separately.
Table 3. The percentage of LL part energy
bior3.5 bior3.7 coif1 coif2 db4 db8 Haar sym4 sym8
bior3.5 98.88% 98.88% 98.17% 98.35% 98.32% 98.42% 97.78% 98.33% 98.42%
bior3.7 98.88% 98.88% 98.17% 98.34% 98.32% 98.42% 97.78% 98.33% 98.42%
coif1 98.14% 98.13% 98.10% 98.21% 98.21% 98.26% 97.83% 98.21% 98.26%
coif2 98.32% 98.31% 98.22% 98.34% 98.33% 98.38% 97.94% 98.33% 98.38%
db4 98.30% 98.30% 98.21% 98.33% 98.32% 98.37% 97.93% 98.32% 98.37%
db8 98.39% 98.39% 98.26% 98.38% 98.38% 98.43% 97.98% 98.37% 98.43%
Haar 97.74% 97.74% 97.82% 97.93% 97.93% 97.97% 97.56% 97.92% 97.97%
sym4 98.30% 98.30% 98.21% 98.33% 98.32% 98.37% 97.93% 98.32% 98.37%
sym8 98.39% 98.39% 98.27% 98.39% 98.38% 98.43% 97.99% 98.38% 98.43%
bior3.5 bior3.7 coif1 coif2 db4 db8 Haar sym4 sym8
1% or more. It can be analyzed that more energy from noise including signals is removed. So the Haar can show the better classification accuracies as in Table 4. Another wavelet pair coiflet1 with coiflet1 shows a little less energy than others, which also shows the good classification accuracy. But if the information of the noise is not known well, it is hard to say which wavelet is optimal. Therefore heuristic method was tried. Table 4 shows the results of the Ikonos image. In any case the accuracy was increased by removing speckle noises.
For the residential case, the original accuracy, before denoising, is more than 95%. The speckle noise removal through wavelet transform raises the accuracy. Although the increased rate is small, the filtering works well even for the worst wavelet pairs such as sym4 for horizontal and coif2 for vertical
filter.
For the water case, the original accuracy is close to 100%. There is no room for updating the accuracy.
For the residential and water case, the original accuracy is so high that it is hard to find some pattern among the different wavelet pairs.
For the grass, coif1 and coif1 pair shows the best result updating the accuracy more than 100%. The original accuracy was only 15%, which was raised up to 31% after removing speckle noise. Even for the worst case db4 and db8 shows more than 65%
updating the accuracy.
The forest, commercial and overall cases are reviewed more precisely.
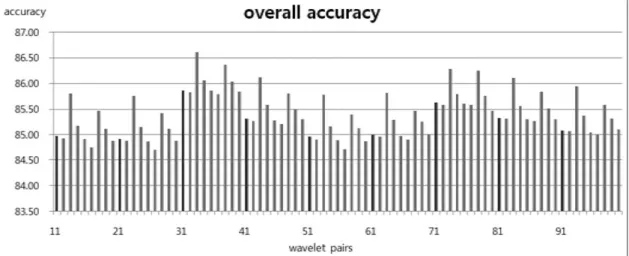
Fig. 5 shows the overall results of the sample image. The horizontal axis represents the wavelet pairs and the vertical axis represents the accuracies of Table 4. The results of updated accuracies of the Ikonos image
residential forest water commercial grass
original accuracy 95.03 77.69 99.99 38.15 14.97
pixels 142277 42546 84391 29224 1829
highest accuracy 96.90 95.22 100 48.3 71.92
increased amount 1.87 17.53 0.01 10.15 18.0
wavelet pair Haar_Haar Haar_Haar many coif1_coif1 coif1_coif1
lowest accuracy 96.13 88.97 99.96 45.26 24.77
increased amount 1.1 11.28 -0.03 7.11 15.7
wavelet pair sym4_coif2 sym8_sym8 coif1_sym8 bior3.5_db4 db4_db8
residential forest water commercial grass
Fig. 5. The accuracies with various kinds of wavelet pairs for overall data.
classification. The first digit represents the horizontal wavelet while the second digit is for the vertical. As an example the wavelet pair 15 means the first digit 1 for horizontal wavelet and the second digit 5 for vertical one. It means that biorthogonal3.5 for horizontal and daubecheies4 for vertical wavelets were used.
For the overall case the wavelet pair 30’s are higher than others. The number 33 shows the highest, and therefore coiflet1 and coiflet1 pair can be the best filter choice. The number 26 was the worst, and therefore bio3.7 and db8 pair can be the worst filter choice.
Fig. 6 shows the results of the forest case. For the forest case the wavelet pairs 70’s are higher than others. The wavelet pair 70’s means that the Haar wavelet was used as a horizontal filter and all wavelets for vertical filter processing. The highest accuracy occurs at 77, hence the Haar and Haar pair can be the best filter choice. The number 99 was the worst hence sym8 and sym8 pair can be the worst filter choice. A pattern is seen in this case. The high accuracies occur at the Haar wavelet as vertical for any horizontal filters. When the last digit is 7 we can see the highest accuracies for any first digits in wavelet pairs.
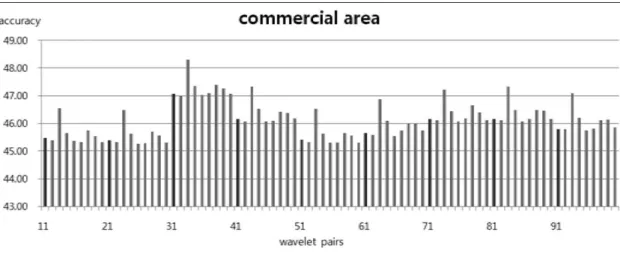
Fig. 7. The accuracies with various kinds of wavelet pairs for commercial data.
Fig. 6. The accuracies with various kinds of wavelet pairs for forest data.
Fig. 7 shows the commercial area case. The highest accuracy is shown at the wavelet pair number 33, which is coif1 and coif1. The worst case is at the number 25, which is bior3.7 and db4. The coif1 for the vertical filter shows the highest accuracies at any horizontal filters. If one chooses 50’s, db4 for horizontal filter, the best accuracy is found at 52, coif1 for vertical filter.
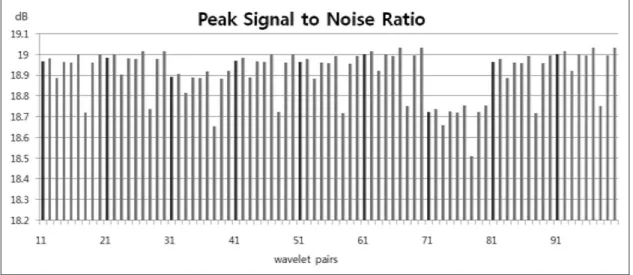
The results of bar charts from Fig. 5 to Fig. 8 tell us a pattern. If we choose the best wavelet as vertical filter from any given horizontal wavelet filter, then the vertical wavelet shows the almost best result for any other horizontal wavelets. As in Fig. 7, the wavelet pair 43 was best at 40’s hence we can expect that 53 shows the accuracy roughly best at 50’s, which is true. Hence the coiflet1 can be the best filter for vertical direction. Therefore the Haar wavelet can be used as a detector to find the good filter pair for increasing the classification accuracy of a remotely sensed image. It can be seen more clearly in Fig. 8, where the PSNR shows the very similar pattern.
5. Conclusions
Total 486 wavelet pairs were tried to raise the classification accuracies for a remotely sensed image.
It is impossible to find the best wavelet pairs from the infinite number of wavelets. Instead the good wavelet pairs were found.
For any horizontal and vertical wavelet pairs the classification accuracies were increased. Although all the wavelet pairs filtered speckle noises to increase the classification accuracy, the increased rates were different. It means that there exists a best wavelet pair in removing speckle noises.
Haar with Haar and coiflet1 with coiflet1 pairs showing low LL band energies give higher classification accuracies. In PSNR, this pattern shows up very clearly.
Since the FIR filter length for the Haar wavelet is the shortest, it is suggested to fix the horizontal wavelet as the Haar wavelet and find the best vertical wavelet.
Fig. 8. Peak signal to noise ratio of each wavelet pairs.
References
Boucheron, L. E. and C. D. Creusere, 2005. Lossless wavelet-based compression of digital elevation maps for fast and efficient search and retrieval, Geoscience and Remote Sensing, IEEE Transactions on, 43(5): 1210- 1214.
Bruce, L. M., A. Mathur, and J. D. Byrd Jr., 2006.
Denoising and wavelet-based feature extraction of MODIS multitemporal vegetation signatures, GIScience and Remote Sensing, 43(1): 67-77.
Daubechies, I., 1992. Ten lectures on wavelets, CBMS, SIAM, 61: 194-202.
Kaplan, I., 2001. Applying the Haar Wavelet Transform to Time Series Information, http://www.bearcave.com/misl/misl_tech/wav elets/simple_filters/index.html.
Koger, C. H., L. M. Bruce, D. R. Shawa, and K. N.
Reddyc, 2003. Wavelet analysis of hyperspectral reflectance data for detecting pitted morningglory (Ipomoea lacunosa) in soybean (Glycine max), Remote Sensing of Environment, 86(1): 108-119.
Pajares, G. and J. M. Cruz, 2004. A wavelet-based image fusion tutorial, Pattern Recognition,
37(9): 1855-1872.
Solbø, S. and T. Eltorft, 2004. Homomorphic Wavelet-Based Statistical Despeckling of SAR Images, IEEE Transactions on Geoscience and Remote Sensing, 42(4): 711- 720.
Tso, B. and R. C. Olsen, 2005. A contextual classification scheme based on MRF model with improved parameter estimation and multiscale fuzzy line process, Remote Sensing of Environment, 97(1): 127-136.
Yoo, H. Y., K. Lee, and B. D. Kwon, 2008a. A Comparative Study of 3D DWT Based Space-borne Image Classification for Different Types of Basis Function, Korean Journal of Remote Sensing, 24(1): 57-64.
Yoo, H. Y., K. Lee, H. S. Jin, and B. D. Kwon, 2008b. Selecting Optimal Basis Function with Energy Parameter in Image Classification Based on Wavelet Coefficients, Korean Journal of Remote Sensing, 24(5): 437-444.
Yunhao, C., D. Lei, L. Jing, L. Xiaobing, and S.
Peijun, 2006, A new wavelet-based image fusion method for remotely sensed data, International Journal of Remote Sensing, 27(7): 1465-1476.