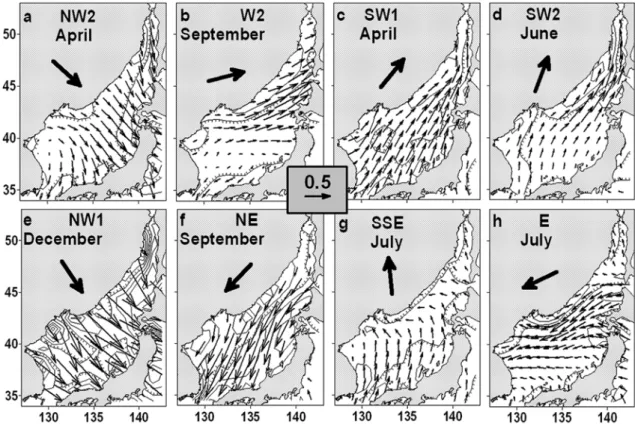
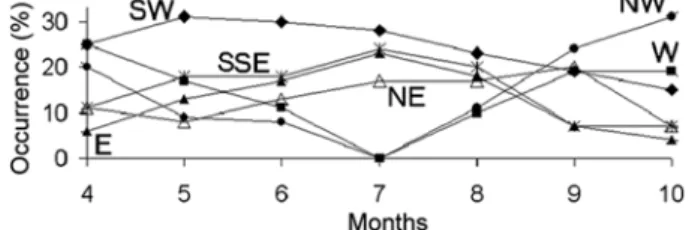
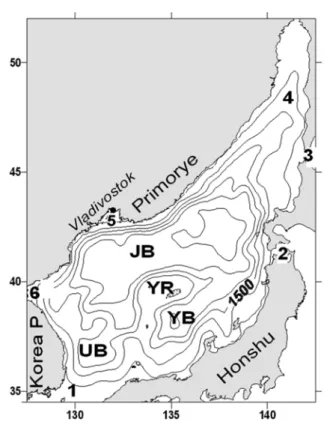
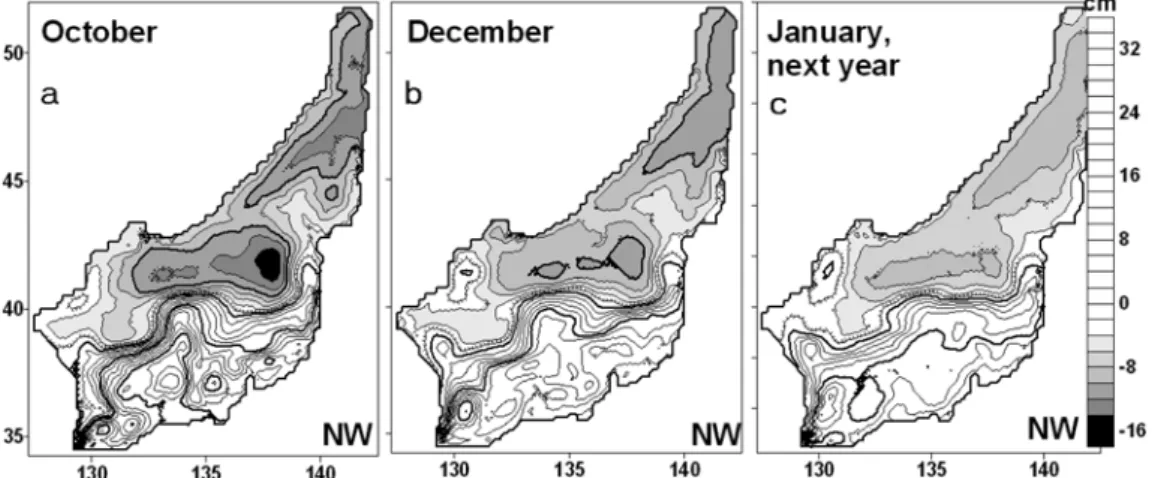
Dynamically Induced Anomalies of the Japan/East Sea Surface Temperature
19
0
0
전체 글
(2)
(3)
(4)
(5)
(6)
(7)
(8)
(9)
(10)
(11)
(12)
(13)
(14)
(15)
(16)
(17)
(18)
(19)
수치

+5

관련 문서
Daily mean of air pressure, air temperature, dew-point temperature, wind direction and speed, relative humidity and cloud amount is the average of hourly
Daily mean of air pressure, air temperature, dew-point temperature, wind direction and speed, relative humidity and cloud amount is the average of hourly
Daily mean of air pressure, air temperature, dew-point temperature, wind direction and speed, relative humidity and cloud amount is the average of hourly
Daily mean of air pressure, air temperature, dew-point temperature, wind direction and speed, relative humidity and cloud amount is the average of hourly
Daily mean of air pressure, air temperature, dew-point temperature, wind direction and speed, relative humidity and cloud amount is the average of hourly
Daily mean of air pressure, air temperature, dew-point temperature, wind direction and speed, relative humidity and cloud amount is the average of hourly
Daily mean of air pressure, air temperature, dew-point temperature, wind direction and speed, relative humidity and cloud amount is the average of hourly
Daily mean of air pressure, air temperature, dew-point temperature, wind direction and speed, relative humidity and cloud amount is the average of hourly
