말소리와 음성과학 제2권 제2호 (2010) pp. 109~115
Perturbation and Perceptual Analysis of Pathological Sustained Vowels according to Signal Typing
이 지 연
1)
․최 성 희․Jiang, Jack J.․한 민 수․최 홍 식Lee, JiYeoun․Choi, Seong Hee․Jiang, Jack J.․Hahn, MinSoo․Choi, Hong-Shik
ABSTRACT
In this paper, we investigate a signal typing on the basis of visual impression of distinctive spectrogram. Pathological voices are classified into signal type 1, 2, 3, or 4 to estimate perturbation parameters and to mark perceptual rating based on Consensus Auditory-Perceptual Evaluation of Voice (CAPE-V). The results suggest that perturbation analysis can be applied to only type 1 and 2 signals and the perceptual ratings of overall grade increase with each signal type, overall. A good inter-rater reliability is showed among three raters. We recommend that pathological voices should be marked the signal typing and CAPE-V, together, to definitely describe the characteristics of pathological voices.
Keywords: Signal typing, perturbation analysis, CAPE-V, perceptual rating
1. Introduction
In a 1995 summary statement from workshop on acoustic voice analysis, Titze proposed that signals should be assessed and categorized as type 1, 2, or 3 to determine whether a particular signal is appropriate for perturbation analysis [1]. In his system, type 1 signals are nearly periodic and therefore suitable for perturbation analysis. Type 2 signals contain strong modulations or sub-harmonics and type 3 signals are irregular and aperiodic.
Such signals might not be appropriate for perturbation analysis [1-2]. Today, Titze’s recommendations continue to be employed to determine the suitability of voice signals for perturbation analysis [3-6]. Recently, the addition of signal type 4 to Titze’s voice classification scheme is proposed [7]. This signal type 4 is
1) Department of Surgery, Division of Otolaryngology ―Head and Neck Surgery, University of Wisconsin Medical School, 5745a Medical Sciences Center, 1300 University Avenue, Madison, WI 53706. E-mail: [email protected]
Received May 13, 2010.
Revision June 17, 2010.
Accepted June 23, 2010.
primarily stochastic in behavior and is therefore unsuitable for both perturbation and nonlinear dynamic analysis [7-8].
Recently, the Consensus Auditory-Perceptual Evaluation of Voice (CAPE-V) has discussed and standardized as a tool for clinical auditory-perceptual assessment of voice. The CAPE-V has developed from a consensus meeting sponsored by the American Speech-Language-Hearing Association’s (ASHA) Division 3:
Voice and Voice Disorders, and the Department of Communication Science and Disorders, University of Pittsburgh, held in Pittsburgh on June 10-11, 2002. More detailed information has been given in [9-11].
The objective of this paper is to introduce signal typing and CAPE-V which have recently discussed in the United States of America (USA) and to look at their relation. We will classify pathological voices into type 1, 2,
3, and 4 in the basis of characteristic spectrogram patterns.
Then, we will compare acoustic characteristics of pathological
voices by using perturbation analysis (including jitter and
shimmer), and signal-to-noise ratio (SNR) according to signal
types. Finally, we will examine the relation between signal typing
and perceptual rating using CAPE-V.
2. Methods
2.1 Material
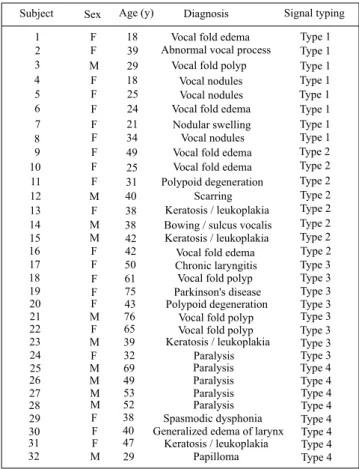
The pathological voice samples utilized in this study were selected from the Disordered Voice Database, model 4337, Version 1.03, developed by the Massachusetts Eye and Ear Infirmary Voice and Speech Lab. [12]. We selected 32 pathological subjects including 11 males and 21 females, ranging in age between 18 and 76 years from this database. The subject information is shown in <Table 1>, and more detailed information has been given in the Disordered Voice Database. Sustained vowel /a/ phonations (0.8-1.3 seconds in length) were used and all voice data were sampled at 44.1 kHz.
2.2 Spectrogram analysis
The signal typing was conducted during voice team meetings consisting of 3 trained speech-language pathologists. Complete agreement on the signal typing for each patient was required. For instances in which there was disagreement, discussion was held and data were reviewed until complete agreement was achieved.
Signal typing was chosen to achieve a visual impression of the acoustic content of the voice samples. Narrow band spectrograms were generated using the Praat software version 5.1.02 (Website:
www.praat.org, P. Boersma and D. Weenink, Amsterdam, Netherlands). Narrow band spectrograms were created with a window length of 50 millisecond, a time step of 0.002 seconds, a frequency step of 5Hz, and a dynamic range of 40dB. A hamming window shape was used to generate the spectrogram.
2.3 Perturbation analysis
The acoustic perturbation measures (percent jitter and percent shimmer) and SNR were obtained from the TF32 software [13].
Jitter is a measure of cycle-to-cycle fluctuations in the fundamental period. Shimmer is a measure of cycle-to-cycle variation in waveform amplitude. SNR indicates the amount of noise present in the speech waveform. They were extracted from the whole recording of average 1 second in length excluding the onset and offset. The reliability of jitter, shimmer, and SNR was assessed using the TF32 generated values of “Trk” and “Err”. “Trk”
provides an indication of the number of dramatic fluctuations in pitch, while “Err” quantifies large variations in the calculated fundamental frequency indicative of voice breaks [13].
Subject Sex Age (y) Diagnosis Signal typing
1 2 3 4 5 6 7 8 9 10 11 12 13 14 15 16 17 18 19
Type 1
F 18 Vocal fold edema
Type 1 F 39 Abnormal vocal process
Type 1
M 29 Vocal fold polyp
F 18 Vocal nodules Type 1
F 25 Vocal nodules Type 1
F 24 Vocal fold edema Type 1
F 21 Nodular swelling Type 1
F 34 Vocal nodules Type 1
F 49 Vocal fold edema Type 2
F 25 Vocal fold edema Type 2
F 31 Polypoid degeneration Type 2
M 40 Scarring Type 2
F 38 Keratosis / leukoplakia Type 2 M 38 Bowing / sulcus vocalis Type 2 M 42 Keratosis / leukoplakia Type 2
F 42 Vocal fold edema Type 2
F 50 Chronic laryngitis Type 3
F 61 Vocal fold polyp Type 3
F 75 Parkinson's disease Type 3
20 F 43 Polypoid degeneration Type 3
21 M 76 Vocal fold polyp Type 3
22 F 65 Vocal fold polyp Type 3
23 M 39 Keratosis / leukoplakia Type 3
24 F 32 Paralysis Type 3
25 M 69 Paralysis Type 4
26 M 49 Paralysis Type 4
27 M 53 Paralysis Type 4
28 M 52 Paralysis Type 4
29 F 38 Spasmodic dysphonia Type 4
30 F 40 Generalized edema of larynx Type 4
31 F 47 Keratosis / leukoplakia Type 4
32 M 29 Papilloma Type 4
Table 1. Subject information
2.4 Perceptual analysis
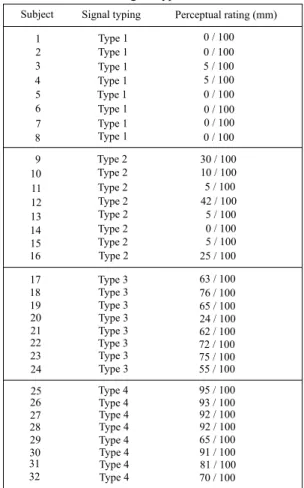
All of the voices were subjectively rated. Each voice sample was independently rated and required to complete the ratings only once by three certified raters. Raters were blinded to the voice type and pathology. Each rater could replay a sample as many times as necessary to determine a rating. The CAPE-V was used to evaluate overall grade.
After the clinician has completed all ratings, he or she should measure ratings from each scale. To do so, he or she should physically measure the distance in mm from the left end of the scale. The mm score should be written in the blank space to the far right of the scale, thereby relating the results in a proportion to the total 100 mm length of the line. In CAPE-V, the results can be reported in two possible ways [9-11]. First, results can indicate distance in mm to describe the degree of deviancy, for example “73/100” on “strain.” Second, results can be reported using descriptive labels that are typically employed clinically to indicate the general amount of deviancy, for example “moderate- to-severe” on “strain.”
In here, pathological voices were described by the first rating
method according to overall dysphonia: Moderate to severe degree
of overall dysphonia (78/100), moderate roughness (56/100),
moderate to severe breathiness (74/100) and strain (62/100). The three raters’ scores were averaged and an overall mean score for each voice type was determined.
3. Results
3.1 Signal typing
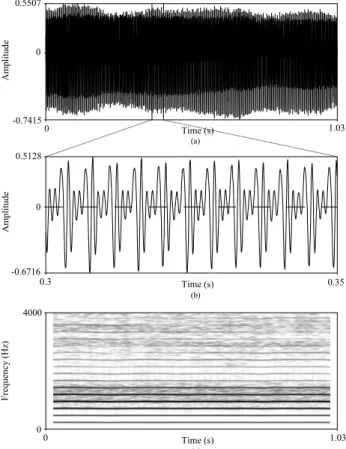
<Figure 1> shows waveforms and spectrogram of type 1 signal. Waveforms of this signal were considered nearly periodic as shown in <Figure 1.(a) and (b)>. In <Figure 1.(c)>, the spectrogram for type 1 signal showed clearly defined, nearly straight harmonics of a variable number and spacing. Noise between harmonics was minimal in type 1 voice.
<Figure 2> shows waveforms and spectrogram of type 2 signal.
In type 2 signal, noise between harmonics formed clearly defined subharmonics. In some cases, modulations caused the harmonics to appear wavy. Areas of subharmonics or modulations were often transient. Signals were rated type 2 if they contained one or more segments with a substantial lack of periodic structure in the waveform and modulation existed as shown in spectrogram of
<Figure 2.(c)>.
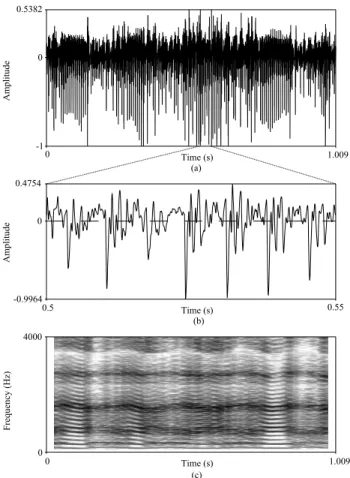
<Figure 3> shows waveforms and spectrogram of type 3 signal. Type 3 signal showed a smearing of energy across multiple harmonics. Although the fundamental frequency was often apparent, higher harmonics could not be distinguished in <Figure 3. (b)>. Most of the harmonics were obscured by low frequency noise. Signals were rated type 3 if they contained segments of strong subharmonics, modulations, or other bifurcations (a sudden qualitative change in the pattern of the signal).
<Figure 4> shows waveforms and spectrogram of type 4 signal. Type 4 signal was characterized by complete absence of harmonics. It also showed a destroyed spectrogram so that we couldn’t see any evidence showing subharmonics, modulations, and bifurcations. Finally, the type 4 signal was characterized by diffuse energy spanning the range of frequencies displayed.
3.2 Perturbation analysis
<Figure 5, 6, 7, and 8> show the “Trk”, “Err”, jitter (%), shimmer (%), and SNR (dB) estimated in signal type 1, 2, 3, and 4 signals, respectively. Both “Trk” and “Err” values increased significantly from type 1 to type 4 signals. Using our cutoff of
“Err” less than 10, only type 1 and type 2 voices were appropriate for acoustic analysis. Both jitter (%) and shimmer (%)
Time (s)
0 1.03
-0.7415 0.5507
0
Time (s)
0.3 0.35
-0.6716 0.5128
0
Time (s)
0 1.03
0 4000
Frequency (Hz) Amplitude Amplitude
(a)
(b)
(c)
Figure 1. Signal type 1. (a) Whole waveform (b) an enlarged waveform of specific frame (0.3s – 0.35s) (c) spectrogram
Time (s)
0 1.002
-0.9811 0.6464
0
Time (s)
0.55 0.6
-0.7133 0.552
0
Time (s)
0 1.002
0 4000
Frequency (Hz)
(a)
Amplitude
(b)
Amplitude
(c)
Figure 2. Signal type 2. (a) Whole waveform (b) an enlarged
waveform of specific frame (0.55s – 0.6s) (c) spectrogram
Time (s)
0 1.009
-1 0.5382
0
Time (s)
0.5 0.55
-0.9964 0.4754
0
Time (s)
0 1.009
0 4000
Frequency (Hz)
(a)
Amplitude
(b)
Amplitude
(c)
Figure 3. Signal type 3. (a) Whole waveform (b) an enlarged waveform of specific frame (0.5s – 0.55s) (c) spectrogram increased with each voice type. Similarly, SNR decreased from type 1 through type 4 voices, indicating that the evidence of harmonics decreased as signal type increased.
3.3 Perceptual analysis