Abstract
Purpose – This paper proposes measurement models to evaluate the management performance of small and medium-sized retail busi- nesses on the basis of a trading area analysis that compares their proposed revenue to actual revenue in the trading area.
Research design, data, methodology –The study proposes measure- ment models consisting of five stages, namely: (1) district background survey, (2) customer survey, (3) competitor survey, (4) business dis- trict survey, and (5) business performance analysis.
Results – To identify business districts easily, this study preferred a minor-adjusted method based on the Euclidean distance, as it is simple to employ for the small and medium-sized businesses. This model was applied to select coffee shops in Daejeon. Results in- dicated that although the targeted shop was not located in an appro- priate location, actual sales were higher than expected.
Conclusions – Small- or medium-sized retail businesses face diffi- culties regarding the economies of scale and brand recognition and must choose an appropriate location to ensure management stability.
However, such businesses will find it difficult to evaluate their com- petitive edge accurately using a trading area analysis.
Keywords : Trading Area Analysis, Management Performance Evaluation, Small- or Medium-sized Businesses
JEL Classifications : L81, R12.
1. Introduction
The retail industry directly facing customers tends to grow its size and industrialize as the distribution market opens more. This makes business environment for the self-employed businesses difficult to re-
* This is a full script of the draft paper presented at the 2012 international winter conference of KODISA, which passed panel discussion of two panelists and blind review of three reviewers.
** Corresponding & Fist Author, Assistant Professor, Department of Logistics & Distribution Management, Hyechon College, Daejeon, S.
Korea.
Tel.:+82-42-580-6403, E-mail: [email protected]
alize the scale economics even worse. However, it is true that the number of small- or medium-sized businesses foundation has gradu- ally increased due to sagging economic recession and unstable employment. An analysis on actual conditions of small business by the SMBA (Small & Medium Business Administration, 2007) states that most people who established their own businesses with no alter- native accounted for 79.3% (Table 1). An analysis on actual con- ditions of small business foundation and financial structure improve- ment fund users, published by SMBA (2001) pointed out that fewer sales because of economic stagnation and keen competition in same business type were the major difficulties in business administration.
More active government supports are required because small- or me- dium-sized businesses have very dire environment (Yun & Jeong, 2011). Site, commodities and management capability are the three key factors for success in the retail establishment and it is known that the site is the most important (Kim, 2011). The location selection is a crucial factor in the retail industry and every more for self-employed businesses. This study analyzes the trading area easily applied for small- or medium-sized business which sell similar products and pro- poses methods of evaluating management performance by comparing theoretical revenue to the actual figures in the trading area.
Therefore, the study proposes an analysis model easy for small- or medium-sized businesses to adapt and investigate real cases based on the model, rather than macroscopic location analysis or precise loca- tion attractive analysis through variable sophistication. First, the study chooses small- or medium-sized private shops for analysis and de- termines theoretical business district ranges considering the area of the shop and the distance from competitors. Based on this, the study pre- dicts the number of customers in a district and proposes how to eval- uate competitiveness of the shop and location appropriateness by comparing the prediction to actual customers
<Table 1> Motives of Small Business Foundation
Motives of business foundation
Support living lives (no alternative
available)
Judge success possibility by
business foundation
Take over family business
Major
areas Miscellaneous
Proportion 79.3% 16.4% 2.1% 0.5% 1.7%
Source: An Analysis of Actual Conditions of Small Business published by Small &
Medium Business Administration (2007).
Recited from Yun & Jeong (2011).
An Empirical Approach to Evaluate Management Performance Using a Trading Area Analysis: Focus on Small and Medium-sized Retail Businesses*
1)
Jae-Ho Bae**
business (%) Keen competition in same business type 111 26.0 Less sales because of economic stagnation 225 52.7 Shortage of fund in accordance with business expansion 55 12.9
Shortage of experience and knowhow 15 3.5
Others 21 4.9
Total 427 100
Source: An analysis on Actual Conditions of Small Business Foundations and Financial Structure Improvement Fund Users, published by Small & Medium Business Administration (2001).
Recited from Yun & Jeong (2011).
2. Related Works
The law of retail gravitation is a traditional trading area analysis based on the law of gravitation that the attractive force between two materials are proportional to the product of the masses of the two materials and inverse proportion to the square of the distance (Reilly, 1929, 1931). The law may be summarized that the portion of retail sales of a small city from two competitive cities is proportional to the population of the two and inverse proportional to the square of the distances from the small one between the two. Then, Converse developed applied the Reilly's equation to solve the boundary of the location (Converse, 1949) and Ellwood replaced the distance and the population in the Reilly's equation with the travel time and floor spaces to calculate the rate of attracting purchase from a wholesale/re- tail area (Ellwood, 1954). Meanwhile, Huff suggested that there need- ed to implement probabilistic approaches, rather than existing de- terministic ones because customers tend to visit several stores, not frequently visit one store when they have a lot of alternative shops (Huff, 1962, 1964). Applebaum(1968) proposed the method of con- figuring business district called the C.S.T. (Customer Spotting Technique) through empirical studies on supermarkets. The Huff's probabilistic method has been developed to the MCI (Multiplicative Competitive Interaction) or the MNL (Multinomial Logit) model which evaluate utility functions by substituting attractive factors of a shop including the floor area to assortment, atmosphere, parking lot, service quality and price or the proximity shown by distance to a shop to traffic cost or convenience (Nakanish & Cooper, 1974;
Amold, Roth & Tigert, 1980; Davies & Rogers, 1984; Birkin &
Clarke, 1991).
Studies related to the location analysis have been robustly per- formed in Korea mainly focused on large distribution channels or de- partment stores (Lee, 1998; Lee and Kim, 2000; Lee and Park, 2004;
Lee, 2004; Lee et al, 2006; Kim, 2010; Lee & Yuh, 2010; Kim &
Ahn, 2010) or location analyses of restaurant franchises (Lee, 2009).
These studies further categorize attractiveness and efficiency repre- sented by floor area and distance, respectively. Measuring distances which evaluates proximity includes using the GIS (Lee & Kim, 2000;
Lee et al., 2006; Kim, 2010; Beck, 2001), navigation like the Internet
precisely defining trading area but are too difficult for small- or me- dium-sized businesses to apply. A common hypothesis found in the previous studies related to the location analysis is that each shop in a district may be selected by customers and the possibility tends to show that higher attractiveness increases selection probability and far- ther distance lowers efficiency, as well as the probability. In the as- pect of competitiveness for each store, it means that the current com- petitiveness of a shop decreases if it has fewer customers than that in a theoretic business district. Meanwhile, the number of visiting cus- tomers would be larger if the shop has a high competitive edge.
Meanwhile, small- or medium-sized businesses face fiercer competi- tion after the distribution market opens. It is evaluated that most tra- ditional markets, clusters of the small- or medium-sized businesses have no exception(Lee et al., 2011). Kim (2004) states that the mar- kets show rapid downturn due to failing to face rapid environmental changes and that is why phenomena including expanding retail dis- tribution, fierce competition by entering multi-national distributors in the Korean market and introducing advanced marketing and manage- ment methods. Traditional markets have gained supports for modern- ization since the Participatory Government and various studies have been performed to level out various issues (Kim, 2004; Kim et al, 2009a; Kim et al, 2009b; Lim et al, 2011; Jung et al., 2006; Choi &
Yoon, 2008; Yang et al., 2011). However, supports for the self-em- ployed small- or medium-sized businesses that fail to establish their influence areas are insufficient despite their poor environment. What is more it is difficult to find studies about trading area for small- for medium-sized business except recent few works (Kim et al., 2012;
Park et al., 2012). In this paper, trading area analysis is performed for small- or medium-sized businesses which have already located in some place and no plan to move for the time being. Most simple method to evaluate management performance is also presented based on this analysis.
3. Management Performance Evaluation through Business District Analysis
3.1. Management Performance Evaluation Model through Business District Analysis
The purpose of the study is to develop a model for location ap- propriateness and management performance measurement model which may be easily applied to the location for small- or medium-sized businesses Therefore, the study focuses on proposing the evaluation model rather than developing a new theory or sophisticating existing theories and evaluate the properness of the model by introducing it to actual shops. The evaluation model proposed in the study uses meth- ods easily applied to the site and begins with background inves- tigation in which the stop is located. Then, visiting frequency, major item purchase and average money spent are collected through custom-
er survey on visiting customers evaluate outline attractiveness with residential areas. The competitor location analysis surveys locations and floor areas of the same/similar businesses in the business district.
Then, the business district is outlined based on competitor locations and the study defines the districts using the Euclidean distance and floor area. For the convenience, the study utilizes the exclusive busi- ness district model rather than the Huff's probabilistic theory and vis- ually redefines the district area using the location map after outlining the business district. Here, the study checks the number of potential customers considering the residential or floating population in the dis- trict and evaluates the location properness by reviewing break-even point of the shop. Finally, the study compares the numbers of actual visiting and potential customers and analyzes the management per- formance, as well as business performance. Fig. 1 below depicts the proposed model.
3.2. Major Activities of the Proposed Model for each Phase
3.2.1. District Background Survey
It is a stage which investigates general environment of a shop for analysis. Surveys on local population and ratio shall be performed be- cause the robustness of a local business district is closely related to the population and the population ratio of the location. Also, surveys on floating population in that area shall be performed. The population or ratio means potential sales in the area and the floating population is closely linked to the current sales. The expected revenue may be calculated by introducing the population information with references like average consumption of major items in the shop. The actual rev- enue depends on attractiveness of the shop or local features.
However, calculating sales forecast is valuable information in inves- tigating the initial point. The study is for small- or medium-sized business and the survey range of customer visit is not relatively large. In particular, most business districts in downtown are separated by large streets when main customers visit the shop on foot. Also,
the areas under analysis shall be confirmed by site survey or maps because the categories based on administrative districts and business districts may not coincide with.
3.2.2. Customer Survey
It is the stage which investigates major inputs of the proposed model for customers of the shop. The survey investigates visiting fre- quency, major purchase items, average money spent and residences.
The information from the phase is used for attractive evaluation, as well as a crucial input in the future business district determination.
Also, the survey results of purchase characteristics of customers may be used with residing or floating population from the background stage as an important factor in evaluating expected revenue.
3.2.3. Surveying Competitors and Determining Business District The competitor survey investigates distances between the shop and its competitors, sales revenues and areas of the competitors. The ac- tual revenues of competitors may be very useful in evaluating busi- ness performances or location appropriateness. However, it is very difficult to achieve the information. Meanwhile, it is relatively easy to acquire external information including distances or areas of the competitors. The study focuses of achieving and utilizing external in- formation considering availability in the site.
The first law of Converse (1949) or the Applebaum's C.S.T. meth- od (1968) is widely used to estimate business district of nearby two cities of (). As shown in the Equation (1), the first law of Converse defines a business district based on the distance () and the population of the two cities (). That is, the equation judg- es that the attractiveness depends on the population and the district range is expanded with more population. Meanwhile, the latter meth- od in the Equation (2) represents the district limit as time and as- sumes that the attractiveness depends on the area (). The model defines the time () to the business district in the city based on the traffic time () and the area.
<Figure 1> Proposed model to evaluate business performance based on the result of trading area analysis
<Eq. 2>
However, the Equation (1) is not suitable because it uses the pop- ulation as attractiveness and the study is not intended to define the business district among cities. Even worse, the Equation (2) defines the business district based on the traffic time among the cities and is not good for direct application to the study intended to define the district with Euclidean distance among competitors. Therefore, the study applies the Equation (3) below which uses the Euclidean dis- tance () and shop area () to define the business district for convenience.
<Eq. 3>
Actual models which define business districts may be more sophisticated. Commonly found fact from previous studies is that the attractiveness of the shop is related to the area and the distance of the shop. The Euclidean distance among shops is used for a wide area. However, abovementioned, various measurements including the GIS or navigations have been introduced. It is known that physical, as well as psychological distance matters for the actual distance among shops. Customer routes depend on streets and it may be said that the traffic time is closer to the psychological distance. Lee (2011) states that unpleasant facilities on the route increase the psy- chological distance and affect establishing business districts according to the Huff's model.
The measurement is difficult to apply to individual small- or me- dium-sized businesses. Therefore, the study introduces the Euclidean distance but more proper to introduce accurate measurements if possible. The study applies the Euclidean distances among shops to determine business districts, as well as modifying district range visu- ally using nearby facilities. It is because people tend to avoid ob- structions (large streets, obstructions, and etc.) on their routes even though traffic time matters (Lee, 2011). Once the business district is defined through the processes, expected sales revenues for each store may be calculated using the information and it shows the location appropriateness for the shop.
3.2.4. Management Performance Analysis
The management performance may be evaluated the number of vis- iting customers against the potential figures. Generally, the location appropriateness depends on the number of the potential customers.
Meanwhile, it is proper to measure the management performance based on how many potential customers turn into actual ones. The
vey and district determination phases. Here, the management perform- ance is analyzed based on the actual number of visiting customers. It may be judged that the shop shows excellent management perform- ance if it has more actual customers than the potential customers.
4. Case Analysis
4.1. Selecting Shops for Analysis, Surveying District Background and Customers
Coffee shops in Daejeon are selected to apply the analysis model proposed in the study. Gwanjeo-dong, where the shops under analysis are, is located in the southwestern part of the city and a little bit far from the downtown, causing to form a relatively independent business district. During the survey, it is found that the deposit of an existing shop with size ranges 50 - 80 million KRW and monthly rent- al fee is between 1.50 and 2.20 million KRW. Also, the demographic figure shows that most people in the area are parents in the early 30s to early 40s and their children. However, the portion of 20s largely increases due to a medical university in the area. Table 3 be- low summarizes the overall demography in the area. In addition, the area is highly likely to be developed because subway line No. 2 opens, Doan New Town develops and a large mall with area opens.
<Table 3> Demographical profile
Age Male Female Total
16,329 17,321 33,650
Under 10 2,617 2,466 5,083
10 ~ 19 3,321 3,214 6,535
20 ~ 29 1,488 1,659 3,147
30 ~ 39 2,886 3,764 6,650
40 ~ 49 3,566 3,262 6,828
50 ~ 59 1,396 1,378 2,774
60 ~ 69 633 773 1,406
Over 70 422 805 1,227
The shop opened in 2008 as the first coffee shop here and there are a total of 9 shops including 4 individual and 2 similar shops.
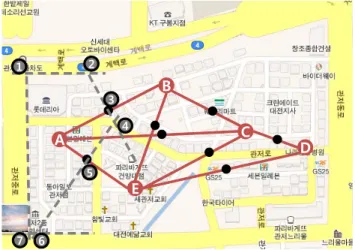
Therefore, it is judged to have a fierce competition overall. It is judged that the access to the shop is limited on foot because it is physically separated from large streets as shown in Figure 2. The trend is confirmed in the actual customer survey. The location is sur- rounded by offices and restaurants and has a constant floating pop- ulation on weekdays and weekends. Ⓐ with red circle in Figure 2 is the shop for analysis and Table 4 shows the floating population from both entries of the shop during the business hour.
A
<Figure 2> Layout of analyzing district
<Table 4> Profile of floating population on the target district Floating
Population Standard
Male Female
Weekend Weekdays Weekend Weekdays Entrance
1
10s 88 42 81 56
20s 49 73 42 121
30s 52 31 61 94
40s 61 51 69 79
Over 50s 37 45 37 32
Entrance 2
10s 53 42 61 49
20s 15 27 24 27
30s 14 33 72 51
40s 40 41 75 63
Over 50s 38 37 46 35
4.2. Competitor Survey, District Determination, Management Performance Analysis
Table 5 shows the areas of and distances from the shop (unit: m) after selecting 4 competitors in the district for the survey. The actual competitors are spotted on the map based on Table 5 and Figure 3 shows nodes from the shop Ⓐ.
<Table 5> Calculation result of branchpoint with competitors Shop Ⓐ
()
Shop Ⓑ ()
Shop Ⓒ ()
Shop Ⓓ ()
Shop Ⓔ ()
Shop Ⓐ 170 (80) 290 (145) - 130 (55)
Shop Ⓑ - 150 (79) - 165 (74)
Shop Ⓒ - - 95 (45) 200 (84)
Shop Ⓓ - - - 280 (126)
Then, a polygon of 1-2-3-4-5-6-7 is formed by points (1 and 7) from the large map, node from the competitor Ⓑ, points (3 and 5) from the node with the competitor Ⓔand the points (2, 4 and 6) by the perpendicular from the node. Here, competitors Ⓒ and Ⓓ are ex-
cluded because they are not direct competitors. The business district defined here contains roads avoided on actual routes and Figure 4 shows the redefined business district of the shop Ⓐ after reflecting the issue. Usually roads are major obstructionsfor customer’s accessi- bility (Lee, 2011). So, the district is redefined by shrinking the area where people cross the road for visit the shop and expanding the
ⓐ
areaⓑ where people cross the road to visit its competitors.
ⓐ
ⓑ A
B
C D
E
<Figure 4> Final adjusted trading area
There are about 500 adults in the adjusted business district and 1,500 cups of coffee will be sold if they drink 3 cups of coffee a month (The trade statistics released by the Korea Customs Service shows that a Korean adult drinks 3 cups of whole bean coffee a month). As shown in figure 5, expected sales revenue would be 6 million KRW/month considering that it costs 4,000 KRW for a cup.
The BEP (Break-even Point) considering fixed and variable costs for the shop is estimated 4.86 million KRW/month and the net profit would be 1.14 million KRW/month, indicating that it is not a good location. Also, the actual monthly revenue of the shop is higher than expected, 8 million KRW/month. This means that the customers con- sume more coffee than average or there may be additional customers outside the district. In conclusion, it suggests that the management
A
B
C D
E
1 2
3 4 5
7 6
<Figure 3> Illustration of branchpoint with competitors
Number of Customers Sales Amount
(million KRW)
2.80 4.86 8.00
Variable Cost
Fixed Cost BEP
Actual Sales
Total Cost 6.00
405 500 667
Potential Sales
<Figure 5> BEP and actual sales amount
5. Conclusion
The study proposes the management performance model through the business district analysis which may be easily used by small- or medium-sized businesses and a simple analysis is performed for the actual shop. Propose method is consist of five stages which are 1) district background survey, 2) customer survey, 3) competitor survey, 4) determining business district, and 5) business performance analysis.
Case study for a small-sized business is also performed. The study investigates background district where the shop is located and under- stands general characteristics through customer survey. Then, survey- ing competitors in the location define the initial district and the dis- trict is readjusted considering obstructions or unpleasant facilities in case of approaching. The number of potential customers or expected revenues is estimated using the defined business district and the loca- tion appropriateness is evaluated considering costs for the shop.
Finally, the management performance is measured considering the forecast and actual revenues.
As a result, the management performance is evaluated excellent be- cause the actual revenue highly exceeds the forecast even though the location is not good due to a small gap between the BEP and the forecast for the shop. The main difference between other works will be easiness to use. The purpose of the study is to develop a model for location appropriateness and management performance measure- ment model which may be easily applied to the location for small- or medium-sized businesses Therefore, the study focuses on proposing the evaluation model rather than developing a new theory or sophisti- cating existing theories and evaluate the properness of the model by introducing it to actual shops.
However, the study has some limitations. There is no way to find out whether the difference between the forecast and the actual figure comes from additional customers outside or sales more than average without tight customer survey. Also, it is difficult to define accurate business district due to using the Euclidean distance, rather than ac- tual one and the exclusive business district does not coincide with
which may have difficulties in evaluating their revenues and business performance under the circumstances, as well as proposing a business analysis model which may be referred to various businesses.
Received: October 18, 2012 Revised: November 29, 2012 Accepted: December 17, 2012
References
Amold, S. J., Roth, V. & Tigert, D. (1980), "Conditional Logit ver- sus MDA in the Prediction of Store Choice", Advances in Consumer Research, 8, 665-670.
Applebaum, W. (1968), A Guide to Store Location Research, MA:
Addison-Wesley.
Beck, Yeong-Ki (2001), "A GIS Based Spatial Decision Support System for Retail Center Location", Journal of the Korean Geographical Society, 36(3), 278-291.
Birkin, M. & Clarke, G. P. (1991), "Spatial Interaction in Geography", Geography Review, 4(5), 16-24.
Choi, Ho-Kyu & Yun, Jung-keun (2008), “Development of Traditional Marketplaces in the New Distribution Market: with Emphasis on Daejeon Metropolitan City”, Journal of Distribution Science, 6(1), 25-46.
Converse, P. D. (1949), "New Laws of Retail Gravitation", Journal of Marketing, 14, 379-384.
Davies, R. D. & Rogers, D. S. (1984), Store Location and Store Assessment Research, New York: John Willey & Sons.
Ellwood, L. W. (1954), "Estimating Potential Volume of Proposed Shopping Centers", The Appraisal Journal, 22, 581-599.
Huff, D. L. (1962), Determination of Intra-urban Retail Trade Area, University of California, L.A.
Huff, D. L. (1964), "Defining and Estimating a Trade Area", Journal of Marketing, 28, 34-38.
Jung, Nan-Ho, Kim, Nam-Myun & Sun, Il-Seok (2006), “A Study on Consumer's Choice Factors for Retailer Shops: Focused on Traditional Market, Super Supermarket and Discount Store in Daejeon, Korea”, Journal of Distribution Science, 4(2), 41-64.
Kim, Ah-Reum (2011), “A study on the Factors of Selecting Coffee Shop's Location", in Proceedings of 2011 winter conference of KODISA, Seoul, Korea: KODISA, 419-433.
Kim, Dae-Young (2010), "The Location Analysis and Optimum Location Choice for Large-scale Discount Store using GIS", The Geographical Journal of Korea, 44(4), 661-670.
Kim, Min-Jung, Shin, Se-Kye, Lim, Sang-Gu, & Bae, Jae-Ho (2012),
“A Location Analysis for Small or Mid-sized Franchise Restaurant: Focused on the Area of Dunsan-Dong, Daejeon City”, in Proceedings of the 11thKKITSspringconference, Chungju, Korea: KKITS, 111-115.
Kim, Pan-Jin, Kim, Kyeong-Cho, Namkung, Suk & Youn, Myoung-Kil
(2009a), “A Study on the Customers' Awareness for Modernizing the Facilities of Traditional Market”, Journal of Distribution Science, 7(1), 55-70.
Kim, Sang-Chul (2004), “A Study on the Competition Strategies for Traditional Market”, Journal of Distribution Science, 2(2), 17-32.
Kim, Yoo-Oh, Ji, Hae-Myoung & Youn, Myoung-Kil (2009b),
“Reflections on the Distribution of Gift Certificates for Stimulation of Traditional Markets ”, Journal of Distribution Science, 7(4), 37-46.
Kim, Young-Rok & Ahn, Jeong-Keun (2010), "A Study on the Choice Characteristics of Consumer Behaviors for Department Stores in Capital Region", Journal of Korea Real Estate Society, 28(1), 35-53.
Lim, Jin, Kim, Young-Ki, Lee, Min-Kweon, Kim, Yoo-Oh & Youn, Myoung-Kil (2011), “Consideration of the Traditional Market-Related Law Revision Plan: Focus on Moranjang in Seongnam”, Journal of Distribution Science, 9(2), 37-47.
Lee, Hee-Yeon & Kim, Ji-Young (2000) "A Study on the Locational Characteristics and the Trade Area of Large-scale Discount Stores", Journal of Planners Association, 35(6), 61-80.
Lee, Heung-Woo & Park, Won-Seok (2004), "A Study on the Characteristics of Market Boundaries between Adjacent Big Discount Stores: A Case Study of E-Mart and Home Plus in Buk-gu, Daegu", Journal of the Korean Regional Science Association, 20(1), 41-63.
Lee, Jae-Hong & Yuh, Hong-Koo (2010), "Analysis on the Locational Characteristics of Large-Scale Discount Store per Type", The Geographical Journal of Korea, 44(4), 683-695.
Lee, Sang-Hyun (2011), “A Development of Business Geographic Decision Model Through Enhancing The Huff Model:
Focused on The Improvement of ESRI Model(2008)”, Journal of the Architectural Institute of Korea, 27(6), 151-160.
Lee, Sang-Kyu (2004), "A Study on the Effects of Locational Factors in the Determination of Sales Volumes of Large Discount Stores", The Korea Spatial Planning Review, 40, 35-52.
Lee, Su-Dong (1998), "Total Evaluation for the Existing Theories about the Trade Analysis and Demand Location", Management and Marketing, 22(2), 26-30.
Lee, Young-Chul, Lee, Yu-Kyung, Lee, Han-Na, & Kim, Young-Bae (2011), " The Effectof Choice Attribute of Traditional Market and Relationship Quality from the Perspective of Students", in Proceedings of 2011 winter conference of KODISA, Seoul, Korea: KODISA, 213-230.
Lee, Yong-Ik, Hong, Sung-Eon, Kim, Jung-Yup & Park, Soo-Hong (2006), "Analyzing the Location Decision of the Large-Scale Discount Store Using the Spatial Association Rules Mining", Journal of the Korean Geographical Society, 41(3), 319-330.
Lee, Young-Hee (2009), "A Spatial Location Analysis of the First Shops of Foodservice Franchise in Seoul Metropolitan City", Journal of the Korean Geographical Society, 44(4), 532-543.
Nakanishi, M. & Cooper, L. G. (1974), "Parameter Estimate for Multiplicative Interactive Choice Model: Least Sqares Approach", Journal of Marketing Research, 11, 303-311.
Park, Ji-Won, Kim, Kuk-Jin, Cho, Keun-Hyung & Bae, Jae-Ho (2012), “An Analysis of Management Performance for Small or Mid-sized Business Based on the Result of Location Analysis: Focused on the Coffee Shop at Daejeon City”, in Proceedings of the 11thKKITSspringconference, Chungju, Korea: KKITS, 28-33.
Reilly, W. J. (1929), Methods for the Study of Retail Relationships, University of Texas Bulletin, No. 2944.
Reilly, W. J. (1931), The Law of Retail Gravitation, New York: The Knickerbocker Press.
Tae, K. S. & Rhim, B. J. (2010), "A Study for Locating of a New Store Considering Competition for Trading Area: Focusing on the Case of Hypermarket in Seoul Metropolitan Area", Journal of the Korean Geographical Society, 45(5), 609-627.
Yang, Hoe-Chang, Kim, Sung-Il, Park, Young-Ho & Lee, Shang-Nam (2011), "A study on the Relationship between the Degree of Awareness on Low Carbon Green Growth and the Organizational Commitment Focused on the Traditional Retailers", 9(3), 37-46.
Yun, Jeong-Keun & Jeong, Eun-Hye (2011), "A Study on Small Business Development and Support Policies", in Proceedings of 2011 winter conference of KODISA, Seoul, Korea:
KODISA, 137-155.