Received: July 14, 2020 Revised: August 5, 2020 Accepted: August 20, 2020
OPEN ACCESS
HORTICULTURAL SCIENCE and TECHNOLOGY 38(5):645-659, 2020
URL: http://www.hst-j.org pISSN : 1226-8763 eISSN : 2465-8588
This is an Open Access article distributed under the terms of the Creative Commons Attribution Non-Commercial License which permits unrestricted non-commercial use, distribution, and reproduction in any medium, provided the original work is properly cited.
Copyrightⓒ2020 Korean Society for Horticultural Science.
This work was supported by the 2016 Yeungnam University Research Grant.
Growth and Bioactive Compounds of Lettuce as Affected by Light Intensity and Photoperiod in a Plant Factory Using External Electrode Fluorescent Lamps
Ji Yoon Cho 1† , Kil Sun Yoo 1† , Jiseon Kim 1 , Byung Jin Choi 2 , and Wook Oh 1*
1
Department of Horticulture and Life Science, Yeungnam University, Gyeongsan 38541, Korea
2
Department of Horticulture, Daegu Catholic University, Gyeongsan 38430, Korea
*Corresponding author: [email protected]
†
These authors contributed equally to this work.
Abstract
External electrode fluorescent lamps (EEFLs) are a new, efficient light source that can be used in plant factories. We examined the effects of light intensity and photoperiod combinations on growth, total phenolic content, antioxidant capacity, and light use efficiency of lettuce (Lactuca sativa
‘Cheongchima’) in a plant factory employing EEFLs. Two-week-old seedlings were grown for 3 weeks at a photosynthetic photon flux density of 150 (150P) or 200 (200P) μmol∙m
-2∙s
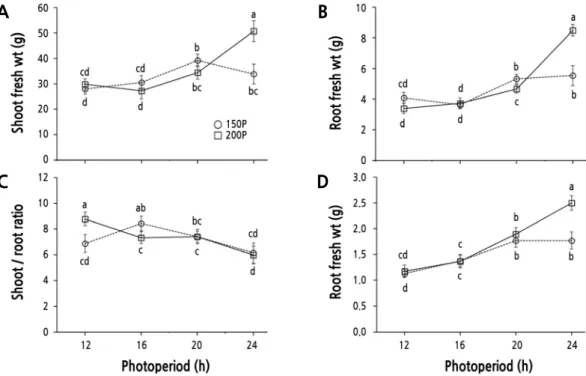
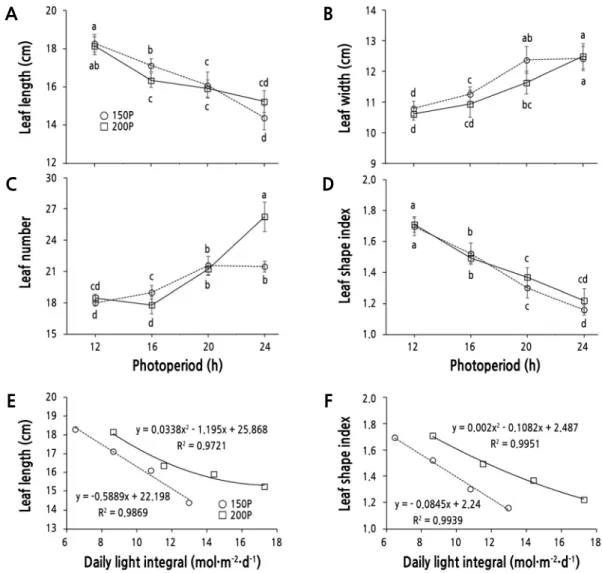
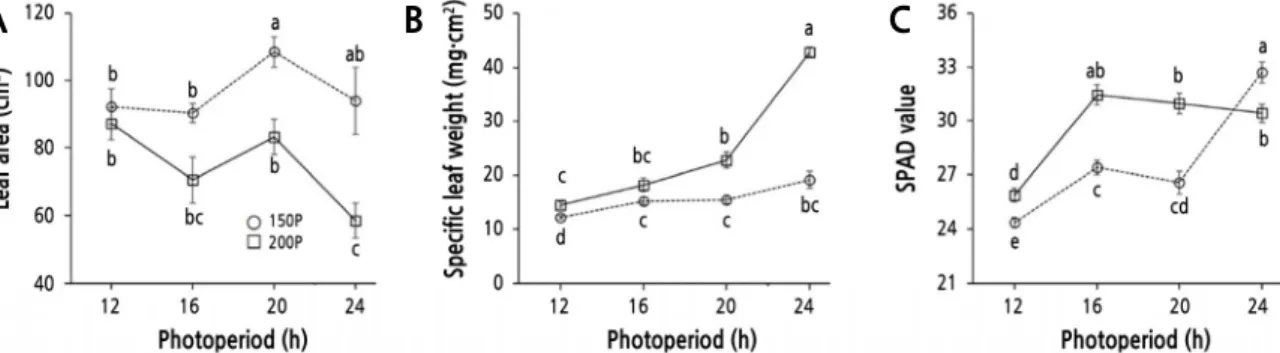
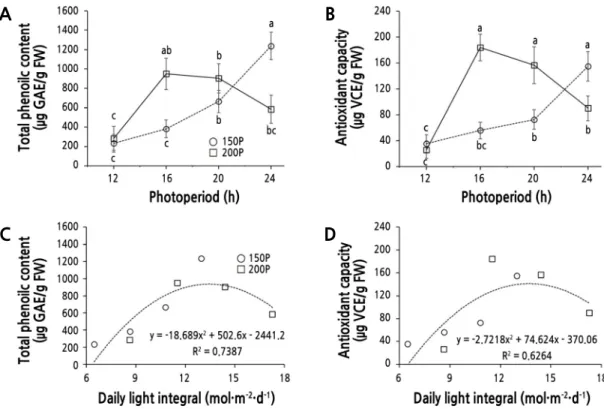
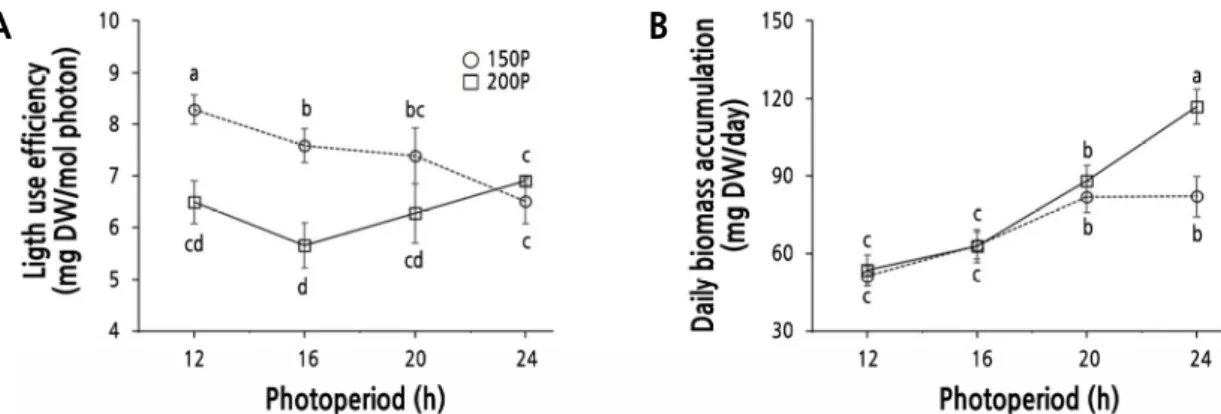
-1under 12, 16, 20, or 24 h photoperiods. The air temperature was maintained at 20 ± 2°C and Yamazaki nutrient solution was supplied using a deep flow technique. Fresh shoot and root weights increased as photoperiod was extended, becoming greatest under the 150P/24 h condition. The shoot/root ratio was lowest at the 24 h photoperiod under 150P and 200P conditions. Leaf length decreased at longer photoperiods, but leaf width and number was increased; therefore, leaf shape became broader under longer photoperiods. Leaf area increased at the 150P/20 h condition but decreased at the 200P/24 h condition. Specific leaf weight (thickness) increased significantly as photoperiod was extended irrespective of light intensity and became greater under 200P than 150P. Total phenolic content and antioxidant capacity increased continuously with increasing photoperiods under 150P; however, in the 200P treatment, both increased up to 20 h, then decreased under the 24 h photoperiod. Light use efficiency was generally higher under 150P, but became similar at either light intensity under the 24 h period. Considering the growth rate, leaf size, antioxidant capacity, and cropping cycle, the 150P/20 h condition was deemed to be the most efficient and economical for growth of ‘Cheongchima’
lettuce in a plant factory system.
Additional key words: artificial light, energy saving, environmental control, Lactuca sativa, leafy vegetable
Introduction
Environmental factors such as light, temperature, humidity, CO
2concentration, and nutrient
supply have significant impacts on the growth and development of plants. Among these, light is
considered the major factor controlling plant growth and development (Inada and Yabumoto, 1989; Gaudreau et al., 1994) because it is the main source of energy for photosynthesis and plays an important role in plant development as a stimulus signal (Wang et al., 2009). Therefore, many studies have investigated the effects of light conditions on the nutritional quality, growth and development, and phytochemical biosynthesis of plants.
Light intensity, light quality, and photoperiod can influence plants. Among these, high light intensity (HL) has increased the fresh weight of various kinds of lettuce (Lactuca sativa) (Knight and Mitchell, 1983a, 1983b; Gaudreau et al., 1994; Pavlou et al., 2007; Fu et al., 2012) and decreased nitrate concentrations in plants by increasing nitrate reductase activity (Blom-Zandstra et al., 1988; Gaudreau et al., 1995). Light quality, which is determined by the ratio of different wavelengths of light ranging from UV, visible light, to far-red light, has many sensitive effects on plants (Son et al., 2012;
Samuolienė et al., 2013; Lee et al., 2014, 2015, 2016; Park et al., 2016; Jeon et al., 2017, 2018). Therefore, light quality has various effects on the development and morphogenesis of plants (McNellis and Deng, 1995). Photoperiod not only affects the flowering of plants, but also the growth of leafy vegetables such as spinach (Spinacia oleracea) and lettuce (Inada and Yabumoto, 1989; Ali et al., 2009). In addition, extending the photoperiod increased the fresh and dry weights of lettuce (Ikeda et al., 1988; Koontz and Prince, 1986).
Recently, plant factories that use artificial lights and nutrients for plant production have become popular and important owing to the increasing prices of crops and potential for a more stable food production system (Um et al., 2010). Plant factories generally use two types of light (sunlight and artificial light) in various combinations (Hashimoto et al., 1987).
Sunlight is free, but it is difficult to control the quality and photoperiod. On the other hand, light conditions such as photoperiod can be easily controlled in plant factories that use artificial light (Kitaya et al., 1998). In addition, temperature, humidity, CO
2concentration, air flux, nutrients, and moisture can be controlled, regardless of outside environments (TIIC, 2009). Therefore, by using appropriate conditions of light and other factors, the effective production of crops with standardized quality could be possible. Among these factors, use of artificial light is an expensive, complex, and labor-intensive part of plant factories. Using continuous light without a dark period in order to increase the lifespan of the lamps and reduce the number of lamps required reduces the cost of factory operation (Koontz and Prince, 1986).
Therefore, improving the turnover rate and profits through enhanced light source efficiency and shortened cropping seasons are crucial to maintaining the sustainability and profitability of the plant factory industry.
Artificial light sources for plant production systems include high-pressure sodium lamps, metal haloid lamps, fluorescent lamps (FLs), and light-emitting diodes (LEDs) (Tibbitts et al., 1983; Kim et al., 2008; Um et al., 2009; Lee et al., 2014, 2015, 2016). These sources have been widely used in greenhouses, plant factories, and plant growth chambers (Sase and Ling, 1996). High-pressure sodium lamps and metal haloid lamps have high light efficiency, but lack blue and red light, respectively, and must therefore be used in conjunction with other light sources. A lot of research on light sources in closed plant factory systems have shown the good performance of LEDs. Whereas, some reports showed that FLs increased plant biomass similar to LEDs (Lee et al., 2012).
FLs have a spectrum appropriate for proximity lighting and are therefore widely used in plant production facilities (Kim and Lee, 1998). External electrode fluorescent lamps (EEFLs) are a new type of FL with electrodes attached outside of the tube, unlike the traditional fluorescent lamp in which the electrodes are inside. These lamps have commonly been used as the source for the back light unit (BLU) of LCD TVs and the light source of outdoor or indoor billboards (Lee et al., 2005).
Light is generated when the gas is discharged by induced plasma without exposure to electrodes in the tube, resulting in
EEFLs having a longer life. Furthermore, multiple EEFL tubes can be connected to a single power supplier, enabling low initial installation costs. Therefore, EEFLs have the potential for use as a new alternative artificial light source combining the high light quality of FLs with the low cost of operation of LEDs.
Lettuce has frequently been used as a model plant to study responses to light in plant factories (Dougher and Bugbee, 2001; Park et al., 2013; Son and Oh, 2013). Although many experiments have studied the growth response caused by variations in light intensity or photoperiod separately, there is little information available regarding the combination of these two conditions and the daily light integral [DLI, photosynthetic photon flux density (PPFD) × photoperiod], except for the studies by Park et al. (2012), Zhang et al. (2018), and Yan et al. (2019a, 2019b). Under the same DLI, plant length, leaf dry weight, leaf area, and leaf number of Achimenes were greater under low light intensity (LL) than HL; therefore, the light use efficiency (LUE) was higher in the combination of LL and long photoperiod (Vlahos et al., 1991). Lettuce grown under continuous incandescent light showed increased fresh weight, dry weight, and leaf area relative to those grown under a 16 h photoperiod, resulting in a 10% reduction in electricity cost per unit weight (Ohyama et al., 2005).
Light quantity, determined by the light intensity and duration, also influenced the concentration of phytochemicals and antioxidant activity in lettuce (Park et al., 2012; Kang et al., 2013; Colonna et al., 2016; Craver et al., 2017; Yan et al., 2019a) generating significant interest among consumers due to their health-promoting effects. The correlation between the biosynthesis and accumulation of phytochemicals with the amount of photosynthates produced in plants is well known (Wu et al., 2007). Most of these studies have been conducted using LEDs or conventional FLs in plant factories. Thus, this study was conducted to examine the plant growth and accumulation of phytochemicals of lettuce grown under various combinations of light intensity and photoperiod using EEFLs, and to determine the optimum light conditions in a plant factory.
Materials and Methods
Plant Materials and Growing Conditions
Seeds of ‘Cheongchima’ lettuce (Lactuca sativa) (Nongwoo Bio, Suwon, Korea) were sown on 210-hole sponges and seedlings were grown at 20 ± 3°C; a photosynthetic photon flux density (PPFD) of 170 ± 5 µ mol·m
-2·s
-1; and a 16 h photoperiod with EEFLs (described below) for 14 days. Lettuce seedlings (leaf number: 3, fresh weight: 1 g, dry weight:
0.05 g) were transferred and placed on the culture spaces with three vertical layers at a density of 12 plants per treatment (45 × 75 cm plots). The seedlings were grown for an additional 21 days, harvested, and analyzed. Plant-to-plant distance was 12.5 × 12.5 cm and the location of plants was changed every two days to provide uniform light distribution by plant location. Air temperature, relative humidity, and CO
2concentration were maintained at 20 ± 2°C, 70 ± 10%, and 500 ± 50 µ mol·mol
-1, respectively.
Yamazaki nutrient solution (Yamazaki, 1982) adjusted to pH 5.8 and electrical conductivity (EC) 1.2 mS·cm
-1was
used. The solution was composed of 404 mg·L
-1KNO
3, 236 mg·L
-1Ca(NO
3)
2·4H
2O, 57.5 mg·L
-1NH
4H
2PO
4, and 123
mg·L
-1MgSO
4·7H
2O as the macroelements. The microelement composition was 3 mg·L
-1Fe as Fe-EDTA, 0.5 mg·L
-1H
3BO
3, 0.5 mg·L
-1MnSO
4·4H
2O, 0.05 mg·L
-1ZnSO
4·7H
2O, 0.02 mg·L
-1CuSO
4·5H
2O, and 0.01 mg·L
-1Na
2MoO
4·2H
2O
(Lee et al., 2006). The nutrient solution was supplied by the deep flow technique (DFT) and recirculated from a 50 L
nutrient solution container. EC, pH, supply frequency, supply time, and supply amount were controlled using an automatic water supply system (Gafatec, Hwaseong, Korea).
Light Environment and Spectrum
An EEFL kit (EB-7420, 86 watt, Para-ENT, Gyeongsan, Korea) including 20 EEFL tubes (daylight-colored, 3.4 mm dia., 743 mm long, 2 cm gap between tubes) was used and each kit had a size of 75.5 × 42.0 cm. An aluminum reflector board was placed behind the light tubes to increase the lighting efficiency. Two EEFL kits were installed in each photoperiod treatment plot and assigned to a relatively LL or HL intensity treatment. The distance between the light source and plants was adjusted to 14 and 18 cm for the two treatments, respectively, according to plant growth.
The experiment was conducted using 2 levels of light intensities: 150 ± 7.5 (150P) or 200 ± 10 (200P) µ mol·m
-2·s
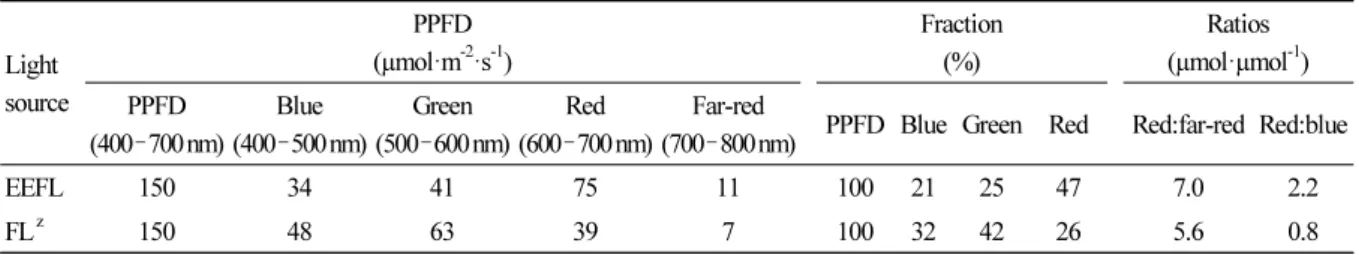
-1PPFD at the plant canopy level. Within each light intensity level, the photoperiod (light period in a 24-h cycle) was set to 12, 16, 20, or 24 h (continuous lighting). The light intensity was measured at 14 cm below the light tube using a photometer (LI-250A, Li-Cor, Lincoln, NE, USA) and the spectra of the source light was measured with a spectrometer (PAR-200, J&C Technology, Gimcheon, Korea) (Fig. 1) . Light parameters of EEFLs used in this study and FLs (YZ18RR26, 18 W each, electrical ballast NEB118/T8-EM, power factor = 0.98; NVC Co., Huizhou, China) used by Li et al. (2014) were provided for comparison of light sources when PPFDs were 150 µ mol·m
-2·s
-1(Table 1) . The DLI of each light treatment is shown in Table 2 .
Fig. 1. Light spectrum and relative intensity of external electrode fluorescent lamps (EEFLs) measured at the top of the lettuce plants (distance from the lamps = 14 cm).
Table 1. Light parameters of external electrode fluorescent lamps (EEFLs) and 8T fluorescent lamps (FLs) when PPFDs were 150 µmol·m
-2·s
-1Light source
PPFD (µmol·m
-2·s
-1)
Fraction (%)
Ratios (µmol·µmol
-1) PPFD
(400 ‑ 700 nm)
Blue (400 ‑ 500 nm)
Green (500 ‑ 600 nm)
Red (600 ‑ 700 nm)
Far-red
(700 ‑ 800 nm) PPFD Blue Green Red Red:far-red Red:blue
EEFL 150 34 41 75 11 100 21 25 47 7.0 2.2
FL
z150 48 63 39 7 100 32 42 26 5.6 0.8
z
FL: 8T fluorescent lamp used in the study of Li et al. (2014).
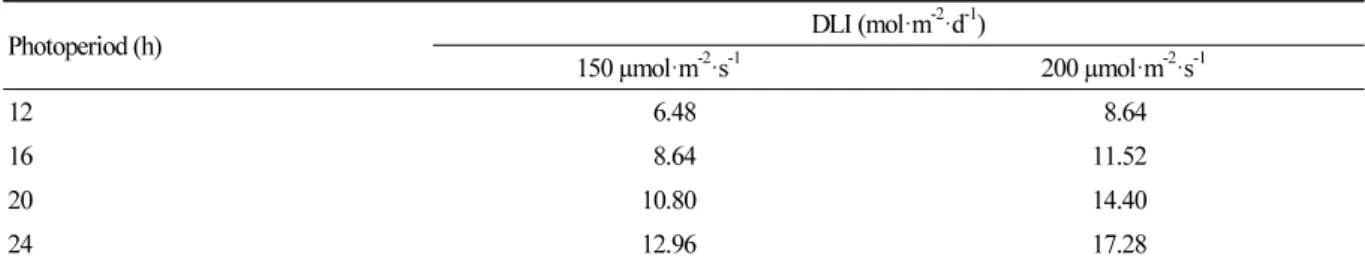
Table 2. Daily light integral (DLI) under 150 or 200 µmol·m
-2·s
-1PPFD and four photoperiods provided by external electrode fluorescent lamps (EEFLs) in a plant factory during the experiment for 3 weeks
Photoperiod (h) DLI (mol·m
-2·d
-1)
150 µmol·m
-2·s
-1200 µmol·m
-2·s
-112 6.48 8.64
16 8.64 11.52
20 10.80 14.40
24 12.96 17.28
Growth Assessment
After 3 weeks of treatment, fresh weights of the shoots and roots of lettuce were measured and dry weights were measured after the fresh samples had been dried at 70°C for 48 h in a drying oven (DLI-107A, Daelim Instruments, Korea). Leaf area was measured from the largest leaf of each plant from three plants using a leaf area meter (WinDIAS 3 Image Analysis System, Delta-T Device, Cambridge, UK), and specific leaf weight (SLW) was calculated as mg dry weight per leaf area. The ratio of leaf length/width was calculated as a leaf shape index after measuring the length and width of leaves used in the leaf area measurement. The shoot/root ratio (S/R ratio) was calculated by dividing the fresh weight of shoots by that of the roots. The chlorophyll content was estimated using a portable chlorophyll meter (SPAD-502Plus, Minolta, Osaka, Japan) and expressed as SPAD values. Light use efficiency [LUE, mg dry weight (DW) per mol] was calculated by dividing the dry weight (mg) by the total integral light amount (mol) that the plant received for 21 days. Daily biomass accumulation rate (mg DW/day) was calculated to compare the daily increase (mg) in dry weight of ‘Cheongchima’ lettuce shoots among light treatments in the plant factory.
Analysis of Total Phenolic Content
The total phenolic content was measured after 21 days of treatment using the Folin ‑ Ciocalteu method (Ainsworth and Gillespie, 2007). Fresh leaf tissues (~ 5.0 g) were homogenized with 40 mL 80% methanol and passed through a filter paper. Next, 100 µ L of extract was mixed with 9 mL water and 0.5 mL Folin-Ciocalteu solution (Sigma-Aldrich, St.
Louis, MO, USA) in a 15 mL tube. After 30 min, 1.5 mL 20% sodium carbonate solution was added. Methanol (80%) was used instead of the extract in the blank. The absorbance at 760 nm was measured after 2 h using a spectrophotometer. A standard curve was generated between 0 and 100 mg·mL
-1gallic acid (Sigma-Aldrich) and the results were expressed as
g gallic acid equivalent (GAE) per g fresh weight.
Measurement of Antioxidant Levels
The antioxidant level was measured by the 2,2-diphenyl-1-picrylhydrazyl (DPPH) method (Brand-Williams et al., 1995). The same extract used in the total phenolic content measurement was used in this test. A total of 40 µ L of extract was added to 4 mL DPPH solution (2 mg·mL
-1in methanol, Sigma-Aldrich) in a 15 mL tube. For the blank, 40 µ L 80%
methanol was added instead of the extract. The absorbance at 517 nm was measured after 1 h at 24°C. A standard curve
was generated using 0 to 31.25 mg·mL
-1vitamin C and the results were expressed as µ g vitamin C equivalent (VCE) per
gram fresh weight.
Table 3. Significance of light intensity (LI), photoperiod (PP), and their interaction (LI × PP) on the characteristics of plant growth, morphology, antioxidant capacity, and light use efficiency in ‘Cheongchima’ lettuce grown hydroponically for 3 weeks in a plant factory system
Source df
zShoot fresh
wt Root fresh wt
S/R ratio
Shoot dry wt
Leaf length
Leaf width
Leaf number
Leaf shape index
Leaf area
Specific leaf weight
SPAD value
Total phenolic
content
Anti-oxi dant capacity
Light use efficiency
LI 1 ** * * ** ** ** * * * * * *** *** *
PP 3 * * * * * * * ** ** ** * *** ** *
LI × PP 7 * * ** * NS * ** NS * * ** ** ** **
z
Degrees of freedom.
NS, *, **, ***