• 검색 결과가 없습니다.

Physicochemical Properties of Starches from Several Agricultural Sources: Application to a Starch-based Adhesive

N/A
N/A
Protected

Academic year: 2021

Share "Physicochemical Properties of Starches from Several Agricultural Sources: Application to a Starch-based Adhesive"

Copied!
8
0
0

로드 중.... (전체 텍스트 보기)

전체 글

(1)

Physicochemical Properties of Starches from Several Agricultural Sources: Application to a Starch-based Adhesive

Lili Melani and Hyoung-Jin Kim

Received March 14, 2019; Received in revised form April 12, 2019; Accepted April 22, 2019

ABSTRACT

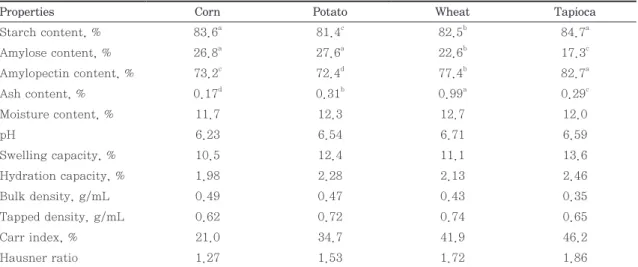
This study evaluated the physicochemical properties of starches from various agricultural sources (corn, potato, wheat, and tapioca). The chemical properties, i.e., the starch, ash, amylose, and amylopectin contents, were found to be significantly different between the starches. Further, the pasting property, i.e., swelling power (which was obtained at five different temperatures), was strongly affected by the amylose and amylopectin contents.

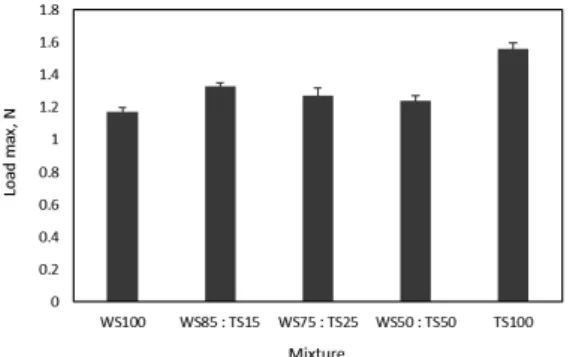
The highest amylopectin content (82.7%) was found in tapioca, which led to the highest swelling power (28.1 g/g); this was followed by wheat, potato, and then corn starch. To evaluate the viscosity profile, a paste was made by cooking wheat (WS) and tapioca (TS) starches at specific ratios, i.e., WS100:TS0, WS85:TS15, WS75:TS25, WS50:TS50, and WS0:TS100. The highest viscosity level was observed at TS100 and the addition of TS to a mixture was found to increase the level of viscosity. Furthermore, TS100 showed good mechanical properties compared with the other mixtures.

Keywords: Starch, physicochemical properties, pasting properties, peel resistance

• Kookmin University Industry-Academic Cooperation Foundation, Kookmin University, Seoul, 136-702, Republic of Korea

† Corresponding Author: E-mail: [email protected]

Printed in Korea http://dx.doi.org/10.7584/JKTAPPI.2019.04.51.2.100

1. Introduction

Starch is a polysaccharide consisting of glucose units and biodegradable polymer produced by plants. Next, to cellulose, starch is the most abun- dant natural polysaccharide. Starch is made up of glucose units and is deposited in the seeds, tubers, roots, and stem pith of plants.

1)

The starches from various agricultural products, such as corn, potato,

wheat, and cassava, have been considered in terms of their physicochemical properties. Starch has unique functionalities according to its source.

2)

Therefore, identification of starch properties is re- quired to obtain the desired functionality in rela- tion to end-use.

Various industries use starch as the main product

in their applications. The paper industries in the

United States and Europe are the largest consumers

(2)

of dried starch. Such industries use starch in the wet-end process when paper sheet is formed, for internal sizing and coating.

3)

Starch is also widely used in the corrugated board and packaging in- dustries as an adhesive. In 1930, the Stein-Hall process was introduced as the first primary com- mercial process for producing starch adhesives.

4)

The process consists to two phases: in the first phase, the starch is cooked to form a gelatinized starch; in the second phase, the gelatinized starch is mixed with borax to form the finished adhesive.

Starch has a high hydrogen-bonding capability owing to the large of amount of glucosidic and hy- droxyl groups.

5)

Consequently, the water resistance of native starch adhesives is poor. Therefore, to achieve a particular application, native starch may be subjected to subsequent chemical and physical modifications.

Many methods have been developed to character- ize starch properties, e.g., composition, swelling, solubility, morphology, gelatinization, retrograda- tion, and rheology. Amylose and amylopectin com- positions vary across starches from different sources; this affects their crystallinity and paste behavior. Morphological characteristics such as variations in the size and shape of starch granules can be observed by scanning electron microscope (SEM).

6)

The various granule sizes and shapes also differ significantly across sources. Moreover, different compositions exhibit different enthalpies of gelatinization. The gelatinization and swelling properties are controlled by the ratio of amylose and amylopectin, the molecular structure of amy- lopectin, and the ratio of crystalline to amorphous.

Temperature also impacts the viscosity of starch.

7)

Moisture sorption capacity is a measure of the moisture sensitivity material. It relates to swelling and hydration capacity. Salleh et al. (2015) re- ported that the higher moisture sorption gave the higher swelling and hydration capacity. These properties are suitable for starch to be used as a

binder. Hausner ratio and Carr index are consid- ered as indirect measurements of powder flowabil- ity. Hausner ratio and Carr index values below 1.55 and 50% indicated good flow characteristic.

8)

This study was designed to investigate the com- position and rheological characteristics of starches from several agricultural sources, i.e., corn, po- tato, wheat, and tapioca. Further, the studied properties were used to develop a formulation composition having sufficient strength for starch- based adhesive.

2. Materials and Methods

2.1 Raw materials

Commercially available native starches, i.e., corn, potato, wheat, and tapioca, were purchased from a local market in Seoul, Korea. These starches were sifted using an automatic vibration sieve shaker to remove impurities. The desired amount of starch was obtained and stored for further experiments.

Chemical reagents of analytical grade were used for determining the starch, amylose, and amylo- pectin contents.

2.2 Physicochemical properties of starch

The physicochemical properties, i.e., starch con- tent, amylose and amylopectin contents, pH, moisture content, moisture sorption capacity, swelling capacity, hydration capacity, bulk and tapped densities, Carr index, Hausner ratio, and ash content, of the starches were determined for each sample.

8)

Starch content was determined according to Niel-

sen.

9)

About 2 g of oven-dried starch was dissolved

in 2 mL distilled water and 2.7 mL of 72% perchlo-

ric acid. The solution was stirred for 10 minutes

and adjusted to 50 mL total solution by adding

distilled water. The supernatant was carefully

transferred to a 100-mL beaker followed by the

(3)

addition of 6 mL distilled water, a drop of phenol- phthalein, and a few drops of 6 N sodium hydrox- ide (NaOH). Titration was performed by adding acetic acid until the pink color was lost. Then, 0.5 mL of 10% potassium iodide (KI) and 5 mL of 0.01 N potassium iodate (KIO

3

) were added to the solu- tion to obtain a bluish color. This was then ana- lyzed using a UV-vis spectrophotometer at a wavelength of 650 nm. Linear regression was used to determine the starch content.

Amylose and amylopectin contents were deter- mined according to Riley et al.

10)

About 5 g of starch was placed in an extraction thimble and ex- tracted using n-hexane to remove the lipid con- tent. After the extraction process was complete, the thimble and lipid-free starch were air-dried for 12 h before the sample was removed from the thimble and dried at 30℃ for 24 h. Approximately 20 mg of lipid-free starch was dissolved in 8 mL of 90% dimethyl sulfoxide, shaken for 2 min, and then heated at 85℃ for 15 min. The solution was then diluted by adding 1 mL of the solution into 40 mL of distilled water and 5 mL of iodine. The solution was shaken and left for 15 min. The absorbance was analyzed using a UV-vis spectro- photometer at a wavelength of 600 nm. Linear re- gression was used to determine the amylose and amylopectin contents of the starches.

Ash content was measured according to the National Food Standard Safety Standard.

11)

The moisture content was determined by drying about 5 g of sample at 60℃ until a constant weight was achieved. pH was determined by diluting 1 g of starch into 100 mL of distilled water, followed by measurement using an electronic pH meter.

In determining moisture sorption capacity, about 2 g of air-dried starch (W) was weighed into a petri dish and placed in a desiccator along with 800 mL of distilled water divided into 250-mL glass beakers. The samples were exposed for five days, after which the amount of absorbed water

(W

a

) was calculated. Then, the moisture sorption capacity was determined as

12)

Moisture sorption capacity W W

a

(%) = × 100 [1]

In determining swelling capacity, about 0.1 g of air-dried starch (W) was dispersed in 100 mL of distilled water and left for 1 hr. The swollen poly- mer was filtered using Whatman filter paper No. 4.

The filtrate was then weighed (W

f

) and the swelling capacity determined as

13)

Swelling capacity W W

=

f

× 100 [2]

About 1 g of starch (W) was dispersed in 10 mL of distilled water and shaken for 2 hr. The mixture was centrifuged at ~2,500 g for 8 min. The result- ing pellet was weighed (W

p

) and the hydration ca- pacity was calculated as

13)

Hydration capacity W W

=

p

[3]

About 50 g of starch (W) was poured into a 100-mL graduated cylinder. The volume occupied by the sample was determined (V). The sample was tapped until no further change in volume was observed (V

t

). The bulk and tapped densities were calculated as

8)

Bulk density Bd W V Tapped density Td W

V

t

( ) ( )

=

= Bulk density Bd W [4]

V Tapped density Td W

V

t

( ) ( )

=

= [5]

Using the above-obtained values, the compress- ibility index and Hausner ratio were calculated as

14)

carr index Td Bd Td Hausner ratio Td

Bd

(%) = − ×

=

100 [6]

carr index Td Bd Td Hausner ratio Td

Bd

(%) = − ×

=

100

[7]

(4)

2.3 Pasting properties of starch

Swelling power was calculated for each sample. A 2% (w/v) starch dispersion was heated in a shaking water bath at five different temperatures, i.e. 55, 65, 75, 85, and 95℃, for 30 min. The samples were cooled and then centrifuged at ~2,000 rpm for 30 min. The supernatant was removed and the gel was dried at 103℃ until constant weight (W

g

) was achieved. The swelling power was calculated as

8)

Swelling power W W

=

g

× 100 [8]

A starch paste with a 20% solid content was cooked at a temperature of 80℃ for 30 minutes.

Then, the paste was held constant at 65℃. The viscosity was measured using a Brookfield viscom- eter model HBDV-I+ using spindle number 7, with the measurement performed within 60 seconds.

2.4 Peel resistance of starch paste

A strength test of the adhesive bond was carried out according to method ASTM D1876-01 as shown in Fig. 1.

15)

This procedure is intended to determine the relative peel resistance of adhesive bonds between flexible adherends (i.e., wallpaper) using a T-type specimen in a tensile tester machine (Criterion

®

Model 41, MTS, USA). This was ex- pressed as the peeling load (N).

2.5 Statistical analysis

All numerical results are presented as the average value of at least three independent replicate ex- periments. The mean differences were determined by Tukey’s HSD test (P<0.05) using JMP software (SAS Institute, Cary, NC, USA).

3. Results and Discussion

3.1 Physicochemical properties of starch

The physicochemical properties of the starches from several agricultural sources are shown in Table 1. The starch contents for corn, potato, wheat, and tapioca were in the range 81.3-84.6%.

The amylose contents of the starches varied with agricultural source; for the corn, potato, wheat, and tapioca starches, the amylose contents were 26.8, 27.6, 22.6, and 17.3%, respectively. The highest amylopectin content was found in the tap- ioca starch (82.7%), followed by the wheat, corn, and potato starches (77.4, 73.2, and 72.4%, re- spectively). In a previous study, Singh et al. (2003) reported that the amylose content of starch gran- ules varies with botanical source and is affected by climatic conditions and soil type during growth.

5)

Further, the amylose content of corn starch varied from 14 to 27%, that of potato starch from 20 to 30%, that of wheat starch from 18 to 30%, and that of tapioca starch from 17 to 20%. The proportions of amylose and amylopectin contribute to the functional properties of a starch.

The purity of a starch is indicated by its ash con- tent. It was found that corn starch had the lowest amount of ash (0.17%), followed by the tapioca, potato, and wheat starches (0.29, 0.31, and 0.99%, respectively). Starch manufacturing process and chemical that used takes place in this variety of ash content. The moisture contents of the starches were similar across all the sources (11.6-12.6%).

For wheat starch, a moisture content of around

Fig. 1. Test panel and test specimen.

(5)

13% has been reported as acceptable for commer- cial purposes.

1)

Moisture content is reported to in- fluence moisture sorption capacity. To determine the acidity of the starches, the pH of each sample was measured, indicating similar values for the various starches (6.23-6.71).

Tapioca showed the highest swelling capacity (13.6%), followed by potato, wheat, and corn (12.4, 11.1, and 10.5%, respectively). The same pattern was found for hydration capacity. The swelling and hydration capacities relate to the proteinaceous materials found in the starch. It has been reported that swelling is limited owing to the phospholipids present in starch exhibiting a tendency to form complexes with amylose and long branched chains of amylopectin.

16)

The bulk and tapped densities were determined to

calculate the Carr index and Hausner ratio. The bulk densities of the various starches were in the range 0.35-0.49 g/mL, whereas the tapped densi- ties were 0.62-0.74 g/mL. The Carr index was found to be highest for tapioca (46.15%), followed by wheat, potato, and corn starch (41.9, 34.7, and 21.0%, respectively). These properties correlate to the flowability of the starch granules and reflect the viscosity of the starch paste. Higher Carr in- dexes and Hausner ratios indicate cohesive behav- ior and less free flow in a liquid medium owing to the higher viscosity of the paste.

8)

3.2 Pasting properties of starch

Table 2 shows the swelling properties of the var- ious starches at different temperatures. Tapioca starch showed the highest value, followed by

Table 2. Swelling power of the studied starches

Samples Temperature, °C

55 65 75 85 95

Corn, g/g 7.13 9.24 10.82 12.69 21.88

Potato, g/g 7.45 9.89 11.07 13.42 23.56

Wheat, g/g 7.48 9.49 12.11 13.93 23.64

Tapioca, g/g 9.22 11.53 13.47 17.66 28.14

Table 1. Basic properties of the studied starches

Properties Corn Potato Wheat Tapioca

Starch content, % 83.6

a

81.4

c

82.5

b

84.7

a

Amylose content, % 26.8

a

27.6

a

22.6

b

17.3

c

Amylopectin content, % 73.2

c

72.4

d

77.4

b

82.7

a

Ash content, % 0.17

d

0.31

b

0.99

a

0.29

c

Moisture content, % 11.7 12.3 12.7 12.0

pH 6.23 6.54 6.71 6.59

Swelling capacity, % 10.5 12.4 11.1 13.6

Hydration capacity, % 1.98 2.28 2.13 2.46

Bulk density, g/mL 0.49 0.47 0.43 0.35

Tapped density, g/mL 0.62 0.72 0.74 0.65

Carr index, % 21.0 34.7 41.9 46.2

Hausner ratio 1.27 1.53 1.72 1.86

* means within a row followed by different letters (a, b, c, d) differ significantly at P≤0.05

(6)

wheat, potato, and then corn. The results show a correlation with the swelling and hydration capac- ities. It is essential to understand swelling power as it provides information on how the characteris- tics of a starch affect its pasting properties. Ini- tially, the starch granules were insoluble in water at room temperature. When a starch water sus- pension was heated beyond the pasting tempera- ture, the granules absorb water, the crystalline structure is disrupted, and water molecules become linked by hydrogen bonding to the exposed hy- droxyl group of amylose and amylopectin.

17)

As such, the granules swell to many times their stan- dard size. This results in a viscose and colloidal mass known as starch paste.

The starch paste was prepared in a suspension with a concentration of 20%. Based on their measured basic properties, wheat starch (WS) and tapioca starch (TS) were selected for preparation into pastes. The starch pastes were blended under specific ratios i.e., WS100:TS0, WS85:TS15, WS75:TS25, WS50:TS50, and WS0:TS100. The resulting viscosities are shown in Fig. 2.

Starch exhibits a unique viscosity profile with changes in temperature, concentration, and shear rate; consequently, a rotational viscometer or dy- namic rheometer should be used to determine the viscoelastic properties of starch. As shown in Fig. 2, of all mixtures, TS showed the highest viscosity level, whereas WS showed the lowest level of vis-

cosity. By adding increasing amounts of TS to WS, the viscosity level of the starch paste increased.

This occurred because the amylopectin content of TS was higher than that of WS. The phosphate monoester bound covalently to the amylopectin fraction of starch increased paste clarity and vis- cosity.

5)

Starch also can exhibit low viscosity after reaching a maximum level. The profile is influ- enced by the initial concentration of starch paste.

3.3 Peel resistance of starch paste

Peel resistance was assessed to demonstrate the adhesive-related properties of the starches. The paste was applied to pieces of wallpaper that were then stuck to each other and left until the paste had dried. The test specimens were cut into strips of 241 mm (length) and 25 mm (width), as shown in Fig. 3. The maximum load was obtained at a pull position of 76 mm.

Fig. 2. Viscosity profile. Fig. 3. Test specimens.

(7)

From Fig. 4, TS exhibited good peel resistance compared with the other mixtures. It also appears that adding TS to the mixture resulted in strong bonding, as compared with WS only. It occurred when a paste is placed at room temperature, the reassociation of amylose may cause the retrogra- dation, but amylopectin remains stable.

18)

Since TS contained the highest level of amylopectin, the strong bonding between these molecules may have resulted in the high peel resistance.

4. Conclusions

The basic properties of starches from various ag- ricultural sources differ significantly. These dif- ferences influence the pasting properties and peel resistance of starches paste. By choosing the right temperature, concentration, and type of starch, a desired functionality for a particular application might be achieved. Among the starches studied here, tapioca contained the highest amount of am- ylopectin, which affected the properties of swell- ing, hydration capacity, and viscosity. Such a starch could have application as a wallpaper paste since the peel resistance was significantly higher than that of the other starches studied.

Literature Cited

1. Dias, F. F., Starch: Perspectives and opportu- nities, Journal of Scientific and Industrial Re- search (India) 58:403-413 (1999).

2. Blazek, J., Salman, H., and Rubio, A. L., Structural characterization of wheat starch granules differing in amylose content and functional characteristics, Carbohydrate Poly- mers 75:705-711 (2009).

3. Yang, L., Liu, J., Du, C., and Qiang, Y., Preparation and properties of cornstarch ad- hesives, Advance Journal of Food Science and Technology 5:1068-1072 (2013).

4. Schroeder, T., Starch and Dextrin Based Ad- hesives (2004). http://www.specialchem4ad- hesives.com/resources/articles/article.aspx-

?id=757

5. Singh, N., Singh, J., Kaur, L., Sodhi, N. S., and Gill, B. S., Morphological, thermal and rheological properties of starches from differ- ent botanical sources, Food Chemistry 81:219- 231 (2003).

6. Mohammadi Nafchi, A., Robal, M., Cheng, L.

H., Tajul, A. Y., and Karim, A. A., Physico- chemical, thermal, and rheological properties of acid-hydrolyzed sago (Metroxylon sagu) starch, LWT - Journal of Food Science and Technology 46:135-141 (2012).

7. Li, J. Y. and Yeh, A. I., Relationships between thermal, rheological characteristics and swell- ing power for various starches, Journal of Food Engineering 50:141-148 (2001).

8. Salleh, K. M., Hashim R., and Sulaiman O., Evaluation of properties of starch-based adhesives and particleboard manufactured from them, Journal of Adhesion Science and Technology 29:319-336 (2015).

9. Nielsen, E. V., A method for determination of the degree of gelatinization of starch, Potato Research 12:116-121 (1969).

Fig. 4. Peel resistance of the studied starch

pastes.

(8)

10. Riley C. K., Wheatley A. O., and Asemota H.

N., Isolation and characterization of starches from eight Dioscerea alata cultivars grown in Jamaica. Afr. J. Biotechnol 5:1528-1536 (2006).

11. Ministry of Health of the People’s Republic of China, Determination of ash in foods, National Food Safety Standard (2010).

12. Ohwoavworhua, F. O. and Adelakun, T. A., Some physical characteristics of microcrystal- line cellulose obtained from raw cotton of Co- chlospermum planchonii, Tropical Journal of Pharmaceutical Research 4:501-507 (2011).

13. Abdallah, D. B., Charoo, N. A., and Elgorashi, A. S., Comparative binding and disintegrating property of Echinochloa colona starch (difra starch) against maize, sorghum, and cassava starch, Pharmaceutical Biology 52:935-943 (2014).

14. Achor, M., Oyeniyi, Y. J., and Yahaya, A., Extraction and characterization of microcrys- talline cellulose obtained from the back of the fruit of Lageriana siceraria (water gourd),

Journal of Applied Pharmaceutical Science 4:57-60 (2014).

15. ASTM (American Society for Testing and Ma- terials), Standard Test Method for Peel Resis- tance of Adhesives (T-Peel Test) 1, 01:1-3 (2008).

16. Fonseca-Florido, H. A., Hern ández, A. J., Rodr íguez, H. A., Castro-Rosas, J., Acevedo- Sandoval, O. A., Hern ández, C. H., and Al- dapa, G. C., Thermal, rheological, and me- chanical properties of normal corn and potato starch blends, International Journal of Food Properties 20:611-622 (2017).

17. Zhang, X., Tong, Q., Zhu, W., and Ren, F., Pasting, rheological properties and gelatiniza- tion kinetics of tapioca starch with sucrose or glucose, Journal of Food Engineering 114:255- 261 (2013).

18. Karim, A. A., Nadiha, M. Z., Chen, F. K.,

Phuah, Y. P., Chui, Y. M., and Fazilah, A.,

Pasting and retrogradation properties of alka-

li-treated sago (Metroxylon sagu) starch, Food

Hydrocolloids 22:1044-1053 (2008).

수치

Table 2 shows the swelling properties of the var- var-ious starches at different temperatures
Fig. 2. Viscosity profile. Fig. 3. Test specimens.
Fig. 4.  Peel  resistance  of  the  studied  starch  pastes.

참조

관련 문서