http://www.culinary.re.kr
INTRODUCTION
Significant changing distributions of body composition with age, like a progressive loss of muscle mass and an increase of fat mass were occurred (Baumgartner et al., 1998). Many previous studies supported that age related body composition change (SO; sarcopenic obesity, SNO; sarcopenic nonobesity, NSO; non- sarcopenic obesity; NSNO; nonsarcopenic nonobesity) resulted in chronic disease (Li & Heber, 2012), even though, so far there is a lack of understanding of the healthy body composition criteria and it didn’t also well known to define and to prevent. Among the variety causes, multiple influences of nutrient imbalance is associated with, ultimately, the age-related chronic diseases caused by body composition change and constantly increasing chronic inflammation (Chung, Kim, Kim, Choi, & Yu, 2002). Acc- ording to increased chronic inflammation, cytokines from adi- pose tissue induced muscle loss and muscle strength weakness, simultaneously, lead to increased fat.
For that reason, recently nutritional research has considered to
reduce body composition changes through inhibiting inflamma- tion-related factors. There are many dietary factors contributing to chronic disease among adults, specially fruits and vegetables as an anti-inflammatory nutrients rich in vitamin A, B, C, E and K, and affluent minerals, phytochemical, and other food groups also has various nutrients factors. WHO (World Health Organization) emphasis diet rich in fresh and varied fruit and vegetable intake as well as a minimum daily food consumption goal as part of a healthy diet in many countries in order to protect against chronic diseases to their general population. In Korea, there is guidelines that the Dietary Reference Intakes for Koreans (KDRIs) recomm- end 3 servings of grains, 5 servings of vegetables, 4 servings of meats and beans, 2 servings of dairy and milk products, 2 servings of fruits and 4 servings of fat and sweets per day the to promote optimum health in Koreans adults (Paik, 2008).
To know the consumption pattern and preference of food along with appropriate quantity are so important. Recently MS (Metabolic syndrome) which is defined as having abnormality with three or more of the following five criteria: 1) waist cir-
A Study of Korean Elderly on the Preference of Food according to Body Composition
Chorong Oh1, Min-Sun Kim2 and Jae-Kyung No3,¶
1Dept. of Nutrition and Health Care, Kyungsung University, Busan 608-736, Korea
2Dept. of Pharmacy, College of Pharmacy, Sunchon National University, Sunchon 540-742, Korea
3Dept. of Nutrition and Health Care. Kyungsung University, Busan 608-736, Korea
ABSTRACT: Present study classified body composition to 4 groups categorized as sarcopenic obesity (SO), sarcopenic nonobesity (SNO), nonsarcopenic obesity (NSO), and nonsarcopenic nonobesity (NSNO) and then was performed to investigate that body composition associated with food consumption frequency as well as MS in individual aged 60 years or older. Body mass index and an appendicular skeletal muscle mass (ASM) divided by weight (Wt) of < 1 standard deviation (SD) below the sex-specific mean for young adults were used to define obesity and sarcopenia. A total of 1,433 subjects (658 male and 775 females) 60 years or older from the fifth Korea National Health and Nutritional Examination Survey 2010 participated in this study. One of the interesting findings was that the association of the prevalence of MS with body composition was higher in women than man. Other finding was that there were different food frequency and food preference according to 4 different groups between men and women. In addition, men are much more influenced by food than women. In conclusion, body composition changes were more related with food frequency in elderly men (60 years or older) than women. Women had a higher prevalence of MS than men, suggesting early nutritional intervention in elderly women may help them prevent body composition changes.
Keywords: Elderly, Body Composition, Obesity, Nutrient, Human
Abbreviations: KNHANES; Korean National Health and Nutrition Examinations Survey, SO; Sarcopenic Obesity, SNO; sarcopenic nonobesity, NSO; nonsarcopenic obesity, NSNO; nonsarcopenic nonobesity, BMI; Body Mass Index
§ Corresponding Author: Jae-Kyung No, Ph.D., Dept. of Nutrition and Health Care, Kyungsung University, 309, Suyeong-ro, Nam-gu, Busan 608-736, Korea, Tel. +82- 51-663-4651, Fax. +82-611-2447, E-mail: [email protected]
Received: 21 August, 2014, Revised: 14 October, 2014, Accepted: 20 October, 2014.
cumference, 2) hypertriglyceridemia, 3) HDL cholesterol, 4) blood pressure, 5) fasting plasma glucose is emerging as major public health problems in Korea and dietary intervention on MS pro- vides greatest opportunity to intervene in earlier stages before the onset of chronic diseases (Ford, 2005). Dietary patterns, such as Mediterranean diet and Dietary Approaches to Stop Hyper- tension (DASH) have showed the reduction effect on the risk of MS (Kastorini et al., 2011). Because those dietary patterns have high fruits and vegetables intake among food compositions.
Although the relations of diet and MS were investigated in many studies, study on the relation with body composition and food frequency by gender was few. A beneficial effect of various food groups on MS may be expected by maintains of body compo- sition in the elderly. But the mechanisms of nutritional compo- nents in all food groups are quite complex, not well understood yet, because it works acting in concert. In the elderly, food preference changes due to reduced appetite, altered taste and smell sensation, slower gastric function and altered hormonal responses so the study of food consumption frequency are needed. Furthermore the study of food consumption frequency by FFQ will be a useful data for creating various dishes with ade- quate nutrition and educational data for the elderly as well.
Accordingly, this study examined MS and the role of nutrients in preserving muscle mass and decreasing visceral fat by food frequency questionnaire (FFQ) according to sarcopenic obesity (SO), sarcopenic nonobesity (SNO), nonsarcopenic obesity (NSO), and nonsarcopenic nonobesity (NSNO) by gender among a representative elderly population, aged 60 years or older, who participated in the survey by the Korea National Health and Nu- trition Examination Survey V (NHANES V). Finally, this study will provide interventional data for successful aging of the aging population.
METHODS Study Sample
This study was based on data obtained from the KNHANES 2010, a nationally representative survey conducted by the Ko- rean Ministry of Health and Welfare. The survey’s target popu- lation included non-institutionalized Korean civilians. Sampling units consisted of households selected through a stratified, multistage, probability-sampling design based on geographic area, sex, and age group using household registries (Kim, Y. & Lee, 2012). KNHANES 2010 consisted of four components: a health interview survey, a health behaviors survey, a health examination survey, and a nutrition survey. These surveys were completed by 8,473 (77.5% of the total target population of 10,938) participants in 2010 (Y. Kim & Lee, 2012). A total of 1,433 individuals (658 men, 775 women) 60 years or older who participated in the health examination and nutrition surveys were included in this study.
We excluded those who had not performed DXA, did not have data on oral daily nutrition intake, and had not undergone blood tests. This study was performed as next study of “the study of the relationship of sarcopenic obesity and nutritional risk factor in Korean” (Oh, C, 2014) so most of methods were same.
Definition of Appendicular Skeletal Muscle Mass and Obesity for Group Classification
Appendicular skeletal muscle mass (ASM, kg) was defined as the sum of lean soft tissue mass in the arms and legs following the method of Heymsfield et al., (Heymsfield et al., 1990). We calculated ASM as a percentage of body weight (Wt), modifying methods published by Janssen et al. (Janssen, Heymsfield, & Ross, 2002) and Lim et al. (Lim et al., 2010), respectively. Sarcopenia was defined as an ASM divided by Wt (ASM/Wt) that was less than 1 standard deviation (SD) below the mean of a reference sample of 1,746 healthy adults age 20~39 years (748 men, 998 women) from the fifth KNHANES database. The cutoff value (32.4
± 2.8 for men, 25.7 ± 2.3 for women) for sarcopenia was 44% for men and 52% for women. Obesity classification was determined according to the BMI criteria established by the Obesity Task Force (IOTF), World Health Organization (WHO) and the Korean Society for the Study of Obesity (KSSO) (Oh, 2011). Subjects were further classified into four groups based on the combination of sarcopenia and obesity definitions above: sarcopenic obese (SO), sarcopenic nonobese (SNO), nonsarcopenic obese (NSO), and nonsarcopenic nonobese (NSNO).
Definition of Metabolic Syndrome
We employed the original criteria for metabolic syndrome proposed by the National Cholesterol Education Program (NCEP) Adult Treatment Panel III. However, we used ethnicity-specific WC values, as proposed by the International Diabetes Federation (IDF) (Song & Joung, 2012). Obesity was assessed based on the BMI cut-offs proposed by the World Health Organization (WHO).
Metabolic syndrome were defined as having three or more of the following five criteria: Abdominal obesity was defined as waist circumference >90 cm in males and >80 cm in females; hyper- triglyceridemia as triglycerides ≥150 mg/dL; low HDL chole- sterol as <40 mg/dL in males and <50 mg/dL in females; hy- pertension as blood pressure ≥130/85 mmHg; and hyperglyce- mia as fasting plasma glucose ≥110 mg/dL (Song & Joung, 2012).
Dietary Information
Dietary information was obtained from food frequency que- stionnaires (FFQ) in KNHANES data sets. Depending on the food group classification of the National Health and Nutrition Exa- mination Survey Guide, food groups divided to 5 groups such as cereals, legumes/potatoes, meat/eggs, fish/shellfishes, fruits, vegetables, seaweeds. The frequency of food intake were scored to based that ‘once a week’ is one point and ‘almost not eat’ was considered as zero point.
Statistical Analyses
All statistical analyses were conducted using SPSS version 20.0 (SPSS, IBM, NY, USA). The level of significance was set at p<0.1 The generalized linear model was used to compare anthropo- metric measurements, biochemical tests, and nutrient intakes among the four groups. Data are presented as means ± SE. All models were adjusted for age, sex.
RESULTS
Body composition changes can be a marker of aging and related with chronic diseases. In aging process, there are typically
Fig. 1. Comparisons of prevalence of MS among SO, SNO, NSO, and NSNO groups (male N=685, female N=775). MS; metabolic syn- drome, SO; sarcopenic obesity, SNO; sarcopenic nonobesity, NSO;
nonsarcopenic obesity, NSNO; nonsarcopenic nonobesity. All mo- dels were adjusted for age, sex.
changes with significant body composition like a muscle mass loss and an increased fat mass. Fig. 1 showed the prevalence of MS according to 4 different body composition groups by gender.
The prevalence of MS was higher in the obese group than non- obese group. There are significantly different between body composition and MS and especially in sarcopenic obesity group, it trend to high in both gender. The MS prevalence in women was higher than man.
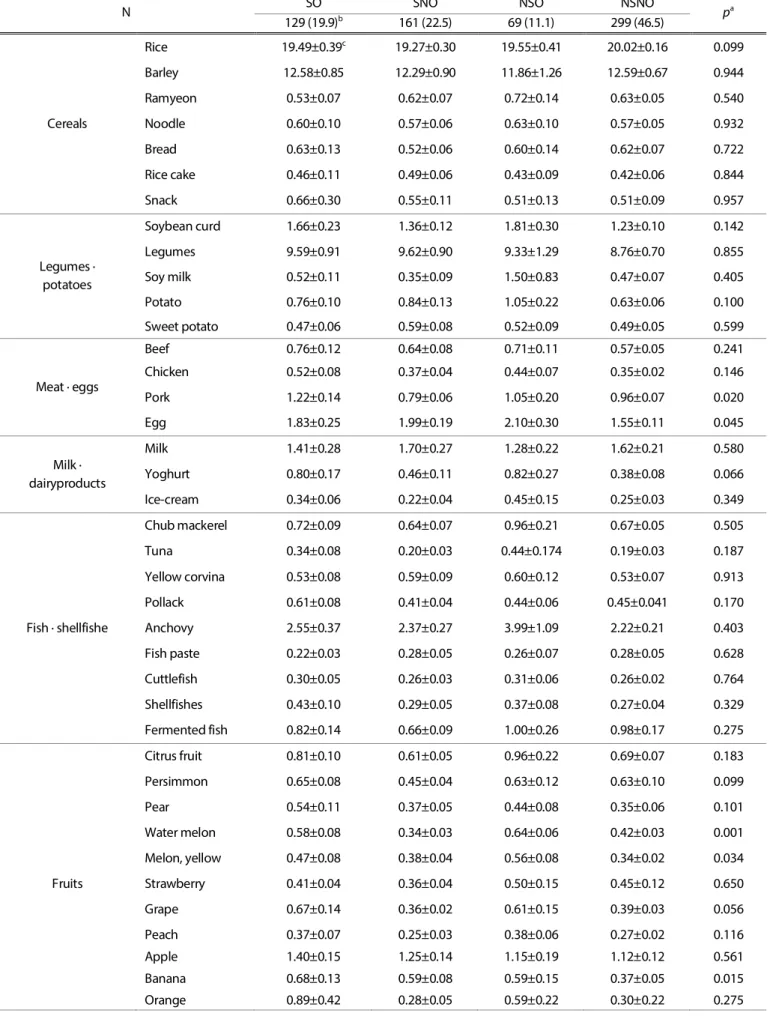
Table 1-a and Table 1-b showed the food frequency and food preference according to 4 different groups. There were significantly different in food groups. For men, there were significant different with frequency of food group such as rice (p=0.099) in cereals group, pork (p=0.020), egg(p=0.045) in meat/eggs group, yogurt(p=0.066) in milk/diary-products, persimmon (p=0.099), water melon (p=0.001), melon (p=0.034), grape (p=0.056), banana (p=0.015) in fruit group, radish leave (p=0.045), tomato (p=0.080), mushroom (p=0.055) in vegetables
group. For women, there were significant different with fre- quency of food group such as soybean curd (p=0.000) in legu- mes/potatoes group, pollack (p=0.029) in fish group, melon (p=
0.001), strawberry (p=0.000), orange (p=0.007) in fruit group, ca- rrot (p=0.047) in vegetables group. This indicated that food con- sumption frequency by food groups among 4 different body com- positions was more related with men than women in the elderly.
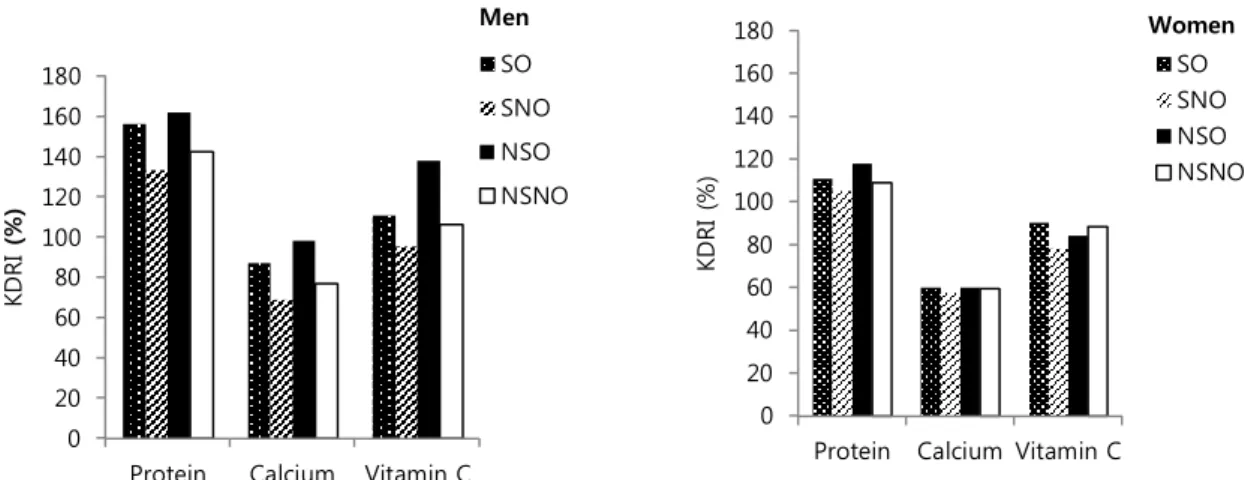
It is important to recognize malnutrition problem early among the elderly so we investigated nutrient intake status through comparing with the daily intake of protein, calcium, and vitamin C and RDA and showed in Fig. 2. For men, there were significant differences in protein, calcium, except vitamin C, on the other hand, for women, there were no significantly different in all.
DISCUSSION
Body composition changes that result in lots of chronic dis- eases are noticeable in the elderly and could be a warning marker. It is related with many other internal and external in- fluences such as malnutrition, the reduced function of ab- sorption, and metabolism of food induce inflammation and insulin resistance (Candow et al., 2012). In the elderly, especially, food preference changes due to reduced appetite, altered taste and smell sensation, slower gastric functions and altered dra- matically hormonal responses, so the study of food consumption frequency are necessary and meaningful. Therefore, present study classified body composition to 4 groups and then was performed to investigate that body composition associated with food consumption frequency as well as MS in individual aged 60 years or older. One of the interesting findings in this study was that the association of the prevalence of MS with body com- position was higher in women than man. Previous our research by Oh (Oh C, 2014) showed that SO, in particular, was closely associated with insulin resistance and inflammation-related fac- tors in both men and women, however, vitamin D and HDL were in abnormal ranges, respectively, in all of the women groups.
Other research supported that there are gender differences in 0
10 20 30 40 50 60 70 80
Prevalence of MS (%)
SO SNO NSO NSNO Men
Women
Fig. 2. Assessment of nutrient intakes and nutrient intake as % KDRI among SO, SNO, NSO, and NSNO (male N=685, female N=775). There were significant difference protein KDRI (%), calcium KDRI (%) according to body composition in men (p=0.041, 0.002). SO; sarcopenic obesity, SNO; sarcopenic nonobesity, NSO; nonsarcopenic obesity, NSNO; nonsarcopenic nonobesity, KDRI; Korean dietary reference intakes. All models were adjusted for age, sex.
0 20 40 60 80 100 120 140 160 180
Protein Calcium Vitamin C
KDRI (%)
Men
SO SNO NSO NSNO
0 20 40 60 80 100 120 140 160 180
Protein Calcium Vitamin C
KDRI (%)
Women SO SNO NSO NSNO
Table 1-a. Food consumption frequency among SO, SNO, NSO, and NSNO (N=628, men)
N SO SNO NSO NSNO
pa 129 (19.9)b 161 (22.5) 69 (11.1) 299 (46.5)
Rice 19.49±0.39c 19.27±0.30 19.55±0.41 20.02±0.16 0.099
Barley 12.58±0.85 12.29±0.90 11.86±1.26 12.59±0.67 0.944
Ramyeon 0.53±0.07 0.62±0.07 0.72±0.14 0.63±0.05 0.540
Cereals Noodle 0.60±0.10 0.57±0.06 0.63±0.10 0.57±0.05 0.932
Bread 0.63±0.13 0.52±0.06 0.60±0.14 0.62±0.07 0.722
Rice cake 0.46±0.11 0.49±0.06 0.43±0.09 0.42±0.06 0.844
Snack 0.66±0.30 0.55±0.11 0.51±0.13 0.51±0.09 0.957
Legumes · potatoes
Soybean curd 1.66±0.23 1.36±0.12 1.81±0.30 1.23±0.10 0.142
Legumes 9.59±0.91 9.62±0.90 9.33±1.29 8.76±0.70 0.855
Soy milk 0.52±0.11 0.35±0.09 1.50±0.83 0.47±0.07 0.405
Potato 0.76±0.10 0.84±0.13 1.05±0.22 0.63±0.06 0.100
Sweet potato 0.47±0.06 0.59±0.08 0.52±0.09 0.49±0.05 0.599
Meat · eggs
Beef 0.76±0.12 0.64±0.08 0.71±0.11 0.57±0.05 0.241
Chicken 0.52±0.08 0.37±0.04 0.44±0.07 0.35±0.02 0.146
Pork 1.22±0.14 0.79±0.06 1.05±0.20 0.96±0.07 0.020
Egg 1.83±0.25 1.99±0.19 2.10±0.30 1.55±0.11 0.045
Milk · dairyproducts
Milk 1.41±0.28 1.70±0.27 1.28±0.22 1.62±0.21 0.580
Yoghurt 0.80±0.17 0.46±0.11 0.82±0.27 0.38±0.08 0.066
Ice-cream 0.34±0.06 0.22±0.04 0.45±0.15 0.25±0.03 0.349
Chub mackerel 0.72±0.09 0.64±0.07 0.96±0.21 0.67±0.05 0.505
Tuna 0.34±0.08 0.20±0.03 0.44±0.174 0.19±0.03 0.187
Yellow corvina 0.53±0.08 0.59±0.09 0.60±0.12 0.53±0.07 0.913
Pollack 0.61±0.08 0.41±0.04 0.44±0.06 0.45±0.041 0.170
Fish · shellfishe Anchovy 2.55±0.37 2.37±0.27 3.99±1.09 2.22±0.21 0.403
Fish paste 0.22±0.03 0.28±0.05 0.26±0.07 0.28±0.05 0.628
Cuttlefish 0.30±0.05 0.26±0.03 0.31±0.06 0.26±0.02 0.764
Shellfishes 0.43±0.10 0.29±0.05 0.37±0.08 0.27±0.04 0.329
Fermented fish 0.82±0.14 0.66±0.09 1.00±0.26 0.98±0.17 0.275
Citrus fruit 0.81±0.10 0.61±0.05 0.96±0.22 0.69±0.07 0.183
Persimmon 0.65±0.08 0.45±0.04 0.63±0.12 0.63±0.10 0.099
Pear 0.54±0.11 0.37±0.05 0.44±0.08 0.35±0.06 0.101
Water melon 0.58±0.08 0.34±0.03 0.64±0.06 0.42±0.03 0.001
Melon, yellow 0.47±0.08 0.38±0.04 0.56±0.08 0.34±0.02 0.034
Fruits Strawberry 0.41±0.04 0.36±0.04 0.50±0.15 0.45±0.12 0.650
Grape 0.67±0.14 0.36±0.02 0.61±0.15 0.39±0.03 0.056
Peach 0.37±0.07 0.25±0.03 0.38±0.06 0.27±0.02 0.116
Apple 1.40±0.15 1.25±0.14 1.15±0.19 1.12±0.12 0.561
Banana 0.68±0.13 0.59±0.08 0.59±0.15 0.37±0.05 0.015
Orange 0.89±0.42 0.28±0.05 0.59±0.22 0.30±0.22 0.275
body composition changes and it is occurred in women drama- tically by hormonal factors (Wells, 2007).
Other finding was that there were different food frequency and food preference according to 4 different groups between men and women. In addition, men are much more influenced by food than women. Among 53 variety food items, there were significant difference in eleven food items in men and six in women. Previous study supported that no relationship between nutrient intake and body composition was shown in older women, although their body composition changes were asso- ciated with inflammatory markers (Oh C, 2014). In this study, there were significantly different food frequency trend in protein rich food such as pork and egg in men, whereas, fish like a pollack and plant protein like soybean curd in women. Other study reported that protein intake at the RDA level (0.8/kg/day) resulted in the loss of muscle in the elderly (Vezzoli, Soldati, &
Gambaro, 2009). In addition, in previous study (C Oh, 2014), in- take of protein was enough compared with RDA, but it was insufficient for the elderly compared by new emerging reco- mmendation 1.0~1.2/kg/day (Volpi et al., 2013). Some study emphasized on both total and animal protein intake because plant proteins which tend to be deficient in one or more ess- ential amino acids and a source of high-biological-value protein than animal protein (Volkert, 2011). The Korean diet is trade- tionally high in plant foods like soybean and soy foods (Kim SR, 1999) so Korean elderly do not need to avoid intake of animal protein. The lack of nutrients such as vitamin B6, vitamin B12, folic acid in major animal protein diet accumulates homocystein and leads to inflammation (Kruman et al., 2002).
There were significant different food frequency trend in fruits and vegetables groups such as water melon, melon, grape, ba- nana, radish leaves, tomato, mushroom in men, whereas, melon,
strawberry, orange, carrot in women. Diet rich in fruit and vegetable has low calories, fat and sodium and were good sources of micronutrients such as vitamins and mineral, antioxi- dants, and other phytochemical components which had a protective effect on chronic diseases (Van Duyn & Pivonka, 2000).
Some studies indicated that eating meal rich in fruit and/or vegetables was closely correlated with serum biomarkers like vitamin A, vitamin C and folate (M, 2010) and influences DNA methylation controlled by gene expression on/off switch to treat chronic disease (Szarc vel Szic, Ndlovu, Haegeman, & Vanden Berghe, 2010). Using both DNA methylation and histone me- thylation processes, converting homocysteine to methionine is so important for mitigation for inflammation, as epigenetic view, by sufficient intake of vitamin B group. There were significantly different food frequency trend in cereal and milk products only in men, not in women. Increasing intake of calcium and vitamin D rich food like dairy products is important for not only bone health but also body composition through muscle synthesis because increase serum IGF-1 influenced by milk based protein is known to the most important mediator of muscle growth and repair possibly by utilizing Akt-mTOR-p70S6K (p70 ribosomal protein S6 kinase) signaling and then stimulate osteoblast pro- liferation, differentiation, and bone matrix formation (Philippou, Maridaki, Halapas, & Koutsilieris, 2007).
Also, the muscle-bone linkage stimulated by exercise and enhancing the skeletal accrual of calcium with the vitamin D must be important (Anderson, 2000). Kim et al., (Kim MK et al., 2011) reported vitamin D levels correlated negatively with app- endicular fat mass and positively protects skeletal muscle mass from insulin resistance. Low vitamin D level may influence atrophy of skeletal muscle and infiltration of fat impairs muscular performance in older individuals. The estimated average vitamin Table 1-a. Continued
N SO SNO NSO NSNO
pa 129 (19.9)b 161 (22.5) 69 (11.1) 299 (46.5)
Seaweeds Sea mustard 0.78±0.09 0.71±0.05 1.04±0.17 0.77±0.08 0.316
Laver 2.25±0.21 2.02±0.15 2.35±0.39 2.18±0.21 0.710
Korean cabbage 16.48±0.79 14.33±0.73 15.24±1.15 15.84±0.48 0.182
Radish root 5.89±0.72 5.11±0.48 4.41±0.75 4.60±0.36 0.427
Radish leaves 1.56±0.17 2.02±0.25 2.77±0.83 2.09±0.17 0.045
Soybean sprout 1.05±0.10 1.10±0.09 1.00±0.12 1.03±0.06 0.943
Spinach 0.52±0.06 0.53±0.04 0.51±0.11 0.55±0.05 0.973
Vegetables Cucumber 1.08±0.12 0.99±0.09 0.98±0.17 0.95±0.09 0.778
Hot pepper 1.74±0.26 1.37±0.15 1.68±0.36 1.36±0.13 0.471
Carrot 0.42±0.10 0.35±0.08 0.28±0.13 0.28±0.08 0.750
Squash 0.42±0.10 0.35±0.08 0.25±0.41 0.69±0.05 0.750
Cabbage 0.51±0.08 0.64±0.10 0.39±0.07 0.43±0.07 0.264
Tomato 1. 09±0.23 0.75±0.09 0.73±0.11 0.58±0.07 0.080
Mushroom 1.40±0.18 0.87±0.09 1.35±0.24 0.88±0.08 0.055
a Differences were tested using generalized linear model. b Categorical variables are given as numbers and percentages. C Numerical variables are given as means±SE. SO; sarcopenic obesity, SNO; sarcopenic nonobesity, NSO; nonsarcopenic obesity, NSNO; nonsarco- penic nonobesity. All models were adjusted for age, sex. p>0.1.
Table 1-b. Food consumption frequency among SO, SNO, NSO, and NSNO (N=746, women)
N SO SNO NSO NSNO
pa 299 (38.6)b 164 (22.6) 71 (8.7) 241 (30.1)
Rice 18.96±0.30c 18.97±0.38 19.48±0.44 19.53±0.265 0.399
Barley 13.76±0.57 13.42±0.98 12.98±1.65 12.18±0.68 0.329
Ramyeon 0.30±0.04 0.25±0.04 0.27±0.05 0.31±0.03 0.724
Cereals Noodle 0.53±0.06 0.58±0.13 0.55±0.19 0.44±0.05 0.351
Bread 0.47±0.05 0.54±0.09 0.47±0.11 0.47±0.05 0.901
Rice cake 0.55±0.05 0.56±0.11 0.43±0.06 0.54±0.05 0.508
Snack 0.47±0.08 0.32±0.05 0.37±0.11 0.64±0.13 0.126
Soybean curd 1.20±0.12 1.34±0.16 0.75±0.10 1.28±0.12 0.000
Legumes 10.31±0.69 10.77±0.85 10.23±1.67 10.09±0.68 0.931
Legumes · potatoes Soy milk 0.33±0.06 0.29±0.11 0.29±0.10 0.47±0.09 0.543
Potato 0.74±0.08 0.60±0.07 0.79±0.12 0.64±0.05 0.338
Sweet potato 0.68±0.07 0.57±0.07 0.62±0.09 0.55±0.05 0.466
Meat · eggs
Beef 0.44±0.04 0.47±0.06 0.32±0.05 0.46±0.06 0.106
Chicken 0.27±0.03 0.36±0.07 0.21±0.03 0.30±0.02 0.103
Pork 0.68±0.07 0.68±0.07 0.58±0.09 0.69±0.07 0.786
Egg 1.43±0.13 1.51±0.19 1.34±0.16 1.58±0.15 0.737
Milk 1.63±0.19 1.81±0.24 1.61±0.26 1.84±0.23 0.856
Milk · diary products Yoghurt 0.76±0.14 0.49±0.11 0.40±0.13 0.73±0.12 0.119
Ice-cream 0.24±0.03 0.19±0.03 0.22±0.04 0.21±0.03 0.688
Fish · shellfishe
Chub mackerel 0.55±0.05 0.64±0.07 0.61±0.15 0.56±0.06 0.734
Tuna 0.19±0.03 0.23±0.05 0.14±0.04 0.26±0.04 0.159
Yellow corvina 0.54±0.06 0.57±0.07 0.41±0.06 0.56±0.04 0.223
Pollack 0.40±0.03 0.40±0.04 0.32±0.04 0.49±0.04 0.029
Anchovy 1.90±0.19 2.40±0.53 1.54±0.34 2.11±0.22 0.416
Fish paste 0.28±0.04 0.28±0.04 0.17±0.04 0.25±0.03 0.278
Cuttlefish 0.29±0 .052 0.28±0 .048 0.18±0.06 0.23±0.03 0.473
Shellfishes 0.27±0.03 0.48±0.14 0.35±0.08 0.35±0.04 0.219
Fermented fish 0.51±0.07 0.50±0.10 0.48±0.16 0.75±0.12 0.331
Citrus fruit 1.05±0.08 0.85±0.07 0.86±0.14 0.91±0.07 0.354
Persimmon 0.81±0.07 0.73±0.07 0.85±0.14 0.74±0.05 0.668
Pear 0.40±0.04 0.42±0.06 0.38±0.05 0.41±0.04 0.971
Water melon 0.50±0.04 0.54±0.04 0.44±0.07 0.56±0.05 0.427
Melon, yellow 0.53±0.05 0.45±0.04 0.28±0.04 0.38±0.04 0.001
Fruits Strawberry 0.38±0.05 0.37±0.04 0.19±0.03 0.42±0.07 0.000
Grape 0.55±0.05 0.54±0.06 0.47±0.09 0.60±0.07 0.636
Peach 0.38±0.04 0.34±0.05 0.24±0.05 0.35±0.07 0.302
Apple 1.35±0.12 1.43±0.16 1.21±0.27 1.39±0.16 0.903
Banana 0.68±0.08 0.61±0.09 0.46±0.08 0.59±0.11 0.345
Orange 0.43±0.08 0.45±0.18 0.17±0.04 0.42±0.10 0.007
D requirement for older adults to reach a serum 25(OH)D level of 80 nmol/L (30 ng/mL) is 20 to 25 g/day (800 to 1,000 IU/day) (Jorde & Grimnes, 2011), and individuals who are obese, osteo- porosis, limited sun exposure, and malabsorption may need uptake to as much as 50 g /day (2,000 IU/day) (McKenna &
Freaney, 1998). Intake frequency of vitamin D in this study is that egg was less than once a month and milk and mackerel were about 2 times per month. To reach 800 to 1,000 IU/day, we recommend intake of egg, milk, and mackerel at least once a day with sun exposure. Specially, oily fish and milk products are good sources of protein, vitamin D, and calcium as well. Good sources of calcium in Korean were radish, anchovies, tofu, seaweed, and milk. Comparing with RDA (RDA 700 both gender), this study showed calcium-poor diets refer to intakes below about 60 % KDRI. Generally the recommended calcium intake is 1,000~1,500 mg/day (Seo et al., 2012). Altered calcium homeostasis was found to be associated with skeletal muscle weakness during the aging process. Calcium may combine with fatty acids in the intestine to inhibit the absorption of fat (Melanson, Donahoo, Dong, Ida, &
Zemel, 2005), so low calcium intake may increase adiposity and fat infiltration in skeletal muscle and lead to increased trigly- ceride (Zemel, 2002).
Up to this date, many studies have reported associations between dietary patterns and MS (Song & Joung, 2012) but there was no study directly examined the effects of food frequency and preference and body composition changes on Korean elderly, even though there were several reports that the body composi- tion changes in aging increased the risk of metabolic disorder (Song & Joung, 2012). But the mechanisms of nutrition com- pounds are quite complex so we need more study for underlying mechanism requires further study. The purposes of the study are
to determine the relation between food frequency and different body compositions which has relation with metabolic syndrome by gender. And further, these data on the relationship between food frequency and body compositions may be helpful for the prevention for chronic diseases. One limitations of the current study was the use of food frequency questionnaires (FFQ) for estimating food consumption trend and 24 recalls for nutrients intake. Due to memory errors in older adults, over or under re- porting may impact the accuracy of our data. Another possible limitation is that our criteria for body composition classification to 4 groups may be inaccurate because there are still different criteria and additionally, it may not accurately reflect muscle strength and function as well. However, this study used ASM/Wt as Lim et al., (Lim et al., 2010) showed that sarcopenia defined by ASM/Wt is more closely associated with metabolic factors than sarcopenia defined by ASM/height (m2) in Koreans. The strength of this study is that a few studies have examined the association between food frequency and body composition by gender in Korean elderly. And this study used representative national data, allowing us to infer its relation among Korean elderly.
In conclusion, body composition was associated with MS in both gender with 60 years or older. Body composition changes were more related with food frequency in elderly men (60 years or older) than women. Women who had a higher prevalence of MS than men, suggesting early nutritional intervention in elderly women may help them prevent body composition changes.
ACKNOWLEDGEMENTS
This work was supported by the Kyung Sung University of Korea, Research Fund, 2014. None of the authors have conflicts of Table 1-b. Continued
N SO SNO NSO NSNO
pa 299 (38.6)b 164 (22.6) 71 (8.7) 241 (30.1)
Seaweeds Sea mustard 0.94±0.08 0.92±0.13 0.94±0.15 0.84±0.05 0.694
Laver 2.48±0.22 2.88±0.26 2.36±0.35 2.39±0.19 0.485
Korean cabbage 14.97±0.61 15.16±0.65 14.03±1.06 14.95±0.57 0.849
Radish leaves 1.99±0.21 2.37±0.27 2.33±0.29 1.96±0.19 0.469
Radish root 3.95±0.40 4.51±0.61 3.82±0.57 4.5±0.34 0.812
Soybean sprout 1.04±0.07 1.15±0.15 0.83±0.12 1.07±0.06 0.277
Spinach 0.51±0.05 0.56±0.09 0.48±0.08 0.69±0.07 0.099
Vegetables Cucumber 1.01±0.09 1.23±0.17 1.10±0.21 1.09±0.10 0.703
Hot pepper 1.19±0.14 1.40±0.23 1.48±0.39 1.20±0.11 0.677
Carrot 0.29±0.05 0.14±0.03 0.20±0.08 0.26±0.05 0.047
Squash 0.88±0.08 0.91±0.14 0.70±0.09 0.93±0.07 0.234
Cabbage 0.49±0.10 0.56±0.13 0.74±0.21 0.41±0.06 0.361
Tomato 0.74±0.10 0.83±0.14 0.90±0.14 0.80±0.08 0.790
Mushroom 0.82±0.08 1.08±0.16 0.68±0.12 0.95±0.09 0.124
a Differences were tested using generalized linear model. b Categorical variables are given as numbers and percentages. c Numerical variables are given as means±SE. SO; sarcopenic obesity, SNO; sarcopenic nonobesity, NSO; nonsarcopenic obesity, NSNO; nonsarcopenic nonobesity. All models were adjusted for age, sex. p>0.1.
interest to disclose.
REFERENCES
Anderson, J. J. (2000). The important role of physical activity in skeletal development: how exercise may counter low calcium intake. The American Journal of Clinical Nutrition, 71(6), 1384- 1386.
Baumgartner, R. N., Koehler, K. M., Gallagher, D., Romero, L., Hey- msfield, S. B., Ross, R. R., & Lindeman, R. D. (1998). Epide- miology of sarcopenia among the elderly in New Mexico.
American Journal of Epidemiology, 147(8), 755-763.
Oh, C. R., No, J. K., & Kim, H. S. (2014). The study of the relationship of sarcopenic obesity and nutritional risk factor in Korean adults. Nutrition Research.
Candow, D. G., Forbes, S. C., Little, J. P., Cornish, S. M., Pinkoski, C.,
& Chilibeck, P. D. (2012). Effect of nutritional interventions and resistance exercise on aging muscle mass and strength. Bio- gerontology, 13(4), 345-358.
Chung, H. Y., Kim, H. J., Kim, K. W., Choi, J. S., & Yu, B. P. (2002).
Molecular inflammation hypothesis of aging based on the anti‐aging mechanism of calorie restriction. Microscopy Re- search and Technique, 59(4), 264-272.
Ford, E. S. (2005). Risks for all-cause mortality, cardiovascular di- sease, and diabetes associated with the metabolic syndrome a summary of the evidence. Diabetes Care, 28(7), 1769-1778.
Heymsfield, S. B., Smith, R., Aulet, M., Bensen, B., Lichtman, S., Wang, J., & Pierson, R. N. (1990). Appendicular skeletal muscle mass: measurement by dual-photon absorptiometry. The American Journal of Clinical Nutrition, 52(2), 214-218.
Janssen, I., Heymsfield, S. B., & Ross, R. (2002). Low relative ske- letal muscle mass (sarcopenia) in older persons is associated with functional impairment and physical disability. Journal of the American Geriatrics Society, 50(5), 889-896.
Jorde, R., & Grimnes, G. (2011). Vitamin D and metabolic health with special reference to the effect of vitamin D on serum lipids. Progress in Lipid Research, 50(4), 303-312.
Kastorini, C. -M., Milionis, H. J., Esposito, K., Giugliano, D., Gou- devenos, J. A., & Panagiotakos, D. B. (2011). The effect of me- diterranean diet on metabolic syndrome and its compo- nentsa meta-analysis of 50 studies and 534,906 individuals.
Journal of the American College of Cardiology, 57(11), 1299- 1313.
Kim, M. K., Baek, K. H., Song, K.-H., Il Kang, M., Park, C. Y., Lee, W. Y.,
& Oh, K. W. (2011). Vitamin D deficiency is associated with sarcopenia in older Koreans, regardless of obesity: The Fourth Korea National Health and Nutrition Examination Surveys (KNHANES IV) 2009. The Journal of Clinical Endocrinology &
Metabolism, 96(10), 3250-3256.
Kim S.R., & Kim, S. S. (1999). Some properties and contents of isoflavones in soybean and soybean foods. Korea Soybean Digest(16), 35- 46.
Kim, Y., & Lee, B.-K. (2012). Associations of blood lead, cadmium, and mercury with estimated glomerular filtration rate in the Korean general population: analysis of 2008-2010 Korean National Health and Nutrition Examination Survey data. En- vironmental Research, 118, 124-129.
Kruman, I. I., Kumaravel, T., Lohani, A., Pedersen, W. A., Cutler, R. G., Kruman, Y. & Mattson, M. P. (2002). Folic acid deficiency and homocysteine impair DNA repair in hippocampal neurons and sensitize them to amyloid toxicity in experimental mo- dels of Alzheimer's disease. The Journal of Neuroscience, 22(5), 1752-1762.
Li, Z., & Heber, D. (2012). Sarcopenic obesity in the elderly and strategies for weight management. Nutrition Reviews, 70(1), 57-64.
Lim, S., Kim, J. H., Yoon, J. W., Kang, S. M., Choi, S. H., Park, Y. J., &
Jang, H. C. (2010). Sarcopenic obesity: prevalence and asso- ciation with metabolic syndrome in the Korean Longitudinal Study on Health and Aging (KLoSHA). Diabetes Care, 33(7), 1652-1654.
Yang, M. J. (2010). Applicability of the serum folate and vitamin C as biomarkers of fruits and vegetables intake. Sungshin Wo- men's University, Seoul.
McKenna, M., & Freaney, R. (1998). Secondary hyperparathyroi- dism in the elderly: means to defining hypovitaminosis D.
Osteoporosis International, 8, S3-S6.
Melanson, E. L., Donahoo, W. T., Dong, F., Ida, T., & Zemel, M. B.
(2005). Effect of low‐and high‐calcium dairy‐based diets on macronutrient oxidation in humans. Obesity Research, 13(12), 2102-2112.
Oh, S. W. (2011). Obesity and metabolic syndrome in Korea.
Diabetes & Metabolism Journal, 35(6), 561-566.
Paik, H. Y. (2008). Dietary reference intakes for Koreans (KDRIs).
Asia Pac. J. Clin. Nutr., 17(S2), 416-419.
Philippou, A., Maridaki, M., Halapas, A., & Koutsilieris, M. (2007).
The role of the insulin-like growth factor 1 (IGF-1) in skeletal muscle physiology. In Vivo, 21(1), 45-54.
Seo, M. H., Kim, M. K., Park, S. E., Rhee, E. J., Park, C. Y., Lee, W.Y., &.
Oh, K. W. (2012). The association between daily calcium intake and sarcopenia in older, non-obese Korean adults: The Fourth Korea National Health and Nutrition Examination Survey (KNHANES IV) 2009. Endocrine Journal, 60(5), 679-686.
Song, Y., & Joung, H. (2012). A traditional Korean dietary pattern and metabolic syndrome abnormalities. Nutrition, Metabolism and Cardiovascular Diseases, 22(5), 456-462.
Szarc vel Szic, K., Ndlovu, M. N., Haegeman, G., & Vanden Berghe, W. (2010). Nature or nurture: let food be your epigenetic me- dicine in chronic inflammatory disorders. Biochemical Phar- macology, 80(12), 1816-1832.
Van Duyn, M. A. S., & Pivonka, E. (2000). Overview of the health benefits of fruit and vegetable consumption for the dietetics professional: selected literature. Journal of the American Die- tetic Association, 100(12), 1511-1521.
Vezzoli, G., Soldati, L., & Gambaro, G. (2009). Roles of calcium- sensing receptor (CaSR) in renal mineral ion transport. Current Pharmaceutical Biotechnology, 10(3), 302-310.
Volkert, D. (2011). The role of nutrition in the prevention of sarcopenia. Wiener Medizinische Wochenschrift, 161(17-18), 409- 415.
Volpi, E., Campbell, W. W., Dwyer, J. T., Johnson, M. A., Jensen, G. L., Morley, J. E., & Wolfe, R. R. (2013). Is the optimal level of protein intake for older adults greater than the recommen- ded dietary allowance? The Journals of Gerontology Series A:
Biological Sciences and Medical Sciences, 68(6), 677-681.
Wells, J. C. (2007). Sexual dimorphism of body composition. Best Practice & Research Clinical endocrinology & Metabolism, 21(3), 415-430.
Zemel, M. B. (2002). Regulation of adiposity and obesity risk by dietary calcium: mechanisms and implications. Journal of the American College of Nutrition, 21(2), 146S-151S.