Kor. J. Hort. Sci. Technol. 30(6):709-717, 2012 DOI http://dx.doi.org/10.7235/hort.2012.12139
Quality Prediction of Kiwifruit Based on Near Infrared Spectroscopy
Jin Su Lee
1, Seong-Cheol Kim
1*, Ki Cheol Seong
1, Chun-Hwan Kim
1, Yeong Cheol Um
2, and Seung-Koo Lee
31
National Agricultural Research Center for Climate Change, National Institute of Horticultural & Herbal Science, Rural Development Administration, Jeju 690-150, Korea
2
Vegetable Research Division, National Institute of Horticultural & Herbal Science, Suwon 440-706, Korea
3
Department of Plant Science, Seoul National University, Seoul 151-921, Korea
Abstract. To establish the standard of ripe kiwifruit sorting, near infrared (NIR) spectroscopy was performed on kiwifruit sampled from three farms. Destructive measurements of flesh firmness, soluble solids content (SSC), and acidity were performed and compared to measurement using NIR reflectance spectrums from 408 to 2,492 nm. NIR predictions of those quality factors were calculated using the modified partial least square regression method. Flesh firmness was predicted with a standard error of prediction (SEP) of 3.32 N and with a correlation coefficient (R
2) of 0.88. SSC was predicted with SEP of 0.49
oBrix and with R
2of 0.98.
Acidity was predicted with SEP of 0.28% and with R
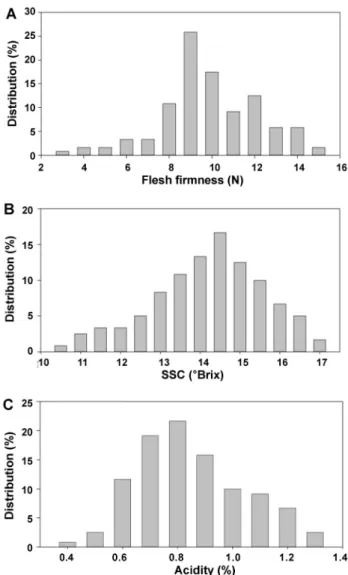
2of 0.91. Kiwifruit ripened at 20
oC for 15 days showed uneven qualities with normal distribution. Considering the SEP of each parameter, kiwifruit after ripening treatment could be non-destructively predicted their qualities and sorted by flesh firmness or soluble solids content through NIR prediction.
Additional key words: acidity, Actinidia deliciosa, non-destructive, soluble solids content, sorting
*Corresponding author: [email protected]
※ Received 25 July 2012; Revised 14 August 2012; Accepted 23 August 2012. This study was carried out with the support of “Cooperative Research Program for Agricultural Science & Technology Development (Project No. PJ006686022012)”, Rural Development Administration, Republic of Korea.
Introduction
Kiwifruit [(Actinidia deliciosa (A. Chev.) Liang et Ferguson, cv. Hayward] become edible level when they are ripened after harvest like avocado, banana, and mango. During ripening there are three major changes in kiwifruit; decrease of flesh firmness and acidity, and conversion of starch to sugar. These three factors are important in quality evaluation. However, every kiwifruit does not reach uniform level of quality after ripening. The variations of quality factors are explained by different patterns of sugar and starch formation inside fruit grown under different conditions (MacRae et al., 1989). There- fore, measuring the quality non-destructively and sorting into different grades before packing and shipping products are very important in kiwifruit from the marketing point of view.
There were many previous studies of non-destructive methods such as magnetic resonance imaging, X-ray computer tomography, non-contact laser air-puff method, and acoustic impulse-response technique (Lammertyn et al., 2003; McGlone and Jordan, 2000; Schotte et al., 1999). However, near infrared
(NIR) spectroscopy is the most prevalent among those non- destructive methods, because NIR spectroscopy is easy to handle, low in cost and high in accuracy (Clark et al., 2003;
Osborne et al., 1999).
NIR spectroscopy has been studied for measuring internal properties such as soluble solids content (SSC), pH, dry matter, flesh color, and flesh firmness to evaluate the possibility of estimating kiwifruit quality (Martinsen and Schaare, 1998;
McGlone and Kawano, 1998; McGlone et al., 2002; Moghimi et al., 2010; Schaare and Fraser, 2000; Schotsmans et al., 2007). However, there was no attempt to apply NIR spectro- scopy estimating equation to sorting kiwifruit practically.
In this study, NIR spectroscopy was performed to predict the quality such as flesh firmness, SSC, and acidity of kiwifruit non-destructively.
Materials and Methods Fruit Material
Kiwifruit [(Actinidia deliciosa (A. Chev.) Liang et Ferguson,
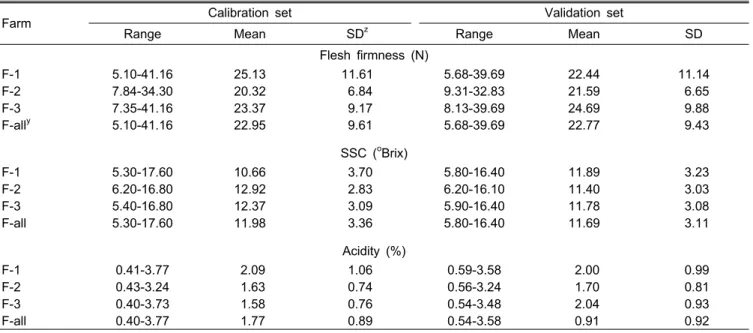
Table 1. Statistical characteristics of calibration and validation sets of kiwifruits obtained from different farms.
Farm Calibration set Validation set
Range Mean SD
zRange Mean SD
Flesh firmness (N)
F-1 5.10-41.16 25.13 11.61 5.68-39.69 22.44 11.14
F-2 7.84-34.30 20.32 6.84 9.31-32.83 21.59 6.65
F-3 7.35-41.16 23.37 9.17 8.13-39.69 24.69 9.88
F-all
y5.10-41.16 22.95 9.61 5.68-39.69 22.77 9.43
SSC (
oBrix)
F-1 5.30-17.60 10.66 3.70 5.80-16.40 11.89 3.23
F-2 6.20-16.80 12.92 2.83 6.20-16.10 11.40 3.03
F-3 5.40-16.80 12.37 3.09 5.90-16.40 11.78 3.08
F-all 5.30-17.60 11.98 3.36 5.80-16.40 11.69 3.11
Acidity (%)
F-1 0.41-3.77 2.09 1.06 0.59-3.58 2.00 0.99
F-2 0.43-3.24 1.63 0.74 0.56-3.24 1.70 0.81
F-3 0.40-3.73 1.58 0.76 0.54-3.48 2.04 0.93
F-all 0.40-3.77 1.77 0.89 0.54-3.58 0.91 0.92
z
Standard deviation.
y
Combined data set from all farm.
450 fruits from each farm were used for the calibration set. 60 fruits were used for validation.
cv. Hayward] were harvested from three farms (designated as F-1, F-2, and F-3) in November and stored in a storage room in which temperature was set at 2
oC. Fruit ripening was performed at 20
oC.
NIR Method
NIR spectra of intact fruit were measured with a NIR spectrophotometer (NIRSystem 6500, Silver Spring, MD, USA). The spectrophotometer scanned absorbance at 2 nm sampling wavelength intervals and a speed of 1.8 scans per sec. A spectral range covered the entire visible (408-700 nm), very NIR (700-1,092 nm), and NIR (1,108-2,492 nm). A ceramic cell was used to provide a reference spectrum before achieving absorbance spectra of each sample (McGlone and Kawano, 1998). Prior to NIR measurement all the samples were controlled to 20
oC, since the sample temperature influences the performance of a NIR calibration equation (Kawano et al., 1995; Peinado, 2006).
Development of NIR Prediction Regression
Each fruit from three farms was ripened at 20
oC on the day of harvest to establish NIR calibration curve for a wide range of flesh firmness, SSC, and acidity. From the next day, 90 fruits obtained from each farm were assessed for a single NIR spectrum every five days for 25 days. Totally 450 fruits from each farm were used for the calibration set.
Additional twelve fruits obtained from each farm were accessed for validation set every five days for 25 days. Total 60 fruits from each farm were used for the validation set. Statistical
characteristics of calibration and validation sets were shown in Table 1.
The best calibration method of F-1 was selected by treating the factors influencing calibration such as wavelength range, interval, and math treatment. Then the selected method was applied to F-2, F-3, and F-all (combined samples from all farms). Absorbance of F-1 set was measured in the region of 408-2,494, 700-1,092, 1,108-2,492, 408-1,092, and 700-2,494 nm to select the best wavelength region of NIR spectra calibration. Wavelength intervals of 4 nm were compared with 8 nm for the accuracy of calibration, since wavelength interval also influences the accuracy of calibration by determining a number of wavelength. Pretreating spectra and developing calibration equation method were the modified following procedures described by Saranwong et al. (2004) and Park et al. (2004). Spectra pretreatments of principle component analysis, standard normal variate and detrend, and first or second derivative (segment = 4 nm, gap = 4 nm) were performed as a data pretreatment to obtain the best calibration result. In the math treatment, first derivative was compared with second derivative to get the most accurate calibration.
Modified partial least square was used to develop calibration
equations. The calibration equations were applied to spectra
in the validation set. The statistics standard error of calibration
(SEC), standard error of prediction (SEP), and bias between
predicted and actual data were calculated to judge accuracy
of the model. WinISI II Project Manager 1.50 (Foss NIRSystem,
USA) was used for pretreating the spectra, developing calibration
equation, and calculating validation.
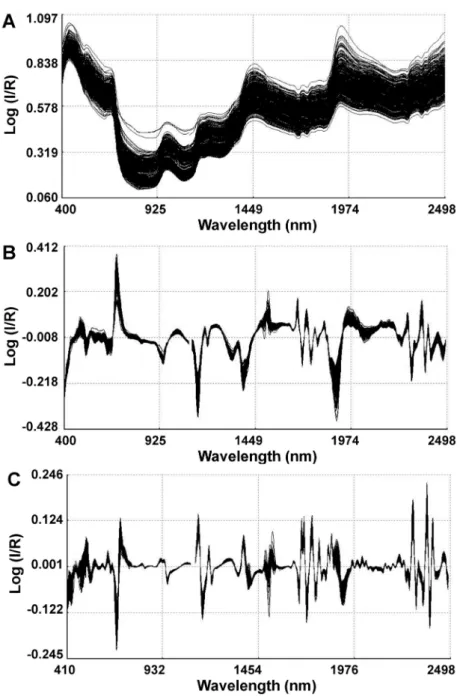
Fig. 1. Original absorbance (A), first derivative (B) and second derivative spectra (C) of kiwifruits.
Measurement of Flesh Firmness, SSC, and Acidity A slice of skin was removed from each fruit prior to measuring flesh firmness. Flesh firmness was measured using a hand-held penetrometer (FHR-5, Takemura, Japan) with a 5 mm probe. Flesh firmness was then calculated in Newton.
SSC and acidity were measured using an auto SSC and acidity analyzer (NH-2000, Horiba, Japan) that requires 5 mL of juice to get a reliable reading. SSC and acidity were expressed as
oBrix and %, respectively.
Results and Discussion Spectral Characteristics of Kiwifruit
Original and first derivative absorbance spectra ranged
400-2,500 nm of kiwifruit (F-1 set) in various quality cha- racteristics were shown in Fig. 1. With original spectra, it was very difficult to find any relationship among spectral characteristics and actual quality factors. Math treatment was used in the analysis of NIR absorbance spectra. First and second derivation of original spectra minimized the factors that changed base line of absorbance and interrupt absorbance such as sample temperature, density, and constructive variation (Park et al., 2004).
NIR Prediction of Flesh Firmness, SSC, and Acidity The accuracy of calibration was evaluated by SEC, R
2, SEP, and multiple correlation coefficients of validation (R
v2).
A calibration equation in high accuracy was low in SEC
Table 3. Calibration and validation statistics for NIR prediction modeling of flesh of kiwifruits obtained from different farms.
Farm Calibration Validation
SEC
z(N) R
2SEP
y(N) R
v2xBias
w(N)
F-1 2.04 0.95 2.80 0.94 0.020
F-2 2.11 0.87 3.05 0.80 0.784
F-3 2.34 0.90 3.21 0.90 0.010
F-all 2.98 0.88 3.32 0.88 0.697
z
Standard error of calibration.
y
Standard error of prediction.
x
Multiple correlation coefficient of validation.
w
The average of difference between actual value and NIR value.
450 fruits from each farm were used for calibration.
60 fruits from each farm were used for validation.
Fig. 2. Relation between actual and predicted flesh firmness of kiwifruits from F-all. Regression statistics (n = 180) was displayed. Fruits in different ripening stage were used for validation by sampling every five days for 25 days during ripening. SEP = standard error of prediction and R
v2= multiple correlation coefficient of validation.
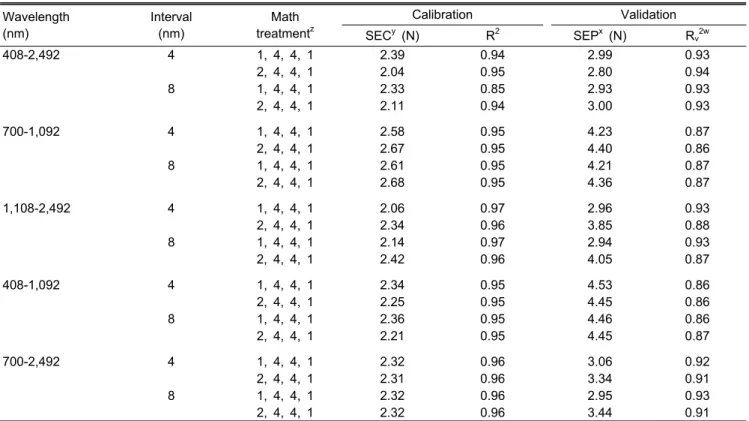
Table 2. Calibration and validation statistics for predicting flesh firmness of kiwifruits.
Wavelength (nm)
Interval (nm)
Math treatment
zCalibration Validation
SEC
y(N) R
2SEP
x(N) R
v2w408-2,492 4 1, 4, 4, 1 2.39 0.94 2.99 0.93
2, 4, 4, 1 2.04 0.95 2.80 0.94
8 1, 4, 4, 1 2.33 0.85 2.93 0.93
2, 4, 4, 1 2.11 0.94 3.00 0.93
700-1,092 4 1, 4, 4, 1 2.58 0.95 4.23 0.87
2, 4, 4, 1 2.67 0.95 4.40 0.86
8 1, 4, 4, 1 2.61 0.95 4.21 0.87
2, 4, 4, 1 2.68 0.95 4.36 0.87
1,108-2,492 4 1, 4, 4, 1 2.06 0.97 2.96 0.93
2, 4, 4, 1 2.34 0.96 3.85 0.88
8 1, 4, 4, 1 2.14 0.97 2.94 0.93
2, 4, 4, 1 2.42 0.96 4.05 0.87
408-1,092 4 1, 4, 4, 1 2.34 0.95 4.53 0.86
2, 4, 4, 1 2.25 0.95 4.45 0.86
8 1, 4, 4, 1 2.36 0.95 4.46 0.86
2, 4, 4, 1 2.21 0.95 4.45 0.87
700-2,492 4 1, 4, 4, 1 2.32 0.96 3.06 0.92
2, 4, 4, 1 2.31 0.96 3.34 0.91
8 1, 4, 4, 1 2.32 0.96 2.95 0.93
2, 4, 4, 1 2.32 0.96 3.44 0.91
z
1, 4, 4, 1 = first derivative, 2, 4, 4, 1 = second derivative.
y
Standard error of calibration.
x
Standard error of prediction.
w
Multiple correlation coefficient of validation.
450 fruits from F-1 farm were used for calibration.
60 fruits were used for validation.
and SEP, but high in R
2and R
v2(Adesogan et al., 1998).
Flesh firmness prediction of F-1 was most accurate in the range of 408-2,492 nm at the interval of 4 nm and in the math treatment of second derivative (Table 2). When the selected wavelength and math treatment factors were applied to F-all, calibration and validation statistics of flesh firmness were SEC = 2.98 N, R
2= 0.88, SEP = 3.32 N, and R
v2= 0.88 (Table 3 and Fig. 2). In the previous studies of flesh
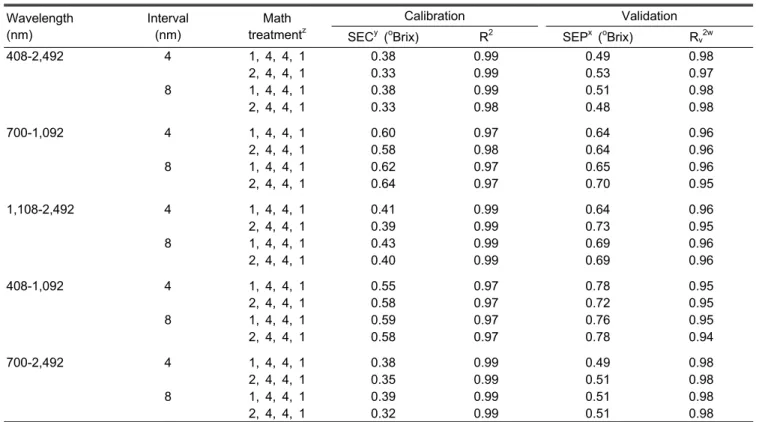
Table 5. Calibration and validation statistics for predicting SSC of kiwifruits.
Wavelength (nm)
Interval (nm)
Math treatment
zCalibration Validation
SEC
y(
oBrix) R
2SEP
x(
oBrix) R
v2w408-2,492 4 1, 4, 4, 1 0.38 0.99 0.49 0.98
2, 4, 4, 1 0.33 0.99 0.53 0.97
8 1, 4, 4, 1 0.38 0.99 0.51 0.98
2, 4, 4, 1 0.33 0.98 0.48 0.98
700-1,092 4 1, 4, 4, 1 0.60 0.97 0.64 0.96
2, 4, 4, 1 0.58 0.98 0.64 0.96
8 1, 4, 4, 1 0.62 0.97 0.65 0.96
2, 4, 4, 1 0.64 0.97 0.70 0.95
1,108-2,492 4 1, 4, 4, 1 0.41 0.99 0.64 0.96
2, 4, 4, 1 0.39 0.99 0.73 0.95
8 1, 4, 4, 1 0.43 0.99 0.69 0.96
2, 4, 4, 1 0.40 0.99 0.69 0.96
408-1,092 4 1, 4, 4, 1 0.55 0.97 0.78 0.95
2, 4, 4, 1 0.58 0.97 0.72 0.95
8 1, 4, 4, 1 0.59 0.97 0.76 0.95
2, 4, 4, 1 0.58 0.97 0.78 0.94
700-2,492 4 1, 4, 4, 1 0.38 0.99 0.49 0.98
2, 4, 4, 1 0.35 0.99 0.51 0.98
8 1, 4, 4, 1 0.39 0.99 0.51 0.98
2, 4, 4, 1 0.32 0.99 0.51 0.98
z
1, 4, 4, 1 = first derivative, 2, 4, 4, 1 = second derivative.
y
Standard error of calibration.
x
Standard error of prediction.
w
Multiple correlation coefficient of validation.
450 fruits from F-1 farm were used for calibration.
60 fruits were used for validation.
Table 4. Regression statistics for flesh firmness prediction between different farms using calibration sets (row labels) and validation set (column labels).
Calibration set Validation set (F-3) SEP
z(N) R
v2yBias
x(N)
F-1 6.84 0.54 -0.118
F-2 6.09 0.74 2.871
F-all 3.76 0.86 0.931
z
Standard error of prediction.
y
Multiple correlation coefficient of validation.
x
The average of difference between actual value and NIR value.
60 fruits were used for validation set.
firmness prediction of kiwifruit, wavelengths did not exceed 1,200 nm and predictions were relatively low in accuracy to this study. McGlone and Kawano (1998) and Costa et al. (1999) predicted flesh firmness with SEP of 7.8 N using 800-1,100 nm and with SEP of 0.61 kg・cm
-2using 650-1,200 nm, respectively. Similarly, calibration with very NIR region not included above 1,108 nm in this study resulted in poor calibration compared to other wavelength regions. However, in this study, the accuracy of flesh firmness prediction was improved by including wavelength region of 1,108-2,492 nm.
This result was supported by the report of Sohn and Cho (2000), who predicted flesh firmness of apple by measuring pectin using 1,100-2,500 nm. In the experiment of applying prediction model of specific farm to the other farms, the flesh firmness model of F-1 and F-2 did not predict flesh firmness of F-3 well compared to F-all (Table 4). Since internal characteristics of the fruits were different among farms by different circumstances of cultivation, in order to predict fruit quality with accuracy, the best way is to develop prediction model of various farms.
SSC prediction of F-1 was most accurate in the range of 408-2,492 nm at the interval of 8 nm and in the math
treatment of second derivative (Table 5). Using the wavelength
700-2,492 nm at the interval of 8 nm and the math treatment
of second derivative, SEC was 0.32
oBrix which was the
lowest. However, it was not selected since the SEP was
higher than 0.48
oBrix. Exclusion of wavelengths above 1,108
nm resulted in poor calibration compared to the other wave-
length regions. When the selected wavelength and math
treatment factors were applied to F-all, calibration and validation
statistics of SSC were SEC = 0.45
oBrix, R
2= 0.98, SEP
Table 7. Regression statistics for SSC prediction between different farms using calibration sets (row labels) and validation set (column label).
Calibration set Validation set (F-3) SEP
z(
oBrix) R
v2yBias
x(
oBrix)
F-1 0.68 0.60 -0.355
F-2 1.49 0.94 -1.276
F-all 0.54 0.97 -0.002
z
Standard error of prediction.
y
Multiple correlation coefficient of validation.
x
The average of difference between actual value and NIR value.
60 fruits were used for validation.
Table 6. Calibration and validation statistics for NIR prediction modeling of SSC of kiwifruits obtained from different farms.
Farm line
Calibration Validation
SEC
z(
oBrix) R
2SEP
y(
oBrix) R
v2xBias
w(
oBrix)
F-1 0.33 0.98 0.48 0.98 0.036
F-2 0.35 0.97 0.44 0.98 0.024
F-3 0.35 0.98 0.50 0.97 0.047
F-all 0.45 0.98 0.49 0.98 -0.005
z
Standard error of calibration.
y
Standard error of prediction.
x
Multiple correlation coefficient of validation.
w
The average of difference between actual value and NIR value.
450 fruits from each farm were used for calibration.
60 fruits were used for validation.
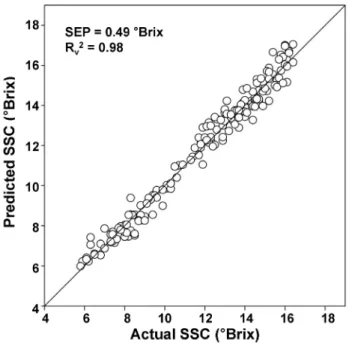
Fig. 3. Relation between actual and predicted SSC of kiwifruits from F-all. Regression statistics (n = 180) was displayed.
Fruits in different ripening stage were used for validation by sampling every five days for 25 days during ripening. SEP
= standard error of prediction and R
v2= multiple correlation coefficient of validation.
= 0.49
oBrix, and R
v2= 0.98 (Table 6 and Fig. 3). The SEP of SSC was significantly low compared to other published kiwifruit data; 1.2
oBrix (Martinsen and Schaare, 1998) and 1.18
oBrix (Schaare and Fraser, 2000). They predicted kiwifruit covered from unripe to overripe stage similar to the ripening stage of F-all set. However, the predictions were not as accurate as F-all set, since the measured absorbance in NIR region is below 1,100 nm. By comparing wavelength, the accuracy of SSC prediction was improved by including wavelength region of 1,108-2,492 nm. Some previous papers reported lower prediction error of SSC in kiwifruit; root mean square error of prediction (RMSEP) = 0.39
oBrix (McGlone and
Kawano, 1998), and root mean square error of cross validation
= 0.27
oBrix (Osborne et al., 1999). However those results could not be compare to SSC prediction of F-all, since they predicted ripe kiwifruit ranged from 10 to 16
oBrix with interactance method. Generally interactance method is more accurate than reflectance, since it is not susceptible to specular reflection which hinders accurate measurement (Martinsen and Schaare, 1998; Schaare and Fraser, 2000). However, accuracy of prediction using the interactance method was decreased when measuring wide ranged SSC of kiwifruit at different ripening stages, referring to the result of Clark et al. (2004) who predicted ripe kiwifruit ranged from 5 to 19
oBrix with interactance NIR method with an SEP of 0.92
o
Brix. Recently, Moghimi et al. (2010) reported improved SSC prediction model with transmission method exhibiting RMSEP = 0.259
oBrix. However this improvement needs to be considered that transmission method is also more accurate than reflectance method (Schaare and Fraser, 2000) and they used less fruit (70 fruit for calibration and 30 fruit for validation) and narrow range of SSC of the target fruit (12 to 14.5
oBrix). Considering all previous reports, SSC prediction of F-all can be acceptable. Similar to flesh firmness prediction, F-1 and F-2 calibration did not predict well F-3 compared to F-all calibration did; SEP = 0.68, 1.49, and 0.54
oBrix, respectively (Table 7).
Acidity prediction of F-1 was most accurate in the range of 408-2,492 nm at the interval of 8 nm and in the math treatment of first derivative (Table 8). Using the wavelength 700-2,492 nm at the interval of 8 nm and the math treatment of second derivative, SEC was 0.195% which was the lowest.
However, it was not selected since the SEP was higher than
0.223%. Like the results of other quality factors, exclusion
of wavelengths above 1,108 nm resulted in poor calibration
compared to the other wavelength regions. When the selected
wavelength and math treatment factors were applied to F-all,
calibration and validation statistics of acidity were SEC =
0.26%, R
2= 0.91, SEP = 0.28%, and R
v2= 0.91 (Table 9
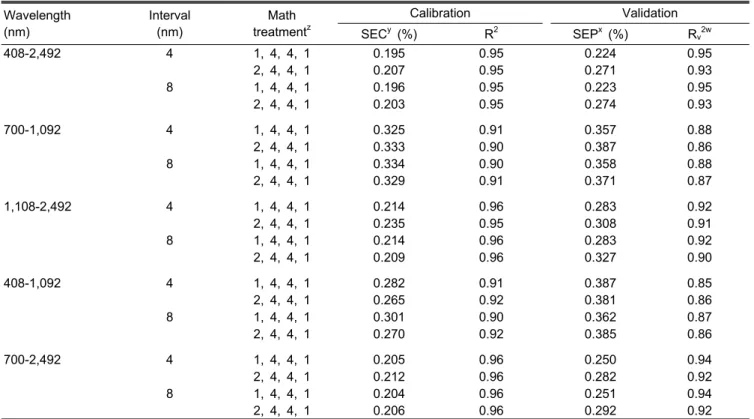
Table 8. The calibration and validation statistics for the prediction of acidity of kiwifruit.
Wavelength (nm)
Interval (nm)
Math treatment
zCalibration Validation
SEC
y(%) R
2SEP
x(%) R
v2w408-2,492 4 1, 4, 4, 1 0.195 0.95 0.224 0.95
2, 4, 4, 1 0.207 0.95 0.271 0.93
8 1, 4, 4, 1 0.196 0.95 0.223 0.95
2, 4, 4, 1 0.203 0.95 0.274 0.93
700-1,092 4 1, 4, 4, 1 0.325 0.91 0.357 0.88
2, 4, 4, 1 0.333 0.90 0.387 0.86
8 1, 4, 4, 1 0.334 0.90 0.358 0.88
2, 4, 4, 1 0.329 0.91 0.371 0.87
1,108-2,492 4 1, 4, 4, 1 0.214 0.96 0.283 0.92
2, 4, 4, 1 0.235 0.95 0.308 0.91
8 1, 4, 4, 1 0.214 0.96 0.283 0.92
2, 4, 4, 1 0.209 0.96 0.327 0.90
408-1,092 4 1, 4, 4, 1 0.282 0.91 0.387 0.85
2, 4, 4, 1 0.265 0.92 0.381 0.86
8 1, 4, 4, 1 0.301 0.90 0.362 0.87
2, 4, 4, 1 0.270 0.92 0.385 0.86
700-2,492 4 1, 4, 4, 1 0.205 0.96 0.250 0.94
2, 4, 4, 1 0.212 0.96 0.282 0.92
8 1, 4, 4, 1 0.204 0.96 0.251 0.94
2, 4, 4, 1 0.206 0.96 0.292 0.92
z
1, 4, 4, 1 = first derivative, 2, 4, 4, 1 = second derivative.
y
Standard error of calibration.
x
Standard error of prediction.
w
Multiple correlation coefficient of validation.
450 fruits from F-1 farm were used for calibration.
60 fruits were used for validation.
Fig. 4. Relation between actual and predicted acidity of kiwifruits from F-all. Regression statistics (n = 180) was displayed.
Fruits in different ripening stage were used for validation by sampling every five days for 25 days during ripening. SEP
= standard error of prediction and R
v2= multiple correlation coefficient of validation.
Table 9. Calibration and validation statistics for NIR prediction modeling of acidity of kiwifruits from different farms.
Farm line
Calibration Validation
SEC
z(%) R
2SEP
y(%) R
v2xBias
w(%)
F-1 0.20 0.96 0.22 0.95 0.029
F-2 0.18 0.92 0.28 0.90 0.108
F-3 0.21 0.91 0.27 0.93 -0.062
F-all 0.26 0.91 0.28 0.91 0.005
z
Standard error of calibration.
y
Standard error of prediction.
x
Multiple correlation coefficient of validation.
w
The average of difference between actual value and NIR value.
450 fruits from each farm were used for calibration.
60 fruits from each farm were used for validation.
and Fig. 4). NIR prediction of acidity was not performed
with kiwifruit before. However, acidity of mango was predicted
with SEP of 0.16 using 1,200-2,400 nm (Schmilovitch et
al., 2000) and 0.20% using 650-2,500 nm (Mahayothee et
al., 2002). The SEP was lower in mango than in kiwifruit,
however the range of acidity was narrower in mango than
in kiwifruit. Since the acidity of mango was narrower as
Table 10. Regression statistics for acidity prediction between different farms using calibration sets (row labels) and validation set (column label).
Calibration set Validation set (F-3)
SEP
z(%) R
v2yBias
x(%)
F-1 0.40 0.85 -0.095
F-2 0.57 0.80 -0.334
F-all 0.27 0.92 -0.063
z
Standard error of prediction.
y
Multiple correlation coefficient of validation.
x