− 453 − ISSN 1226-0983 (print) / 2287-1624 (on-line)
연령별 식사의 질에 미치는 지역의 영향
김 현 자1)·김 기 랑2)†
1)
강릉원주대학교 식품영양학과, 교수,
2)단국대학교 식품영양학과, 교수
Effect of Geographic Area on Dietary Quality across Different Age Groups in Korea
Hyun Ja Kim
1), Kirang Kim
2)†1)
Department of Food and Nutrition, Gangneung-Wonju National University, Gangneung, Korea, Professor
2)
Department of Food Science and Nutrition, Dankook University, Cheonan, Korea, Professor
†
Corresponding author Kirang Kim
Department of Food Science and Nutrition, Dankook University, 119, Dandae-ro, Dongnam-gu, Cheonan 31116, Korea
Tel: (041)550-3472 Fax: (041)559-7955
E-mail: [email protected]
Acknowledgments
This research was supported by a fund by Research of Korea Centers for Disease Control and Prevention and the National Research Foundation of Korea (NRF-2019R1H1A2080093).
Received: September 18, 2019 Revised: November 4, 2019 Accepted: November 4, 2019
ABSTRACT
Objectives: The objective of this study was to examine whether dietary quality varies among different age groups and geographic areas, and whether the difference between geographic areas varies across several age groups in Korea.
Methods: The subjects were 14,170 subjects who participated in the 2013-2015 Korea National Health and Nutrition Examination Survey. The dietary quality was assessed using the Korean Health Eating Index (KHEI). Age groups were categorized into six groupings, and areas were categorized into urban and rural according to their administrative districts. The effect of area on the KHEI score was analyzed by multiple linear regression analysis.
Results: The KHEI was the lowest in the 20-30s group (57.7 ± 0.4 score for 20s and 61.2 ± 0.3 score for 30s) and increased with age (p<0.001), showing the highest score in the 60s (67.9 ± 0.3 score), and then decreased again in the 70s and older (64.6 ± 0.3 score). As a result of comparing the KHEI score by area, the urban areas had higher KHEI scores than did the rural areas (63.5 ± 0.2 score for urban area and 62.2 ± 0.4 score for rural area, p=0.002). The difference between areas was dependent on the age group, showing a significant difference for subjects who were aged from 50s and older (p=0.002 for 50s, p<0.001 for 60s and p<0.001 for 70s and older). After adjusting for confounding factors, the effect of area on the KHEI score was only shown for those subjects in the over 60 years old group (p=0.035 for 60s and p<0.001 for 70s and older).
Conclusions: The dietary quality differed according to the age group and geographic area. The dietary quality was lower for younger people than that for older people, and in rural areas compared to that in urban areas, and especially for older adults. The area factor was a very important factor for the dietary quality.
Korean J Community Nutr 24(6): 453~464, 2019
KEY WORDS dietary quality, health eating index, Korea, area, age
This is an Open-Access article distributed under the terms of the Creative Commons Attribution Non-Commercial License (http://
creativecommons.org/licenses/by-nc/3.0) which permits unrestricted non-commercial use, distribution, and reproduction in any medium, provided the original work is properly cited.
RESEARCH ARTICLE
—————————————————————————
서 론
—————————————————————————
국제적으로 영양부족과 영양과잉의 불균형이 공존하고 있 고, 이는 암, 심혈관질환, 당뇨병과 같은 만성질환 발병과 사 망에 중요한 요인으로 고려되고 있다[1]. 세계보건기구 (WHO)에서는 지속적으로 증가하고 있는 만성질환의 예방 및 완화를 위해 만성질환 예방과 통제를 위한 활동 계획 2013-2020을 채택하고, 각국에서 관련 정책 추진을 모니 터링하기 위한 지표 중의 하나로 지방(포화지방) 섭취, 과일 과 채소 섭취, 나트륨 섭취와 같은 영양요인을 중요한 지표 로 채택하고 있다[2]. 1990년부터 2015년까지의 국제 질 병 부담 위험요인을 분석하여 Lancet에 발표한 연구 결과에 서는 79개의 관련 위험 요인 중 영양요인으로 과일, 채소, 전 곡류, 종실류, 우유 섭취의 감소, 붉은 고기, 가공육, 가당음 료 섭취 증가, 섬유소, 칼슘, 해산물로부터의 오메가-3 지방 산, 다가 불포화지방산 섭취의 감소와 트랜스지방산과 나트 륨 섭취의 증가를 포함시켰다[3].
이와 같이 만성질환에서의 중요한 식생활 요인은 다양한 식품과 영양소의 적절한 섭취와 균형잡힌 식사의 질로, 국외 에서는 식생활 정책을 수립, 시행, 평가에 활용 가능한 식사 의 질 평가도구를 개발하여 사용하고 있다[4-8]. 국내에서 도 최근 한국인 식생활지침과 2010년 한국인 영양섭취기준 등에서 명시하고 있는 식사를 준수하는지의 여부 등을 포함 한 전반적인 식사의 질을 평가할 수 있는 건강한 한국 성인 을 위한 식생활평가지수(Korean Healthy Eating Index, KHEI)를 개발[9]하여 국민건강영양조사 결과 산출에 활용 하고 있다[10].
만성질환과 연관성이 높은 식사의 질에 영향을 미치는 요 인으로는 인구학적 특성, 사회경제적 수준, 생활 습관과 같 은 개인적 요인을 일반적으로 고려하고 있다[11-13]. 그러 나 국외 여러 연구에서는 지역사회 환경의 차이에 의해서도 식생활 차이가 있음을 보고하고 있다[14-17]. 이미 국내에 서 지역 간 건강불평등에 대한 문제 제기가 보고되고 있고 [18-19] 지역 간 식생활의 차이는 지역 간 건강 격차에도 영향을 미칠 수 있어 이에 대한 이해는 필수적이다. 최근 지 역 간 건강불평등을 조사한 연구에서 연령대별로 비만에 미 치는 지역의 영향이 다르게 나타났다[18]. 20대 미만에서 는 농촌지역이 도시지역에 비해 비만 위험이 높았으나, 50 대까지는 지역 간 차이를 보이지 않다가 60대 이후로는 도 시지역에서 비만 위험이 높은 결과를 보였다.
식생활에 대한 지역 간 차이 또한 연령대에 따라 다른 양 상을 보일 가능성이 있으나 현재까지는 지역과 연령을 같이
고려하여 식사의 질에 대한 차이 여부를 분석한 연구는 없 다. 그러므로 본 연구에서는 2013-2015 국민건강영양조 사의 식생활평가지수 자료를 이용하여 연령과 지역별 식사 의 질에 차이가 있는지를 파악하고, 지역 간의 식사의 질 차 이가 연령별로 다른 양상을 가지는지 파악하고자 하였다.
—————————————————————————
연구 대상 및 방법
—————————————————————————
1. 연구 자료 및 대상자
본 연구 대상자는 국민건강영양조사(Korea National Health and Nutrition Examination Survey, KNHANES) 제6기 조사(2013-2015)에 참여한 만 19 세 이상 성인 18,034명 중 만성질환자(1,529명), 임신부와 수유부(169명), 에너지 섭취량이 500 kcal 미만 혹은 5,000 kcal 초과한 자(2,107명), 식생활평가지수 자료가 결측치인 대상자(59명)를 제외한 최종 14,170명이었다. 국 민건강영양조사는 질병관리본부의 생명윤리위원회에서 심 의를 받은 조사이므로(2013-07CON-03-4C, 2013- 12EXP-03-5C, 2015-01-02-6C) 본 연구에서는 별 도로 심의를 받지 않고 수행하였다.
2. 인구사회학적 및 건강행태학적 요인
대상자들의 인구사회학적 특성으로 연령, 성별, 가구 형 태, 결혼 상태, 교육 및 소득수준, 직업, 거주 지역이 포함되 었다. 연령은 만 19세-29세, 30-39세, 40-49세, 50- 59세, 60-69세, 70세 이상으로 6개 군으로 구분하였다. 가 구 형태는 1인가구와 1인 이상 가구인 두 군으로, 결혼 상태 는 미혼, 기혼, 별거 또는 이혼, 사별인 네 군으로, 교육 수준 은 초등학교 졸업 이하, 중학교 졸업, 고등학교 졸업, 대학졸 업 이상인 네 군으로, 소득수준은 4분위수로, 직업은 노동직, 사무직, 학생/주부/무직 세 군으로 분류하였다. 지역 변수는 동지역을 도시 지역, 읍면 지역을 농촌지역으로 구분하였다.
인구사회학적 요인 이외 기존 연구에서 식사의 질에 영향
을 미치는 것으로 보고된 건강행태학적 요인을 분석에 포함
하였다[11-13]. 관련 요인으로는 비만도, 흡연, 음주, 걷기
실천, 영양교육 참여여부, 동반식사여부, 식품지원 프로그램
수혜여부, 식품안정성으로서, 비만도는 체질량지수 값에 따
라 18.5 kg/m
2미만(저체중), 18.5-23 kg/m
2미만(정상
체중), 23-25 kg/m
2미만(과체중), 25 kg/m
2이상(비만)
네 군으로, 흡연은 비흡연자, 과거흡연자, 현재흡연자 세 군
으로, 음주는 비음주자(과거음주자 포함), 현재음주자 두 군
으로, 걷기 활동은 최근 1주일 동안 걷기를 1회 30분 이상
주 5일 이상 실천한 군과 아닌 두 군으로, 동반 식사는 저녁
식사 시 가족 및 가족 외 다른 사람과 함께 식사를 한 군과 아 닌 군으로, 식품안정성은 18개의 가구 문항 총점에서 0-2 점은 식품안정성, 3점 이상은 식품불안정성인 두 군으로 구 분하였다.
3. 식사의 질
식사의 질은 식생활평가지수로 평가하였다. 식생활평가지 수 항목은 총 14항목으로, 섭취를 권장하는 식품과 영양소 의 섭취 적정성을 평가하는 영역 8항목(아침식사, 잡곡 섭 취, 총 과일 섭취, 생과일 섭취, 총 채소 섭취, 김치와 장아찌 류를 제외한 채소 섭취, 고기, 생선, 달걀, 콩류 섭취, 우유 및 유제품 섭취)과 섭취를 제한하는 식품과 영양소의 절제를 평 가하는 영역 3항목(포화지방산 에너지섭취 비율, 나트륨 섭 취, 당류와 음료류 에너지섭취 비율), 그리고 에너지 섭취의 균형을 평가하는 영역 3항목(탄수화물 에너지섭취 비율, 지 방 에너지섭취 비율, 에너지 적정 섭취)으로 구성되어 있다.
식생활평가지수의 총점은 100점으로, 적정성 평가 영역에 서는 잡곡, 과일, 채소 관련 항목은 5점, 그 이외 항목은 10 점을 부여하고, 절제 평가 영역은 모든 항목에서 10점을 부 여하고, 균형 평가 영역은 모든 항목에서 5점을 부여하여 계 산되었다[20].
4. 통계분석
모든 분석은 국민건강영양조사의 복합표본설계 요소를 반 영하여 복합표본분석으로 이루어졌다. 지역 간에 인구사회학 적 요인의 차이는 대상자의 비율로 제시하였으며, 카이제곱 검정방법으로 유의성을 검정하였다. 연령별 식생활평가지수 점수는 성별을 보정한 평균으로 제시하였고, 지역별 식생활 평가지수 점수는 연령과 성별을 보정한 평균으로 제시하였으 며 식생활평가지수를 구성하는 각 14개의 항목의 점수는 정 규분포를 보이지 않아 그룹 간 차이를 검정하는 분석에서 로 그로 변환된 값으로 복합표본 다중선형회귀분석을 통해 성과 연령을 보정한 후 유의성을 검정하였다. 식사의 질에 영향을 미칠 수 있는 다른 혼란변수를 보정하고도 지역이 식사의 질 에 영향을 미치는지 파악하기 위하여 표합표본 다중선형회귀 분석을 실시하였다. 모든 분석은 IBM SPSS Statistics 23.0 Program(IBM SPSS INC, Armonk, NY, USA) 을 이용하여 유의성 검정 p<0.05 수준에서 실시하였다.
—————————————————————————
결 과
—————————————————————————
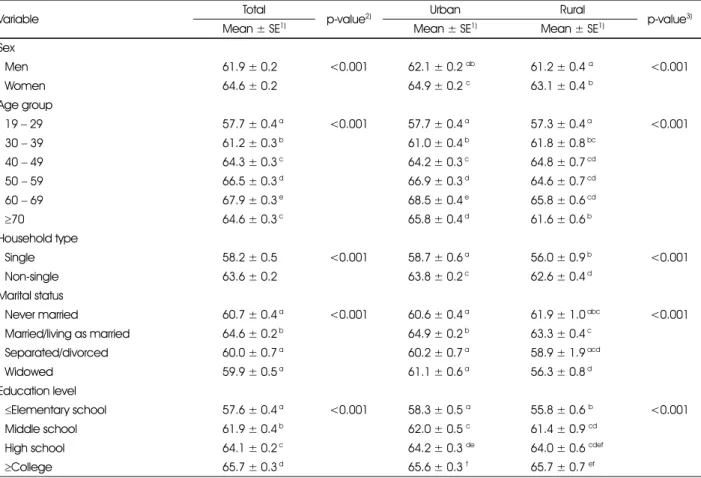
1. 대상자의 지역별 일반적 특성
대상자의 지역별 일반적 특성은 Table 1과 같다. 농촌 지 역에서 남자, 60세 이상, 배우자와 같이 살고 있거나 사별,
Table 1. General characteristics of adults aged 19 years and older, 2013-2015 KNHANES
Variables Total
(n=14,170)
Urban (n=11,389)
Rural
(n=2,781) p-value
2)Sex
Men 49.9 (0.4)
1)49.4 (0.5) 52.5 (1.0)
<0.004Women 50.1 (0.4) 50.6 (0.5) 47.5 (1.0)
Age group
19 − 29 19.0 (0.6) 20.6 (0.6) 11.4 (1.0) <0.001
30 − 39 19.7 (0.6) 20.0 (0.6) 18.1 (1.7)
40 − 49 22.0 (0.5) 22.4 (0.6) 20.0 (1.3)
50 − 59 19.5 (0.4) 19.0 (0.5) 22.4 (1.2)
60 − 69 10.5 (0.3) 10.1 (0.3) 12.6 (0.9)
≥70 9.2 (0.3) 7.9 (0.3) 15.5 (1.1)
Household types
Single 7.1 (0.4) 6.9 (0.4) 8.2 (0.7)
<0.095Non-single 92.9 (0.4) 93.1 (0.4) 91.8 (0.7)
Marital status
Never married 23.1 (0.6) 25.1 (0.7) 14.0 (1.0) <0.001
Married/living as married 66.8 (0.7) 65.3 (0.7) 73.6 (1.3)
Separated/divorced 4.0 (0.2) 4.2 (0.3) 3.0 (0.4)
Widowed 6.1 (0.2) 5.4 (0.2) 9.5 (0.7)
Education level
≤Elementary school 15.4 (0.5) 13.0 (0.5) 27.2 (2.0) <0.001
Middle school 8.6 (0.3) 8.1 (0.4) 11.1 (0.7)
High school 38.4 (0.7) 38.6 (0.7) 37.5 (1.6)
≥College 37.6 (0.8) 40.3 (0.9) 24.2 (1.8)
노동직에 종사하고 있는 비율이 도시지역보다 더 높았고, 교 육과 소득 수준은 더 낮은 것으로 나타났다. 건강행태학적 특 성에서는 비만율, 현재 흡연율, 동반식사 비율은 농촌 지역 이 더 높았으나, 음주율, 걷기 실천율, 영양교육 수혜율은 도 시지역이 더 높았다. 독거 여부, 식품 지원 프로그램 참여, 식 품안정성은 지역 간에 차이를 보이지 않았다.
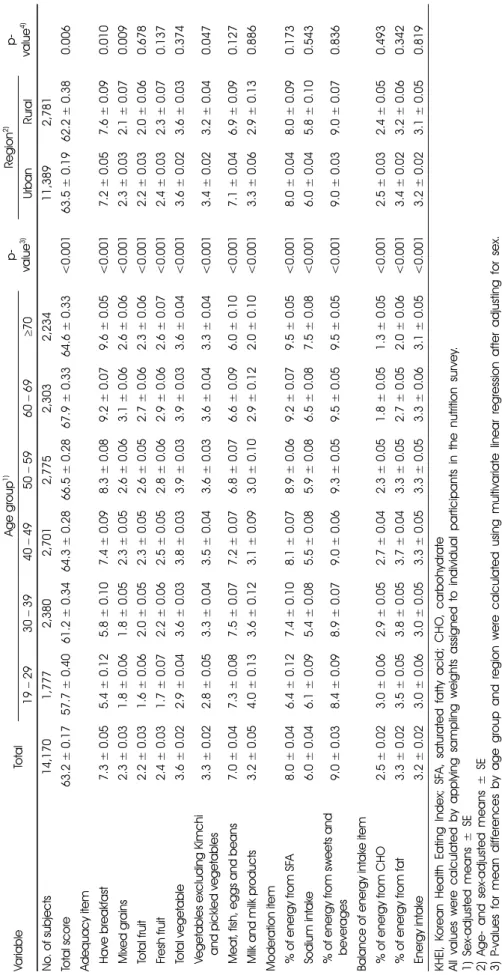
2. 연령별, 지역별 식생활평가지수
우리나라 전체 성인의 식생활평가지수는 63.2±0.2점이 었다(Table 2). 20-30대의 경우 각각 57.7±0.4점, 61.2±0.3점으로 가장 낮았고, 연령이 증가할수록 점수가 향상하면서 60대에 67.9±0.3점으로 가장 큰 값을 보였다 (p<0.001). 지역별 식생활평가지수는 도시지역이 63.5±0.2
Table 1. continued
Variables Total
(n=14,170)
Urban (n=11,389)
Rural
(n=2,781) p-value
2)Household income
Q1 (lowest) 25.0 (0.7) 23.9 (0.8) 30.0 (1.7) <0.001
Q2 25.1 (0.6) 24.7 (0.7) 27.3 (1.5)
Q3 24.6 (0.6) 25.2 (0.7) 22.1 (1.3)
Q4 (highest) 25.2 (0.8) 26.2 (0.9) 20.5 (1.9)
Job status
Non-manual job 26.3 (0.6) 28.4 (0.7) 15.6 (1.3) <0.001
Manual job 37.9 (0.7) 34.1 (0.7) 56.8 (1.8)
Unemployment
3)35.8 (0.6) 37.5 (0.6) 27.6 (1.3)
Weight status
Underweight 4.5 (0.2) 4.6 (0.3) 3.9 (0.5) <0.001
Normal 39.8 (0.5) 40.6 (0.6) 35.4 (1.1)
Overweight 22.9 (0.4) 22.7 (0.5) 23.7 (0.9)
Obesity 32.9 (0.5) 32.1 (0.6) 37.0 (1.3)
Smoking
Never 60.0 (0.5) 60.9 (0.6) 55.6 (1.1) <0.001
Ex 17.1 (0.4) 16.8 (0.4) 18.4 (0.9)
Current 22.9 (0.5) 22.3 (0.6) 26.0 (1.1)
Drinking
Yes 90.5 (0.3) 91.2 (0.4) 86.4 (1.0) <0.001
No 9.5 (0.3) 8.8 (0.4) 13.6 (1.0)
Walking exercise
Yes 40.4 (0.6) 42.2 (0.7) 31.3 (1.6) <0.001
No 59.6 (0.6) 57.8 (0.7) 68.7(1.6)
Nutritional education
Yes 3.7 (0.2) 3.9 (0.2) 2.8 (0.4)
<0.012No 96.3 (0.2) 96.1 (0.2) 97.2 (0.4)
Eating with others
Yes 79.7 (0.5) 79.2 (0.6) 82.3 (1.0)
<0.011No 20.3 (0.5) 20.8 (0.6) 17.7 (1.0)
Food assistance program participation
Yes 2.1 (0.2) 2.2 (0.2) 1.8 (0.3)
<0.212No 97.9 (0.2) 97.8 (0.2) 98.2 (0.3)
Food security
Yes 92.0 (0.4) 92.0 (0.5) 92.2 (0.9)
<0.811No 8.0 (0.4) 8.0 (0.5) 7.8 (0.9)
KNHANES, Korea National Health and Nutrition Examination Survey.
1) All % (SE) were calculated by applying sampling weights assigned to individual participants in the nutrition survey.
2) P-values for % differences between urban and rural area were calculated using the chi-square test
3) Including housewives or student
Ta bl e 2 . M e a n val u e o f e a ch KHEI item b y a g e gro up and re gio n Va ria b le T o ta l A g e g rou p
1)p- va lue
3)Re g io n
2)p- val u e
4)19 − 29 30 − 39 40 − 49 50 − 59 60 − 69 ≥ 7 0 Ur ba n R ur al N o . o f s u b je c ts 14, 170 1 ,77 7 2 ,3 8 0 2 ,70 1 2 ,7 7 5 2 ,303 2 ,234 11, 3 8 9 2 ,781 To ta l scor e 6 3 .2 ± 0 .1 7 57 .7 ± 0.4 0 61 .2 ± 0.3 4 64 .3 ± 0.2 8 66 .5 ± 0.2 8 67 .9 ± 0.3 3 64 .6 ± 0.3 3 <0 .0 0 1 63 .5 ± 0.1 9 62 .2 ± 0.3 8 0.0 0 6 A dequ acy it em Ha ve b re a kf a st 7. 3 ± 0. 05 5. 4 ± 0 .12 5. 8 ± 0 .10 7. 4 ± 0 .09 8. 3 ± 0 .08 9. 2 ± 0 .07 9. 6 ± 0 .05 < 0 .001 7. 2 ± 0 .05 7. 6 ± 0 .09 0 .010 M ix e d g ra in s 2. 3 ± 0. 03 1. 8 ± 0 .06 1. 8 ± 0 .05 2. 3 ± 0 .05 2. 6 ± 0 .06 3. 1 ± 0 .06 2. 6 ± 0 .06 < 0 .001 2. 3 ± 0 .03 2. 1 ± 0 .07 0 .009 To ta l f ru it 2. 2 ± 0. 03 1. 6 ± 0 .06 2. 0 ± 0 .05 2. 3 ± 0 .05 2. 6 ± 0 .05 2. 7 ± 0 .06 2. 3 ± 0 .06 < 0 .001 2. 2 ± 0 .03 2. 0 ± 0 .06 0 .678 Fr e sh f ru it 2. 4 ± 0. 03 1. 7 ± 0 .07 2. 2 ± 0 .06 2. 5 ± 0 .05 2. 8 ± 0 .06 2. 9 ± 0 .06 2. 6 ± 0 .07 < 0 .001 2. 4 ± 0 .03 2. 3 ± 0 .07 0 .137 To ta l ve ge ta b le 3. 6 ± 0. 02 2. 9 ± 0 .04 3. 6 ± 0 .03 3. 8 ± 0 .03 3. 9 ± 0 .03 3. 9 ± 0 .03 3. 6 ± 0 .04 < 0 .001 3. 6 ± 0 .02 3. 6 ± 0 .03 0 .374 V e g e tabl es excl u d in g K imch i an d p ic kl e d ve g e ta bl e s 3. 3 ± 0. 02 2. 8 ± 0 .05 3. 3 ± 0 .04 3. 5 ± 0 .04 3. 6 ± 0 .03 3. 6 ± 0 .04 3. 3 ± 0 .04 < 0 .001 3. 4 ± 0 .02 3. 2 ± 0 .04 0 .047 M e at , f ish , e g gs a n d be a n s 7. 0 ± 0. 04 7. 3 ± 0 .08 7. 5 ± 0 .07 7. 2 ± 0 .07 6. 8 ± 0 .07 6. 6 ± 0 .09 6. 0 ± 0 .10 < 0 .001 7. 1 ± 0 .04 6. 9 ± 0 .09 0 .12 7 M ilk a n d m ilk p ro d u c ts 3. 2 ± 0. 05 4. 0 ± 0 .13 3. 6 ± 0 .12 3. 1 ± 0 .09 3. 0 ± 0 .10 2. 9 ± 0 .12 2. 0 ± 0 .10 < 0 .001 3. 3 ± 0 .06 2. 9 ± 0 .13 0 .886 Mode rat io n i te m % o f e n e rg y f ro m S FA 8 .0 ± 0. 04 6. 4 ± 0 .12 7. 4 ± 0 .10 8. 1 ± 0 .07 8. 9 ± 0 .06 9. 2 ± 0 .07 9. 5 ± 0 .05 < 0 .001 8. 0 ± 0 .04 8. 0 ± 0 .09 0 .173 So di um in ta ke 6. 0 ± 0. 04 6. 1 ± 0 .09 5. 4 ± 0 .08 5. 5 ± 0 .08 5. 9 ± 0 .08 6. 5 ± 0 .08 7. 5 ± 0 .08 < 0 .001 6. 0 ± 0 .04 5. 8 ± 0 .10 0 .543 % of en er gy fr om sw eet s an d b e vera ges 9. 0 ± 0. 03 8. 4 ± 0 .09 8. 9 ± 0 .07 9. 0 ± 0 .06 9. 3 ± 0 .05 9. 5 ± 0 .05 9. 5 ± 0 .05 < 0 .001 9. 0 ± 0 .03 9. 0 ± 0 .07 0 .836 Bal a n ce of ener g y in ta ke it em % o f e n e rg y f ro m CH O 2 .5 ± 0. 02 3. 0 ± 0 .06 2. 9 ± 0 .05 2. 7 ± 0 .04 2. 3 ± 0 .05 1. 8 ± 0 .05 1. 3 ± 0 .05 < 0 .001 2. 5 ± 0 .03 2. 4 ± 0 .05 0 .493 % o f e n e rg y f ro m f a t 3 .3 ± 0. 02 3. 5 ± 0 .05 3. 8 ± 0 .05 3. 7 ± 0 .04 3. 3 ± 0 .05 2. 7 ± 0 .05 2. 0 ± 0 .06 < 0 .001 3. 4 ± 0 .02 3. 2 ± 0 .06 0 .342 E n e rg y i nta ke 3. 2 ± 0. 02 3. 0 ± 0 .06 3. 0 ± 0 .05 3. 3 ± 0 .05 3. 3 ± 0 .05 3. 3 ± 0 .06 3. 1 ± 0 .05 < 0 .001 3. 2 ± 0 .02 3. 1 ± 0 .05 0 .819 KHE I, K o rea n He alth E ating Ind e x; S FA , sa turated f atty a c id ; C H O , c arb ohyd rate All value s were c a lc ulate d by a ppl ying sa mp ling we ights as si gned to indi v idual pa rtici pants in the n utri tion sur v e y. 1) Se x- a d jus ted me ans ± SE 2) Age- a n d s e x- adj uste d m e a n s ± S E 3) P -value s fo r m e a n di ff ere n c e s by age gro up a nd regio n we re ca lcul ated us ing m u ltivaria te line ar re gre ssi on af ter adj usting for se x. 4) P -value s fo r m e a n di ff ere n c e s by age gro up a nd regio n we re ca lcul ated us ing m u ltivaria te line ar re gre ssi on af ter adj usting fo r a g e (co ntinuo us) and se x.
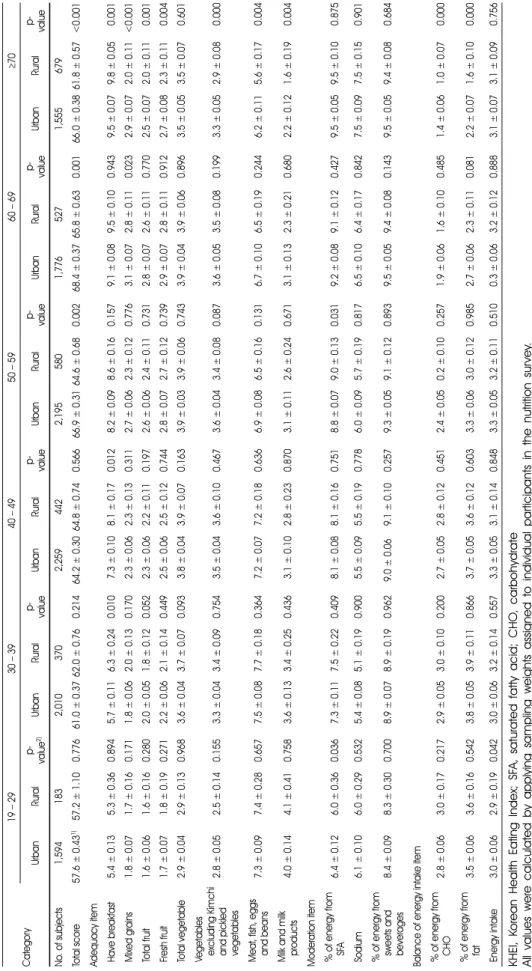
Ta bl e 3 . D iff e renc e o f me an value of ea ch KHEI it em b e twee n urban a nd rural are a a c c o rd ing to age group
Category19−2930−3940−4950−5960−69≥70 UrbanRuralp- value2)UrbanRuralp- valueUrbanRuralp- valueUrbanRuralp- valueUrbanRuralp- valueUrbanRuralp- value No. of subjects1,5941832,0103702,2594422,1955801,7765271,555679 Total score57.6 ± 0.431)57.2 ± 1.100.77661.0 ± 0.3762.0 ± 0.760.21464.2 ± 0.3064.8 ± 0.740.56666.9 ± 0.3164.6 ± 0.680.00268.4 ± 0.3765.8 ± 0.630.00166.0 ± 0.3861.8 ± 0.57<0.001 Adequacy item Have breakfast65.4 ± 0.1365.3 ± 0.360.89465.7 ± 0.1166.3 ± 0.240.01067.3 ± 0.1068.1 ± 0.170.01268.2 ± 0.0968.6 ± 0.160.15769.1 ± 0.0869.5 ± 0.100.94369.5 ± 0.0769.8 ± 0.050.001 Mixed grains61.8 ± 0.0761.7 ± 0.160.17161.8 ± 0.0662.0 ± 0.130.17062.3 ± 0.0662.3 ± 0.130.31162.7 ± 0.0662.3 ± 0.120.77663.1 ± 0.0762.8 ± 0.110.02362.9 ± 0.0762.0 ± 0.11<0.001 Total fruit61.6 ± 0.0661.6 ± 0.160.28062.0 ± 0.0561.8 ± 0.120.05262.3 ± 0.0662.2 ± 0.110.19762.6 ± 0.0662.4 ± 0.110.73162.8 ± 0.0762.6 ± 0.110.77062.5 ± 0.0762.0 ± 0.110.001 Fresh fruit 61.7 ± 0.0761.8 ± 0.190.27162.2 ± 0.0662.1 ± 0.140.44962.5 ± 0.0662.5 ± 0.120.74462.8 ± 0.0762.7 ± 0.120.73962.9 ± 0.0762.8 ± 0.110.91262.7 ± 0.0862.3 ± 0.110.004 Total vegetable 62.9 ± 0.0462.9 ± 0.130.96863.6 ± 0.0463.7 ± 0.070.09363.8 ± 0.0463.9 ± 0.070.16363.9 ± 0.0363.9 ± 0.060.74363.9 ± 0.0463.9 ± 0.060.89663.5 ± 0.0563.5 ± 0.070.601 Vegetables excluding Kimchi and pickled vegetables
62.8 ± 0.0562.5 ± 0.140.15563.3 ± 0.0463.4 ± 0.090.75463.5 ± 0.0463.6 ± 0.100.46763.6 ± 0.0463.4 ± 0.080.08763.6 ± 0.0563.5 ± 0.080.19963.3 ± 0.0562.9 ± 0.080.000 Meat, fish, eggs and beans67.3 ± 0.0967.4 ± 0.280.65767.5 ± 0.0867.7 ± 0.180.36467.2 ± 0.0767.2 ± 0.180.63666.9 ± 0.0866.5 ± 0.160.13166.7 ± 0.1066.5 ± 0.190.24466.2 ± 0.1165.6 ± 0.170.004 Milk and milk products64.0 ± 0.1464.1 ± 0.410.75863.6 ± 0.1363.4 ± 0.250.43663.1 ± 0.1062.8 ± 0.230.87063.1 ± 0.1162.6 ± 0.240.67163.1 ± 0.1362.3 ± 0.210.68062.2 ± 0.1261.6 ± 0.190.004 Moderation item % of energy from SFA66.4 ± 0.1266.0 ± 0.360.03667.3 ± 0.1167.5 ± 0.220.40968.1 ± 0.0868.1 ± 0.160.75168.8 ± 0.0769.0 ± 0.130.03169.2 ± 0.0869.1 ± 0.120.42769.5 ± 0.0569.5 ± 0.100.875 Sodium66.1 ± 0.1066.0 ± 0.290.53265.4 ± 0.0865.1 ± 0.190.90065.5 ± 0.0965.5 ± 0.190.77866.0 ± 0.0965.7 ± 0.190.81766.5 ± 0.1066.4 ± 0.170.84267.5 ± 0.0967.5 ± 0.150.901 % of energy from sweets and beverages68.4 ± 0.0968.3 ± 0.300.70068.9 ± 0.0768.9 ± 0.190.9629.0 ± 0.0669.1 ± 0.100.25769.3 ± 0.0569.1 ± 0.120.89369.5 ± 0.0569.4 ± 0.080.14369.5 ± 0.0569.4 ± 0.080.684 Balance of energy intake item % of energy from CHO62.8 ± 0.0663.0 ± 0.170.21762.9 ± 0.0563.0 ± 0.100.20062.7 ± 0.0562.8 ± 0.120.45162.4 ± 0.0560.2 ± 0.100.25761.9 ± 0.0661.6 ± 0.100.48561.4 ± 0.0661.0 ± 0.070.000 % of energy from fat63.5 ± 0.0663.6 ± 0.160.54263.8 ± 0.0563.9 ± 0.110.86663.7 ± 0.0563.6 ± 0.120.60363.3 ± 0.0663.0 ± 0.120.98562.7 ± 0.0662.3 ± 0.110.08162.2 ± 0.0761.6 ± 0.100.000 Energy intake63.0 ± 0.0662.9 ± 0.190.04263.0 ± 0.0663.2 ± 0.140.55763.3 ± 0.0563.1 ± 0.140.84863.3 ± 0.0563.2 ± 0.110.51060.3 ± 0.0663.2 ± 0.120.88863.1 ± 0.0763.1 ± 0.090.756