ABSTRACT
Purpose: The aim of this study was to investigate the impact of preoperative low body mass
index (BMI) on both the short- and long-term outcomes in patients with gastric cancer.
Materials and Methods: A total of 510 patients with gastric cancer were divided into the
following 3 groups: low BMI group (≤18.5 kg/m
2, n=51), normal BMI group (18.6–24.9 kg/m
2, n=308), and high BMI group (≥25.0 kg/m
2, n=151).
Results: There were significantly more stage III/IV patients in the low BMI group than
in the other groups (P=0.001). Severe postoperative complications were more frequent (P=0.010) and the survival was worse (P<0.001) in the low BMI group. The subgroup analysis indicated that survival was worse in the low BMI group of the stage I/II subgroup (P=0.008). The severe postoperative complication rate was higher in the low BMI group of the stage III/IV subgroup (P=0.001), although the recurrence rate and survival did not differ in the stage III/IV subgroup among all the BMI groups. Low BMI was an independent poor prognostic factor in the stage I/II subgroup (disease-free survival: hazard ratio [HR], 13.521; 95% confidence interval [CI], 1.186–154.197; P=0.036 and overall survival: HR, 5.130; 95% CI, 1.644–16.010; P=0.005), whereas low BMI was an independent risk factor for severe postoperative complications in the stage III/IV subgroup (HR, 17.158; 95% CI, 1.383–212.940; P=0.027).
Conclusions: Preoperative low BMI in patients with gastric cancer adversely affects survival
among those with stage I/II disease and increases the severe postoperative complication rate among those with stage III/IV disease.
Keywords: Stomach neoplasms; Body mass index; Obesity; Underweight
INTRODUCTION
Gastric cancer is the fourth most common cancer and the second leading cause of cancer- related death [1]. In South Korea, gastric cancer is the second most prevalent cancer, and radical gastrectomy is the treatment of choice for this disease [2-5]. Although a patient's prognosis after a gastrectomy primarily depends on the disease stage [6,7], other factors such as body mass index (BMI), and nutritional and immunological status may also play an
Original Article
Received: Mar 22, 2018 Revised: Aug 29, 2018 Accepted: Sep 5, 2018 Correspondence to Jin-Jo Kim
Department of Surgery, Incheon St. Mary's Hospital, College of Medicine, The Catholic University of Korea, 56 Dongsu-ro, Bupyeong-gu, Incheon 21431, Korea.
E-mail: [email protected]
Copyright © 2018. Korean Gastric Cancer Association
This is an Open Access article distributed under the terms of the Creative Commons Attribution Non-Commercial License (https://
creativecommons.org/licenses/by-nc/4.0) which permits unrestricted noncommercial use, distribution, and reproduction in any medium, provided the original work is properly cited.
ORCID iDs Chang Hyun Kim
https://orcid.org/0000-0003-1567-4318 Jin-Jo Kim
https://orcid.org/0000-0003-1011-8793 Author Contributions
Conceptualization: K.J.J.; Data curation: K.C.H.;
Formal analysis: K.C.H.; Investigation: K.C.H.;
Methodology: K.J.J.; Project administration:
K.C.H.; Resources: K.C.H.; Software: K.C.H.;
Supervision: P.S.M.; Validation: K.C.H.;
Visualization: K.C.H.; Writing - original draft:
K.C.H.; Writing - review & editing: K.J.J.
Conflict of Interest
No potential conflict of interest relevant to this
Chang Hyun Kim , Seung-Man Park, Jin-Jo Kim
Department of Surgery, Incheon St. Mary's Hospital, College of Medicine, The Catholic University of Korea, Incheon, Korea
The Impact of Preoperative Low Body Mass Index on Postoperative
Complications and Long-term Survival
Outcomes in Gastric Cancer Patients
BMI can reportedly be a predictor of survival in patients with several cancers including colon, endometrial, ovarian, and pancreatic [14-18]. Some studies on gastric cancer have reported a negative impact of high BMI on short-term surgical outcomes, such as an increased operative time, blood loss, complications, and anastomotic leakage [19-22]. Chen et al. [23] recently reported that low and high BMI had poor prognostic impacts in gastric cancer patients with peritoneal dissemination and who underwent palliative chemotherapy. Lee et al. [24]
reported a decreased overall mortality in patients with gastric cancer who had a high BMI at postoperative 1 year, but their baseline preoperative BMI had no prognostic impact. However, several recent studies have reported the negative impact of low BMI on the survival of patients with colorectal, lung, liver, and laryngeal cancers [25-30]. There have been only a few reports that assessed the impact of preoperative low BMI on the long-term survival outcomes of patients with gastric cancer. Therefore, we aimed to assess the impact of preoperative low BMI on the short-term surgical outcomes and long-term survival outcomes of patients with gastric cancer.
MATERIALS AND METHODS
We retrospectively collected data of 510 patients who were diagnosed with gastric cancer and who underwent a gastrectomy between January 2004 and May 2010 at the Department of Surgery, Incheon St. Mary's Hospital, College of Medicine, The Catholic University of Korea.
This study was approved by the Institutional Review Board of the Catholic University of Korea (OC15RISI0067).
Clinicopathological evaluation
The evaluated parameters included patient demographics, comorbidity, operative details, and postoperative complications. The tumor depth, nodal status, and disease stage were classified according to the 7th American Joint Committee on Cancer staging system [31].
The lymph node dissection was classified according to the Guidelines of the Japanese Gastric Cancer Association [32].
Classification of BMI groups
The patients were classified into 3 groups according to their BMI, which was based on the International Obesity Task Force recommendation in Asian-Pacific populations [33]: group A, low BMI (≤18.5 kg/m
2, n=51); group B, normal BMI (18.6–24.9 kg/m
2, n=308); and group C, high BMI (≥25.0 kg/m
2, n=151). Each group was further subclassified into stage I/II and stage III/IV subgroups, and subgroup analysis was performed.
Blood sample analysis
Peripheral blood was acquired prior to surgery at the time of the diagnosis of gastric cancer.
The serum albumin level, absolute lymphocyte count (ALC), and prognostic nutritional index (PNI) were used as the nutritional parameters. The ALC was calculated by multiplying the percentage of lymphocytes by the number of total white blood cells (WBCs). The PNI was calculated by the following formula:
10×serum albumin value (g/dL)+0.005×ALC in peripheral blood
The lymphocyte monocyte ratio (LMR) was defined as the ratio of the lymphocyte count to
Short-term surgical outcomes and long-term survival outcomes
The short-term surgical outcomes were based on the perioperative surgical outcomes such as operation time, blood loss, extent of lymph node dissection, number of harvested lymph nodes, postoperative complications, and mortality rate. The postoperative complications were graded using the Clavien-Dindo classification [34], and severe postoperative complications included the complications classified as Clavien-Dindo grade IIIb or higher. Postoperative mortality was defined as death within 30 days after surgery or in- hospital death after surgery. To determine the long-term survival outcomes, the patients received follow-ups until their death, and the date of the last follow-up, recurrence-related information, disease-free survival (DFS), death-related information, and overall survival (OS) were obtained.
Statistical analyses
All variables are expressed as the mean±standard deviation. A 1-way analysis of variance was used to evaluate the continuous variables among the 3 groups and the χ
2or Fisher's exact tests was used to evaluate the categorical variables. Multivariate logistic regression analyses were used to assess the factors associated with postoperative complications. The DFS and OS were calculated from the date of surgery. The survival adjusted for censoring was calculated using the Kaplan-Meier method, and the medians were compared using the log-rank test. The Cox proportional hazards model was used to assess the multivariate prognostic factor. A P value <0.05 was considered statistically significant.
RESULTS
Clinicopathologic characteristics
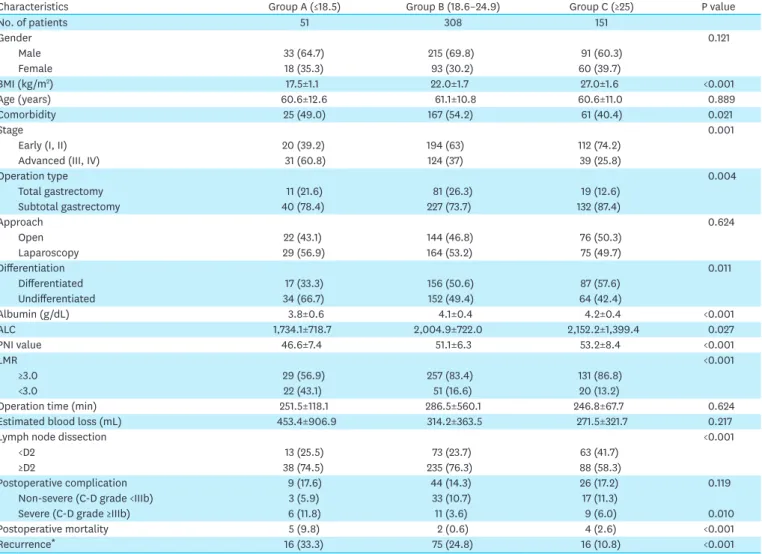
The clinicopathologic characteristics of patients in each group are shown in Table 1. Groups A, B, and C included 51 (10.0%), 308 (60.4%), and 151 (29.6%) patients, respectively.
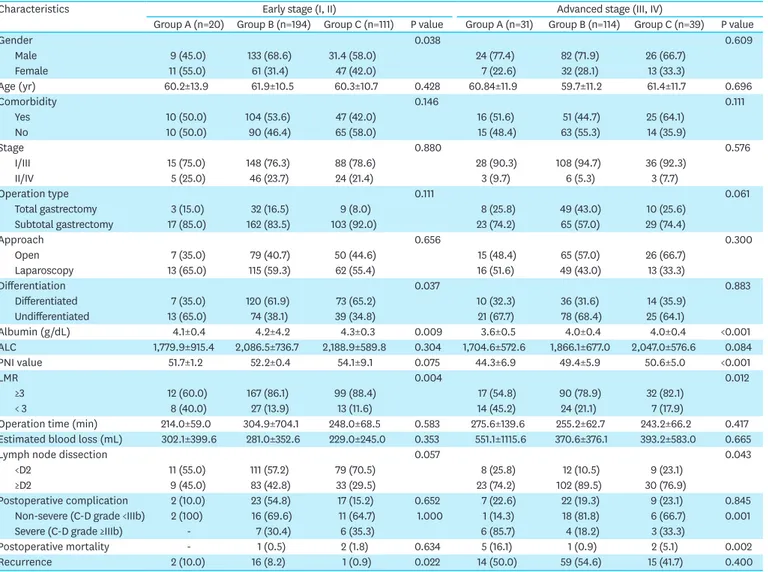
There were significantly more patients with stage III/IV gastric cancer (P=0.001) and with undifferentiated histology (P=0.011) in group A. The preoperative serum albumin level, ALC, PNI, and LMR were significantly lower in group A (P<0.001, P=0.027, P<0.001, and P<0.001, respectively). The postoperative complication rate was not significantly different among the groups, although the severe postoperative complication and mortality rates were significantly higher in group A (P=0.010 and P<0.001, respectively). Cancer recurrence was significantly more frequent in group A (P<0.001), although there were more patients with stage III/IV disease in group A (P=0.001). When the disease stage was subclassified into stage I/II and stage III/IV, the ALC and PNI were not found to differ in the stage I/II subgroup among the BMI groups, although there were more patients with low albumin levels and LMR in the stage I/II subgroup in group A (P=0.009 and P=0.004, respectively; Table 2).
The postoperative complication, severe postoperative complication, and mortality rates did
not differ in the stage I/II group among the BMI groups, although cancer recurrence was
significantly more frequent in group A (P=0.022). Nevertheless, in the stage III/IV subgroup
of group A, the albumin level, PNI, and LMR were found to be significantly lower (P<0.001,
P<0.001, and P=0.012, respectively). The severe postoperative complication and mortality
rates were significantly higher (P=0.001 and P=0.002, respectively) in the stage III/IV
subgroup of group A. The cancer recurrence rate was not significantly different in the stage
III/IV subgroup among the BMI groups (P=0.400; Table 2).
Post-operative short-term outcomes
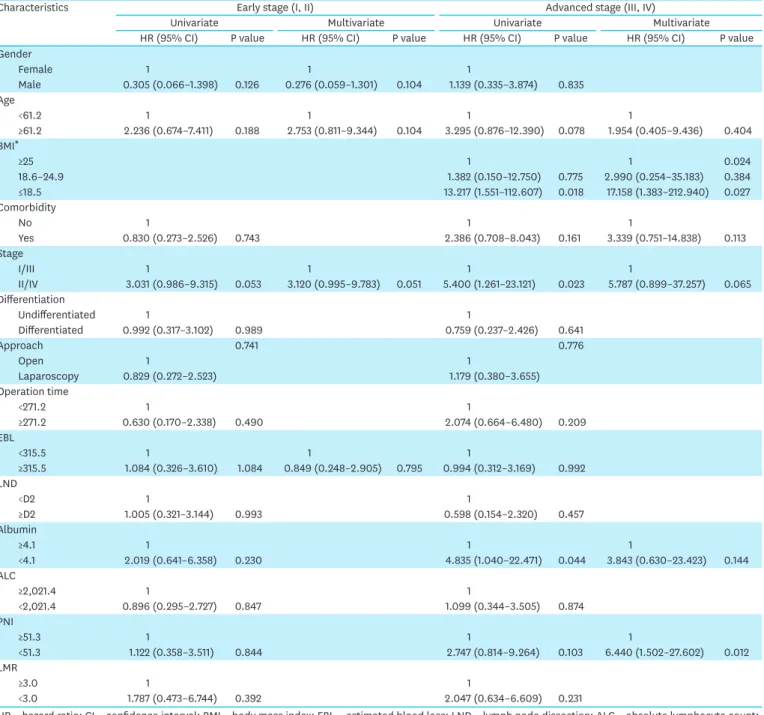
The univariate and multivariate analyses of the risk of severe postoperative complications, including mortality, in the stage I/II and stage III/IV subgroups indicated that low BMI (hazard ratio [HR], 17.158; 95% confidence interval [CI], 1.383–212.940; P=0.027) and PNI (HR, 6.440; 95% CI, 1.502–27.602; P=0.012) were the independent risk factors for severe postoperative complications in the stage III/IV subgroup (Table 3).
Post-operative long-term outcomes
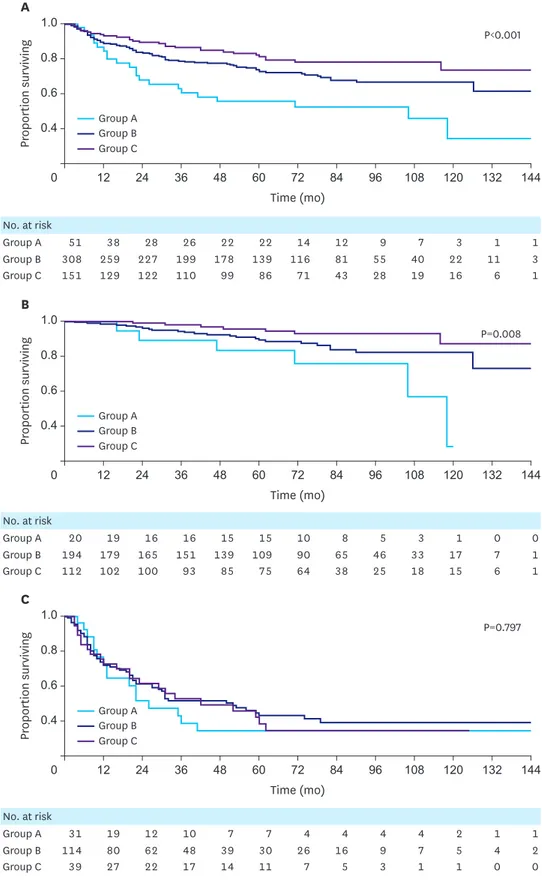
The 5-year DFS was 61.2% in group A, 74.3% in group B, and 88.3% in group C; these values were significantly different (P<0.001). In the stage I/II subgroups, the 5-year DFS of group A was worse than that of the other groups (88.5%, 99.2%, and 98.6% in groups A, B, and C, respectively; P<0.001). However, the 5-year DFS did not differ in the stage III subgroups among the BMI groups (35.1%, 41.0%, and 47.4% in groups A, B, and C, respectively;
P=0.431; Fig. 1).
Table 1. Comparison of clinicopathologic characteristics of patients according to stratified BMI (n=510)
Characteristics Group A (≤18.5) Group B (18.6–24.9) Group C (≥25) P value
No. of patients 51 308 151
Gender 0.121
Male 33 (64.7) 215 (69.8) 91 (60.3)
Female 18 (35.3) 93 (30.2) 60 (39.7)
BMI (kg/m2) 17.5±1.1 22.0±1.7 27.0±1.6 <0.001
Age (years) 60.6±12.6 61.1±10.8 60.6±11.0 0.889
Comorbidity 25 (49.0) 167 (54.2) 61 (40.4) 0.021
Stage 0.001
Early (I, II) 20 (39.2) 194 (63) 112 (74.2)
Advanced (III, IV) 31 (60.8) 124 (37) 39 (25.8)
Operation type 0.004
Total gastrectomy 11 (21.6) 81 (26.3) 19 (12.6)
Subtotal gastrectomy 40 (78.4) 227 (73.7) 132 (87.4)
Approach 0.624
Open 22 (43.1) 144 (46.8) 76 (50.3)
Laparoscopy 29 (56.9) 164 (53.2) 75 (49.7)
Differentiation 0.011
Differentiated 17 (33.3) 156 (50.6) 87 (57.6)
Undifferentiated 34 (66.7) 152 (49.4) 64 (42.4)
Albumin (g/dL) 3.8±0.6 4.1±0.4 4.2±0.4 <0.001
ALC 1,734.1±718.7 2,004.9±722.0 2,152.2±1,399.4 0.027
PNI value 46.6±7.4 51.1±6.3 53.2±8.4 <0.001
LMR <0.001
≥3.0 29 (56.9) 257 (83.4) 131 (86.8)
<3.0 22 (43.1) 51 (16.6) 20 (13.2)
Operation time (min) 251.5±118.1 286.5±560.1 246.8±67.7 0.624
Estimated blood loss (mL) 453.4±906.9 314.2±363.5 271.5±321.7 0.217
Lymph node dissection <0.001
<D2 13 (25.5) 73 (23.7) 63 (41.7)
≥D2 38 (74.5) 235 (76.3) 88 (58.3)
Postoperative complication 9 (17.6) 44 (14.3) 26 (17.2) 0.119
Non-severe (C-D grade <IIIb) 3 (5.9) 33 (10.7) 17 (11.3)
Severe (C-D grade ≥IIIb) 6 (11.8) 11 (3.6) 9 (6.0) 0.010
Postoperative mortality 5 (9.8) 2 (0.6) 4 (2.6) <0.001
Recurrence* 16 (33.3) 75 (24.8) 16 (10.8) <0.001
Values are presented as mean±standard deviation, and number (%).
BMI = body mass index; ALC = absolute lymphocyte count; PNI = prognostic nutritional index; LMR = lymphocyte to monocyte ratio; C-D = Clavien-Dindo classification.
*Three cases in group A, 6 cases in group B, and 3 cases in group C were excluded because the stage was IV.
The 5-year OS was 55.5% in group A, 72.4% in group B, and 81.0% in group C; these values were significantly different (P<0.001). In the stage I/II subgroups, the 5-year OS of group A was worse than that of the other groups (83.3%, 89.3%, and 95.7% in groups A, B, and C, respectively; P=0.008). However, the 5-year OS did not differ in the stage III/IV subgroups among the BMI groups (34.5%, 42.6%, and 38.5% in groups A, B, and C, respectively;
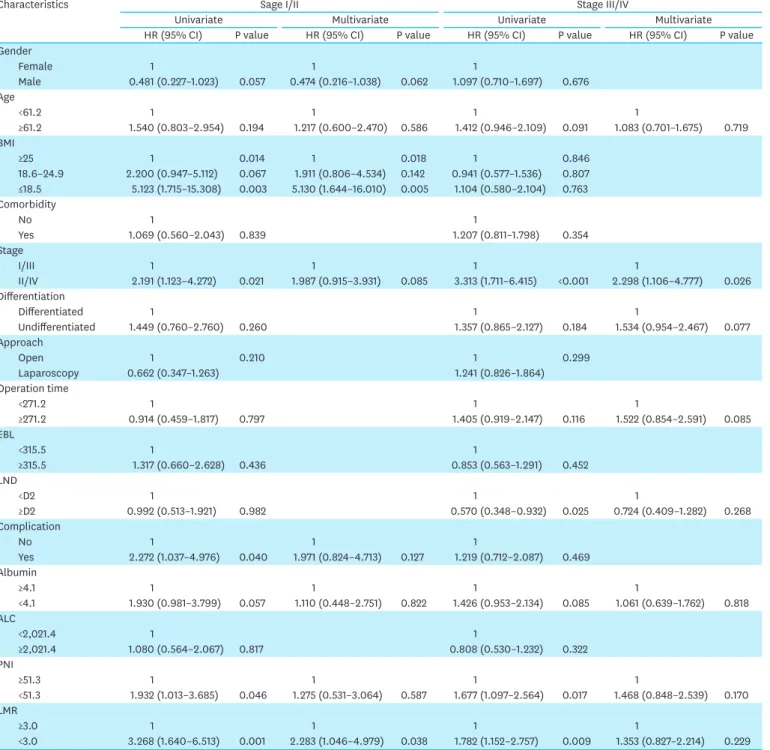
P=0.797; Fig. 2). The Cox proportional hazards model for OS indicated that advanced stage (HR, 6.048; 95% CI, 3.969–9.216; P<0.001), undifferentiated histology (HR, 1.497; 95%
CI, 1.018–2.201; P=0.040), and low LMR (HR, 1.666; 95% CI, 1.100–2.522; P=0.016) were independent poor prognostic factors in the overall patients. In the stage I/II subgroup, low BMI (HR, 5.130; 95% CI, 1.644–16.010; P=0.005) and low LMR (HR, 2.283; 95% CI, 1.046–
4.979; P=0.038) were independent poor prognostic factors. In the stage III/IV subgroup, disease stage (HR, 2.298; 95% CI, 1.106–4.777; P=0.026) was the only independent poor prognostic factor (Table 4).
Table 2. Comparison of clinicopathologic characteristics of patients according to stratified BMI in gastric cancer patients with early stage (I, II; n=326) and advanced stage (III, IV; n=184) disease
Characteristics Early stage (I, II) Advanced stage (III, IV)
Group A (n=20) Group B (n=194) Group C (n=111) P value Group A (n=31) Group B (n=114) Group C (n=39) P value
Gender 0.038 0.609
Male 9 (45.0) 133 (68.6) 31.4 (58.0) 24 (77.4) 82 (71.9) 26 (66.7)
Female 11 (55.0) 61 (31.4) 47 (42.0) 7 (22.6) 32 (28.1) 13 (33.3)
Age (yr) 60.2±13.9 61.9±10.5 60.3±10.7 0.428 60.84±11.9 59.7±11.2 61.4±11.7 0.696
Comorbidity 0.146 0.111
Yes 10 (50.0) 104 (53.6) 47 (42.0) 16 (51.6) 51 (44.7) 25 (64.1)
No 10 (50.0) 90 (46.4) 65 (58.0) 15 (48.4) 63 (55.3) 14 (35.9)
Stage 0.880 0.576
I/III 15 (75.0) 148 (76.3) 88 (78.6) 28 (90.3) 108 (94.7) 36 (92.3)
II/IV 5 (25.0) 46 (23.7) 24 (21.4) 3 (9.7) 6 (5.3) 3 (7.7)
Operation type 0.111 0.061
Total gastrectomy 3 (15.0) 32 (16.5) 9 (8.0) 8 (25.8) 49 (43.0) 10 (25.6)
Subtotal gastrectomy 17 (85.0) 162 (83.5) 103 (92.0) 23 (74.2) 65 (57.0) 29 (74.4)
Approach 0.656 0.300
Open 7 (35.0) 79 (40.7) 50 (44.6) 15 (48.4) 65 (57.0) 26 (66.7)
Laparoscopy 13 (65.0) 115 (59.3) 62 (55.4) 16 (51.6) 49 (43.0) 13 (33.3)
Differentiation 0.037 0.883
Differentiated 7 (35.0) 120 (61.9) 73 (65.2) 10 (32.3) 36 (31.6) 14 (35.9)
Undifferentiated 13 (65.0) 74 (38.1) 39 (34.8) 21 (67.7) 78 (68.4) 25 (64.1)
Albumin (g/dL) 4.1±0.4 4.2±4.2 4.3±0.3 0.009 3.6±0.5 4.0±0.4 4.0±0.4 <0.001
ALC 1,779.9±915.4 2,086.5±736.7 2,188.9±589.8 0.304 1,704.6±572.6 1,866.1±677.0 2,047.0±576.6 0.084
PNI value 51.7±1.2 52.2±0.4 54.1±9.1 0.075 44.3±6.9 49.4±5.9 50.6±5.0 <0.001
LMR 0.004 0.012
≥3 12 (60.0) 167 (86.1) 99 (88.4) 17 (54.8) 90 (78.9) 32 (82.1)
< 3 8 (40.0) 27 (13.9) 13 (11.6) 14 (45.2) 24 (21.1) 7 (17.9)
Operation time (min) 214.0±59.0 304.9±704.1 248.0±68.5 0.583 275.6±139.6 255.2±62.7 243.2±66.2 0.417 Estimated blood loss (mL) 302.1±399.6 281.0±352.6 229.0±245.0 0.353 551.1±1115.6 370.6±376.1 393.2±583.0 0.665
Lymph node dissection 0.057 0.043
<D2 11 (55.0) 111 (57.2) 79 (70.5) 8 (25.8) 12 (10.5) 9 (23.1)
≥D2 9 (45.0) 83 (42.8) 33 (29.5) 23 (74.2) 102 (89.5) 30 (76.9)
Postoperative complication 2 (10.0) 23 (54.8) 17 (15.2) 0.652 7 (22.6) 22 (19.3) 9 (23.1) 0.845
Non-severe (C-D grade <IIIb) 2 (100) 16 (69.6) 11 (64.7) 1.000 1 (14.3) 18 (81.8) 6 (66.7) 0.001
Severe (C-D grade ≥IIIb) - 7 (30.4) 6 (35.3) 6 (85.7) 4 (18.2) 3 (33.3)
Postoperative mortality - 1 (0.5) 2 (1.8) 0.634 5 (16.1) 1 (0.9) 2 (5.1) 0.002
Recurrence 2 (10.0) 16 (8.2) 1 (0.9) 0.022 14 (50.0) 59 (54.6) 15 (41.7) 0.400
Values are presented as mean±standard deviation, and number (%).
ALC = absolute lymphocyte count; PNI = prognostic nutritional index; LMR = lymphocyte monocyte ratio; C-D = Clavien-Dindo classification.
Table 3. Risk factors for severe postoperative (Clavien-Dindo grade IIIb or higher) complications
Characteristics Early stage (I, II) Advanced stage (III, IV)
Univariate Multivariate Univariate Multivariate
HR (95% CI) P value HR (95% CI) P value HR (95% CI) P value HR (95% CI) P value
Gender
Female 1 1 1
Male 0.305 (0.066–1.398) 0.126 0.276 (0.059–1.301) 0.104 1.139 (0.335–3.874) 0.835 Age
<61.2 1 1 1 1
≥61.2 2.236 (0.674–7.411) 0.188 2.753 (0.811–9.344) 0.104 3.295 (0.876–12.390) 0.078 1.954 (0.405–9.436) 0.404 BMI*
≥25 1 1 0.024
18.6–24.9 1.382 (0.150–12.750) 0.775 2.990 (0.254–35.183) 0.384
≤18.5 13.217 (1.551–112.607) 0.018 17.158 (1.383–212.940) 0.027
Comorbidity
No 1 1 1
Yes 0.830 (0.273–2.526) 0.743 2.386 (0.708–8.043) 0.161 3.339 (0.751–14.838) 0.113
Stage
I/III 1 1 1 1
II/IV 3.031 (0.986–9.315) 0.053 3.120 (0.995–9.783) 0.051 5.400 (1.261–23.121) 0.023 5.787 (0.899–37.257) 0.065 Differentiation
Undifferentiated 1 1
Differentiated 0.992 (0.317–3.102) 0.989 0.759 (0.237–2.426) 0.641
Approach 0.741 0.776
Open 1 1
Laparoscopy 0.829 (0.272–2.523) 1.179 (0.380–3.655)
Operation time
<271.2 1 1
≥271.2 0.630 (0.170–2.338) 0.490 2.074 (0.664–6.480) 0.209
EBL
<315.5 1 1 1
≥315.5 1.084 (0.326–3.610) 1.084 0.849 (0.248–2.905) 0.795 0.994 (0.312–3.169) 0.992 LND
<D2 1 1
≥D2 1.005 (0.321–3.144) 0.993 0.598 (0.154–2.320) 0.457
Albumin
≥4.1 1 1 1
<4.1 2.019 (0.641–6.358) 0.230 4.835 (1.040–22.471) 0.044 3.843 (0.630–23.423) 0.144
ALC
≥2,021.4 1 1
<2,021.4 0.896 (0.295–2.727) 0.847 1.099 (0.344–3.505) 0.874
PNI
≥51.3 1 1 1
<51.3 1.122 (0.358–3.511) 0.844 2.747 (0.814–9.264) 0.103 6.440 (1.502–27.602) 0.012
LMR
≥3.0 1 1
<3.0 1.787 (0.473–6.744) 0.392 2.047 (0.634–6.609) 0.231
HR = hazard ratio; CI = confidence interval; BMI = body mass index; EBL = estimated blood loss; LND = lymph node dissection; ALC = absolute lymphocyte count;
PNI = prognostic nutritional index; LMR = lymphocyte to monocyte ratio.
*There were no severe postoperative complications in all BMI groups with early stage disease (I, II).
No. at risk
Group A 51 34 25 24 22 20 14 12 8 5 3 1 1
Group B 308 240 208 188 171 134 111 79 51 39 22 11 3
Group C 151 127 119 107 97 82 69 42 27 18 15 6 1
No. at risk
Group A 20 19 16 16 15 15 10 8 5 2 1 0 0
Group B 194 174 159 147 136 106 88 65 44 32 17 7 1
Group C 112 102 100 92 84 73 63 38 25 18 15 6 1
No. at risk
Group A 31 15 9 8 7 5 4 4 3 3 2 1 1
Group B 114 66 49 41 35 28 23 14 7 7 5 4 2
Group C 39 25 19 15 13 9 6 4 2 0 0 0 0
Group A Group B Group C
Time (mo) 0.6
0 48 120
Proportion surviving
1.0
0.8
24 72 84 96 108
A
P<0.001
0.4 12 36 60 132 144
Group A Group B Group C
Time (mo) 0.6
0 48 120
Proportion surviving
1.0
0.8
24 72 84 96 108
B
P<0.001 0.9
0.7
0.5 12 36 60 132 144
Group A Group B Group C
Time (mo)
0 48 120
Proportion surviving
1.0
0.6
24 72 84 96 108
C
P=0.431 0.8
0.4
132 144
60
12 36
Group A Group B Group C
Time (mo) 0.6
0 48 120
Proportion surviving
1.0
0.8
24 72 84 96 108
A
P<0.001
0.4 12 36 60 132 144
Group A Group B Group C
Time (mo) 0.6
0 48 120
Proportion surviving
1.0
0.8
24 72 84 96 108
B
P<0.001 0.9
0.7
0.5 12 36 60 132 144
Group A Group B Group C
Time (mo)
0 48 120
Proportion surviving
1.0
0.6
24 72 84 96 108
C
P=0.431 0.8
0.4
132 144
60
12 36
Fig. 1. Kaplan-Meier DFS curves for gastric cancer patients, stratified by the BMI groups. (A) DFS in all patients, (B) DFS in stage I and II patients, and (C) DFS in stage III patients.
DFS = disease-free survival; BMI = body mass index.
No. at risk
Group A 51 38 28 26 22 22 14 12 9 7 3 1 1
Group B 308 259 227 199 178 139 116 81 55 40 22 11 3
Group C 151 129 122 110 99 86 71 43 28 19 16 6 1
No. at risk
Group A 20 19 16 16 15 15 10 8 5 3 1 0 0
Group B 194 179 165 151 139 109 90 65 46 33 17 7 1
Group C 112 102 100 93 85 75 64 38 25 18 15 6 1
No. at risk
Group A 31 19 12 10 7 7 4 4 4 4 2 1 1
Group B 114 80 62 48 39 30 26 16 9 7 5 4 2
Group C 39 27 22 17 14 11 7 5 3 1 1 0 0
Group A Group B Group C
Time (mo) 0.6
0 48 120
Proportion surviving
1.0
0.8
24 72 84 96 108
A
P<0.001
0.4
132 144
60
12 36
Group A Group B Group C
Time (mo)
0 48 120
Proportion surviving
1.0
0.6
24 72 84 96 108
B
P=0.008 0.8
0.4
132 144
60
12 36
Group A Group B Group C
Time (mo)
0 48 120
Proportion surviving
1.0
0.6
24 72 84 96 108
C
P=0.797 0.8
0.4
132 144
60
12 36
Group A Group B Group C
Time (mo) 0.6
0 48 120
Proportion surviving
1.0
0.8
24 72 84 96 108
A
P<0.001
0.4
132 144
60
12 36
Group A Group B Group C
Time (mo)
0 48 120
Proportion surviving
1.0
0.6
24 72 84 96 108
B
P=0.008 0.8
0.4
132 144
60
12 36
Group A Group B Group C
Time (mo)
0 48 120
Proportion surviving
1.0
0.6
24 72 84 96 108
C
P=0.797 0.8
0.4
132 144
60
12 36
Fig. 2. Kaplan-Meier OS curves for gastric cancer patients, stratified by the BMI groups. (A) OS in all patients, (B) OS in stage I and II patients, and (C) OS in stage III and IV patients.
OS = overall survival; BMI = body mass index.
DISCUSSION
We retrospectively investigated the impact of preoperative low BMI on the short-term surgical outcomes and long-term oncological outcomes of 510 patients with gastric cancer. The 5-year OS in the low BMI group was significantly worse compared to the normal and high BMI group.
Table 4. Univariate and multivariate analyses of factors affecting overall survival according to the stratified stage
Characteristics Sage I/II Stage III/IV
Univariate Multivariate Univariate Multivariate
HR (95% CI) P value HR (95% CI) P value HR (95% CI) P value HR (95% CI) P value
Gender
Female 1 1 1
Male 0.481 (0.227–1.023) 0.057 0.474 (0.216–1.038) 0.062 1.097 (0.710–1.697) 0.676 Age
<61.2 1 1 1 1
≥61.2 1.540 (0.803–2.954) 0.194 1.217 (0.600–2.470) 0.586 1.412 (0.946–2.109) 0.091 1.083 (0.701–1.675) 0.719 BMI
≥25 1 0.014 1 0.018 1 0.846
18.6–24.9 2.200 (0.947–5.112) 0.067 1.911 (0.806–4.534) 0.142 0.941 (0.577–1.536) 0.807
≤18.5 5.123 (1.715–15.308) 0.003 5.130 (1.644–16.010) 0.005 1.104 (0.580–2.104) 0.763 Comorbidity
No 1 1
Yes 1.069 (0.560–2.043) 0.839 1.207 (0.811–1.798) 0.354
Stage
I/III 1 1 1 1
II/IV 2.191 (1.123–4.272) 0.021 1.987 (0.915–3.931) 0.085 3.313 (1.711–6.415) <0.001 2.298 (1.106–4.777) 0.026 Differentiation
Differentiated 1 1 1
Undifferentiated 1.449 (0.760–2.760) 0.260 1.357 (0.865–2.127) 0.184 1.534 (0.954–2.467) 0.077
Approach
Open 1 0.210 1 0.299
Laparoscopy 0.662 (0.347–1.263) 1.241 (0.826–1.864)
Operation time
<271.2 1 1 1
≥271.2 0.914 (0.459–1.817) 0.797 1.405 (0.919–2.147) 0.116 1.522 (0.854–2.591) 0.085
EBL
<315.5 1 1
≥315.5 1.317 (0.660–2.628) 0.436 0.853 (0.563–1.291) 0.452
LND
<D2 1 1 1
≥D2 0.992 (0.513–1.921) 0.982 0.570 (0.348–0.932) 0.025 0.724 (0.409–1.282) 0.268
Complication
No 1 1 1
Yes 2.272 (1.037–4.976) 0.040 1.971 (0.824–4.713) 0.127 1.219 (0.712–2.087) 0.469 Albumin
≥4.1 1 1 1 1
<4.1 1.930 (0.981–3.799) 0.057 1.110 (0.448–2.751) 0.822 1.426 (0.953–2.134) 0.085 1.061 (0.639–1.762) 0.818 ALC
<2,021.4 1 1
≥2,021.4 1.080 (0.564–2.067) 0.817 0.808 (0.530–1.232) 0.322
PNI
≥51.3 1 1 1 1
<51.3 1.932 (1.013–3.685) 0.046 1.275 (0.531–3.064) 0.587 1.677 (1.097–2.564) 0.017 1.468 (0.848–2.539) 0.170 LMR
≥3.0 1 1 1 1
<3.0 3.268 (1.640–6.513) 0.001 2.283 (1.046–4.979) 0.038 1.782 (1.152–2.757) 0.009 1.353 (0.827–2.214) 0.229 HR = hazard ratio; CI = confidence interval; BMI = body mass index; EBL = estimated blood loss; LND = lymph node dissection; ALC = absolute lymphocyte count;
PNI = prognostic nutritional index; LMR = lymphocyte monocyte ratio.
group was significantly higher than that in the other BMI groups. However, when the patients were subclassified into stage I/II and stage III/IV subgroups, the 5-year OS in the low BMI group was significantly worse in only the stage I/II subgroup and not in the stage III/IV subgroup. In the Cox proportional hazards model for OS, low BMI was found to be an independent poor prognostic factor in only the stage I/II subgroup and not in the stage III/IV subgroup or the whole patient group. This indicates that the worse survival in the low BMI group among all the patients was primarily attributable to the worse survival in the stage I/II subgroup of the low BMI group. In fact, this is a unique finding in our study as compared to the findings of other recent studies that assessed the prognostic impact of low BMI in patients with gastric cancer [10,35,36]. Ejaz et al. [10] reported that the OS in low BMI patients was worse only when it was accompanied by low serum albumin levels. Wada et al. [35] reported that low BMI was an independent poor prognostic factor for OS and disease-specific survival. Migita et al. [36]
reported that low BMI was an independent predictor of poor OS in only stage I disease, but it was associated with a higher rate of non-cancer-related death. In the present study, low BMI was associated with poor survival in only the stage I/II subgroup, and it was associated with a higher severe postoperative complication rate in only the stage III/IV subgroup. Unlike the results reported by Migita et al., the poor survival of the patients with low BMI and stage I/II disease in our study did not result from non-cancer-related death but mainly from cancer recurrence.
A low nutritional status among cancer patients is reportedly associated with a poor prognosis [37,38]. This observation appeared to be true in the stage I/II subgroup of our study, as there were significantly more patients with a low LMR in the low BMI group than in the high BMI group of the stage I/II subgroup. This finding may be linked to the depressive effect of protein-calorie malnutrition during cell-mediated antitumor immunity [39,40]. Low LMR and low BMI were independent poor prognostic factors of OS.
Previous studies suggested that LMR is a surrogate marker for the ratio of tumor-infiltrating lymphocytes (TILs) and tumor-associated macrophages (TMAs), which are important immune cells. TILs are thought to be responsible for cellular and humoral antitumor responses that contribute to tumor control. TMAs accelerate tumor progression through the production of growth factors and cytokines that subsequently lead to angiogenesis and anti-immune responses [13]. A recent study showed that LMR was an independent prognostic factor in gastric cancer patients, as in the present study [11]. However, low LMR was an independent poor prognostic factor in the stage I/II subgroup but not in the stage III/
IV subgroup in the present study. Therefore, the poor prognostic impact of low BMI might disappear in the stage III/IV subgroup. Instead, low BMI was an independent risk factor for severe postoperative complications, including mortality, in the stage III/IV subgroup. The number of patients with a low LMR was not significantly different in the stage III/IV group compared to the other BMI groups. We postulate that the poor prognostic impact of low BMI is only applicable when the tumor burden is relatively small, as in the stage I/II subgroup in the present study. With an increase in the tumor burden, as in the stage III/IV subgroup of our study, the poor prognostic impact of low BMI cannot be applied. In contrast, the PNI in the stage III/IV subgroup of the low BMI group was significantly lower than in the stage III/
IV subgroup of the normal and high BMI groups, unlike that noted in the stage I/II subgroup.
Moreover, PNI was an independent prognostic factor for severe postoperative complications
in the stage III/IV subgroup but not in the stage I/II subgroup. PNI serves as a factor that
increases the surgical risk of patients, because the PNI was originally devised by Onodera et
al. to assess the preoperative nutritional condition and to predict the surgical risk for patients
Our findings emphasize the importance of several immunological and nutritional indices including LMR and PNI, which can be easily calculated from routine laboratory examinations, in the perioperative management of patients with gastric cancer. If a patient with a low BMI has an LMR value <3 and a tumor of not more than stage II, including early gastric cancer, a more intensive follow-up program and adjuvant treatment plan, which are used in the treatment of advanced gastric cancer, are needed for the early detection and the prevention of recurrence. If a patient with a low BMI has a low PNI value and a tumor of more than stage II, more intensive nutritional support is needed during the pre-and postoperative management to prevent severe postoperative complications.
The present study has certain limitations. First, this was a relatively small-sized retrospective study, and the number of patients in the low BMI group was less than that in the normal and high BMI groups. Hence, there is a possibility of some selection bias. Second, the surgical mortality rate (9.8%) in the low BMI group was relatively higher than that in other gastrectomy series, although the surgical mortality rate of the entire patient group was 2.1%
(11/510), which was not different from other gastrectomy series [41-43]. Third, we may have neglected the effect of obesity (BMI ≥30 kg/m
2) on the outcomes, because we considered this group to be a part of the high BMI group; there were only 8 obese patients (1.6%) in the present study, which is negligible. Nevertheless, more large-scale studies are needed to draw more conclusive results regarding the impact of low BMI on the outcomes of patients with gastric cancer. Finally, we did not investigate the difference between pre-operative and postoperative nutritional status and BMI, which may give an additional effect on the prognosis by poor nutrition-related repressed tumor-immunity.
In conclusion, preoperative low BMI in patients with gastric cancer adversely affects survival among those with stage I/II disease and increases the severe postoperative complication rate among those with stage III/IV disease. More consideration should be given to adjuvant treatment and follow-up programs in stage I/II disease for the prevention or early detection of recurrence and to preoperative preparation in stage III/IV disease to prevent severe postoperative complications when a gastric cancer patient with low BMI is treated.
REFERENCES
1. Crew KD, Neugut AI. Epidemiology of gastric cancer. World J Gastroenterol 2006;12:354-362.
PUBMED | CROSSREF
2. An JY, Cheong JH, Hyung WJ, Noh SH. Recent evolution of surgical treatment for gastric cancer in Korea.
J Gastric Cancer 2011;11:1-6.
PUBMED | CROSSREF
3. Jung KW, Won YJ, Kong HJ, Oh CM, Cho H, Lee DH, et al. Cancer statistics in Korea: incidence, mortality, survival, and prevalence in 2012. Cancer Res Treat 2015;47:127-141.
PUBMED | CROSSREF
4. Kim JP. Current status of surgical treatment of gastric cancer. J Surg Oncol 2002;79:79-80.
PUBMED | CROSSREF
5. Jeong O, Park YK. Clinicopathological features and surgical treatment of gastric cancer in South Korea:
the results of 2009 nationwide survey on surgically treated gastric cancer patients. J Gastric Cancer 2011;11:69-77.
PUBMED | CROSSREF
6. Nashimoto A, Akazawa K, Isobe Y, Miyashiro I, Katai H, Kodera Y, et al. Gastric cancer treated in 2002 in Japan: 2009 annual report of the JGCA nationwide registry. Gastric Cancer 2013;16:1-27.
PUBMED | CROSSREF
7. van de Velde CJ. Randomized clinical trial comparing survival after D1 or D2 gastrectomy for gastric cancer (Br J Surg 2014; 101: 23–31). Br J Surg 2014;101:31-32.
PUBMED | CROSSREF
8. Lin YS, Huang KH, Lan YT, Fang WL, Chen JH, Lo SS, et al. Impact of body mass index on postoperative outcome of advanced gastric cancer after curative surgery. J Gastrointest Surg 2013;17:1382-1391.
PUBMED | CROSSREF
9. Liu BZ, Tao L, Chen YZ, Li XZ, Dong YL, Ma YJ, et al. Preoperative body mass index, blood albumin and triglycerides predict survival for patients with gastric cancer. PLoS One 2016;11:e0157401.
PUBMED | CROSSREF
10. Ejaz A, Spolverato G, Kim Y, Poultsides GA, Fields RC, Bloomston M, et al. Impact of body mass index on perioperative outcomes and survival after resection for gastric cancer. J Surg Res 2015;195:74-82.
PUBMED | CROSSREF
11. Hsu JT, Wang CC, Le PH, Chen TH, Kuo CJ, Lin CJ, et al. Lymphocyte-to-monocyte ratios predict gastric cancer surgical outcomes. J Surg Res 2016;202:284-290.
PUBMED | CROSSREF
12. Kanda M, Mizuno A, Tanaka C, Kobayashi D, Fujiwara M, Iwata N, et al. Nutritional predictors for postoperative short-term and long-term outcomes of patients with gastric cancer. Medicine (Baltimore) 2016;95:e3781.
PUBMED | CROSSREF
13. Nishijima TF, Muss HB, Shachar SS, Tamura K, Takamatsu Y. Prognostic value of lymphocyte-to- monocyte ratio in patients with solid tumors: a systematic review and meta-analysis. Cancer Treat Rev 2015;41:971-978.
PUBMED | CROSSREF
14. Santoso JT, Barton G, Riedley-Malone S, Wan JY. Obesity and perioperative outcomes in endometrial cancer surgery. Arch Gynecol Obstet 2012;285:1139-1144.
PUBMED | CROSSREF
15. Makino T, Shukla PJ, Rubino F, Milsom JW. The impact of obesity on perioperative outcomes after laparoscopic colorectal resection. Ann Surg 2012;255:228-236.
PUBMED | CROSSREF
16. Balentine CJ, Wilks J, Robinson C, Marshall C, Anaya D, Albo D, et al. Obesity increases wound complications in rectal cancer surgery. J Surg Res 2010;163:35-39.
PUBMED | CROSSREF
17. Backes FJ, Nagel CI, Bussewitz E, Donner J, Hade E, Salani R. The impact of body weight on ovarian cancer outcomes. Int J Gynecol Cancer 2011;21:1601-1605.
PUBMED | CROSSREF
18. Tsai S, Choti MA, Assumpcao L, Cameron JL, Gleisner AL, Herman JM, et al. Impact of obesity on perioperative outcomes and survival following pancreaticoduodenectomy for pancreatic cancer: a large single-institution study. J Gastrointest Surg 2010;14:1143-1150.
PUBMED | CROSSREF
19. Nobuoka D, Gotohda N, Kato Y, Takahashi S, Konishi M, Kinoshita T. Influence of excess body weight on the surgical outcomes of total gastrectomy. Surg Today 2011;41:928-934.
PUBMED | CROSSREF
20. Kodera Y, Ito S, Yamamura Y, Mochizuki Y, Fujiwara M, Hibi K, et al. Obesity and outcome of distal gastrectomy with D2 lymphadenectomy for carcinoma. Hepatogastroenterology 2004;51:1225-1228.
PUBMED
21. Inagawa S, Adachi S, Oda T, Kawamoto T, Koike N, Fukao K. Effect of fat volume on postoperative complications and survival rate after D2 dissection for gastric cancer. Gastric Cancer 2000;3:141-144.
PUBMED | CROSSREF
22. Kim MG, Yook JH, Kim KC, Kim TH, Kim HS, Kim BS, et al. Influence of obesity on early surgical outcomes of laparoscopic-assisted gastrectomy in gastric cancer. Surg Laparosc Endosc Percutan Tech 2011;21:151-154.
PUBMED | CROSSREF
23. Chen S, Nie RC, OuYang LY, Li YF, Xiang J, Zhou ZW, et al. Body mass index (BMI) may be a prognostic factor for gastric cancer with peritoneal dissemination. World J Surg Oncol 2017;15:52.
PUBMED | CROSSREF
24. Lee HH, Park JM, Song KY, Choi MG, Park CH. Survival impact of postoperative body mass index in gastric cancer patients undergoing gastrectomy. Eur J Cancer 2016;52:129-137.
PUBMED | CROSSREF
25. Balakrishnan VS. Low BMI linked to worse colorectal cancer outcomes. Lancet Oncol 2015;16:e593.
26. Renfro LA, Loupakis F, Adams RA, Seymour MT, Heinemann V, Schmoll HJ, et al. Body mass index is prognostic in metastatic colorectal cancer: pooled analysis of patients from first-line clinical trials in the ARCAD database. J Clin Oncol 2016;34:144-150.
PUBMED | CROSSREF
27. Shibakita M, Yoshimura H, Tachibana M, Ueda S, Nagasue N. Body mass index influences long-term outcome in patients with colorectal cancer. Hepatogastroenterology 2010;57:62-69.
PUBMED
28. Nakagawa T, Toyazaki T, Chiba N, Ueda Y, Gotoh M. Prognostic value of body mass index and change in body weight in postoperative outcomes of lung cancer surgery. Interact Cardiovasc Thorac Surg 2016;23:560-566.
PUBMED | CROSSREF
29. Li Q, Xing H, Liu D, Li H. Negative impact of low body mass index on liver cirrhosis patients with hepatocellular carcinoma. World J Surg Oncol 2015;13:294.
PUBMED | CROSSREF
30. Li ZQ, Zou L, Liu TR, Yang AK. Prognostic value of body mass index before treatment for laryngeal squamous cell carcinoma. Cancer Biol Med 2015.12:394-400.
PUBMED | CROSSREF
31. Washington K. 7th edition of the AJCC cancer staging manual: stomach. Ann Surg Oncol 2010;17:3077-3079.
PUBMED | CROSSREF
32. Sano T, Aiko T. New Japanese classifications and treatment guidelines for gastric cancer: revision concepts and major revised points. Gastric Cancer 2011;14:97-100.
PUBMED | CROSSREF
33. WHO Expert Consultation. Appropriate body-mass index for Asian populations and its implications for policy and intervention strategies. Lancet 2004;363:157-163.
PUBMED | CROSSREF
34. Dindo D, Demartines N, Clavien PA. Classification of surgical complications: a new proposal with evaluation in a cohort of 6336 patients and results of a survey. Ann Surg 2004;240:205-213.
PUBMED | CROSSREF
35. Wada T, Kunisaki C, Ono HA, Makino H, Akiyama H, Endo I. Implications of BMI for the prognosis of gastric cancer among the Japanese population. Dig Surg 2015;32:480-486.
PUBMED | CROSSREF
36. Migita K, Takayama T, Matsumoto S, Wakatsuki K, Tanaka T, Ito M, et al. Impact of being underweight on the long-term outcomes of patients with gastric cancer. Gastric Cancer 2016;19:735-743.
PUBMED | CROSSREF
37. Lien YC, Hsieh CC, Wu YC, Hsu HS, Hsu WH, Wang LS, et al. Preoperative serum albumin level is a prognostic indicator for adenocarcinoma of the gastric cardia. J Gastrointest Surg 2004;8:1041-1048.
PUBMED | CROSSREF
38. Sun K, Chen S, Xu J, Li G, He Y. The prognostic significance of the prognostic nutritional index in cancer:
a systematic review and meta-analysis. J Cancer Res Clin Oncol 2014;140:1537-1549.
PUBMED | CROSSREF
39. Lieberman MD, Reynolds J, Goldfine J, Shou J, Daly JM. Protein-calorie malnutrition inhibits antitumor response to interleukin-2 immunotherapy. Surgery 1990;108:452-458.
PUBMED
40. Ruffmann R, Schlick E, Tartaris T, Budzynski W, Chirigos MA. Protein deficiency reduces natural antitumor immunity. Cancer Detect Prev Suppl 1987;1:15-27.
PUBMED
41. Norero E, Vega EA, Diaz C, Cavada G, Ceroni M, Martínez C, et al. Improvement in postoperative mortality in elective gastrectomy for gastric cancer: Analysis of predictive factors in 1066 patients from a single centre. Eur J Surg Oncol 2017;43:1330-1336.
PUBMED | CROSSREF
42. Selby LV, Vertosick EA, Sjoberg DD, Schattner MA, Janjigian YY, Brennan MF, et al. Morbidity after total gastrectomy: analysis of 238 patients. J Am Coll Surg 2015;220:863-871.e2.
PUBMED | CROSSREF
43. Papenfuss WA, Kukar M, Oxenberg J, Attwood K, Nurkin S, Malhotra U, et al. Morbidity and mortality associated with gastrectomy for gastric cancer. Ann Surg Oncol 2014;21:3008-3014.
PUBMED | CROSSREF