Introduction
The importance of early detection of glaucoma cannot be overstated, because glaucomatous optic nerve damage is irreversible. However, clinical examinations of the optic nerve head (ONH) and retinal nerve fiber layer (RNFL) are subjective and thus prone to variability. Recent research has focused on objective methods to aid in the diagnosis of glaucoma. Imaging techniques such as confocal scanning
laser ophthalmoscopy and optical coherence tomography (OCT) give highly reproducible and quantitative results.
They are increasingly being used to complement traditional optic disc and RNFL assessments.1-3
Newly released software for confocal scanning laser ophthalmoscopy using a Heidelberg Retina Tomograph III (HRT III; Heidelberg Engineering GmbH, Heidelberg, Ger- many) offers new data analysis tools, such as the glaucoma probability score (GPS), which do not require placement of a contour line, thus decreasing inter-observer variability.
Among the GPS parameters, the horizontal and vertical RNFL curvature show the greatest difference between glau- coma and normal control eyes.4,5 As glaucoma progresses, the automatically depicted model of ONH shape undergoes specific changes, as a result of the loss of rim tissue and
녹내장에서 망막신경섬유층 곡률과 두께의 연관성
The Correlation of Retinal Nerve Fiber Layer Curvature and Thickness in Glaucoma
정경인, 박혜영, 박찬기
Kyoung In Jung, MD, PhD, Hae-Young Lopilly Park, MD, PhD, Chan Kee Park, MD, PhD
가톨릭대학교 의과대학 서울성모병원 안과
Department of Ophthalmology, Seoul St. Mary's Hospital, College of Medicine, The Catholic University of Korea, Seoul, Korea
Purpose: To analyze the relationship between retinal nerve fiber layer (RNFL) curvature using a Heidelberg Retina Tomograph III (HRI III) and the RNFL thickness profile measured by optical coherence tomography (OCT).
Methods: In total, 122 eyes with definite glaucoma, 44 eyes with suspected glaucoma, and 42 healthy eyes were enrolled in this retrospective study.
All participants underwent a comprehensive ocular examination, perimetry, confocal scanning laser ophthalmoscopy, and OCT. The RNFL curvature and RNFL thickness at each quadrant were compared among three groups. The ability to discriminate between definite and suspected glaucoma, and healthy eyes was determined based on the area under the receiver operating characteristics curves. The correlation between the RNFL curvature and RNFL thickness in four quadrants was analyzed using the Pearson correlation method.
Results: Horizontal RNFL curvature, which was more convex than vertical curvature in the normal control subjects, was substantially reduced with the progression of glaucoma. The horizontal RNFL curvature showed a positive correlation with the superior, inferior, and temporal RNFL thicknesses (p ≤ 0.001, <0.001, and 0.002; γ = 0.309, 0.327, and 0.210, respectively). In subjects with a localized RNFL defect in the inferior quadrant, the vertical curvature had a strong negative correlation with the inferior RNFL thickness (p = 0.029, γ = -0.603).
Conclusions: Compared with the vertical RNFL curvature, the horizontal RNFL curvature showed a higher diagnostic ability to discriminate between healthy and glaucomatous eyes, and a positive correlation with some RNFL thickness profiles.
Key words: Confocal scanning laser ophthalmoscopy, Optical coherence tomography, Retinal nerve fiber layer curvature, Retinal nerve fiber layer thickness
Received: 2019. 12. 7. Revised: 2019. 12. 21.
Accepted: 2019. 12. 27.
Corresponding Author: Chan Kee Park, MD, PhD
Department of Ophthalmology and Visual Science, Seoul St. Mary’s Hospital, #222 Banpo-daero, Seocho-gu, Seoul 06591, Korea Tel: +82-2-2258-6199, Fax: +82-2-599-7405
E-mail: [email protected]
the RNFL.4 The RNFL surface becomes flatter as nerve fibers are lost, and this may cause a decrease in vertical and horizontal RNFL curvatures. In one study, the vertical and horizontal RNFL curvatures were substantially reduced in the glaucoma group compared with normal controls, and the curvatures were reportedly related to the rim volume of the optic disc, which reflects the increase in thickness of the RNFL as the axons converge toward the center of the disc.5
However, to our knowledge, there is no report about the relationship between RNFL curvature and RNFL thickness in each sector. Although the RNFL curvature is decreased in advanced glaucomatous eyes with diffuse RNFL atrophy, it is uncertain whether this is true in eyes with focal RNFL defects in early glaucoma.
The objectives of this study were to evaluate the diagnos- tic accuracy of RNFL curvature measured using a HRT III in determining glaucoma and to analyze the correlation between the RNFL curvature and the RNFL thickness profile measured by OCT (Stratus OCT system version 3;
Zeiss-Humphrey Ophthalmic Systems, Dublin, CA, USA), especially in subjects with localized RNFL defects.
Materials and Methods
Patients and measurement protocols
This retrospective cross-sectional protocol was approved by the Institutional Review Board of the Catholic Univer- sity of Korea, Seoul, Korea. The study design followed the tenets of the Declaration of Helsinki for biomedical re- search. Eyes with glaucoma, eyes with suspected glaucoma, and normal control eyes meeting the eligibility criteria were consecutively enrolled from a database of patients who were examined for glaucoma between October and De- cember 2008 in the Department of Ophthalmology, Seoul St. Mary’s Hospital.
Inclusion criteria for all patients were best-corrected visual acuity of 20/40 or better, a normal open angle on go- nioscopy, refractive error of < -5 spherical diopters (D) and 2 D of cylinder, and transparent ocular medium (nuclear color or opalescence, cortical or posterior subcapsular lens opacity <1) according to the Lens Opacities Classification
system III system.6 When both eyes fulfilled the inclusion criteria, 1 eye per subject was randomly chosen for the study. Subjects with family history of glaucoma, previous intraocular surgery, diseases that may affect the peripap- illary area, or systemic disease or medication that could affect visual acuity were excluded.
Each patient underwent comprehensive ophthalmic ex- aminations, including a review of the medical history, best-corrected visual acuity test, slit-lamp biomicroscopy, intraocular pressure measurement by Goldmann applana- tion tonometry, gonioscopy, and dilated funduscopic exam- ination. Stereoscopic optic disc photography, monoscopic red-free digital fundus photography (Canon Cf-60 UW with Canon EOS D-6 CCD camera; Canon, Tokyo, Japan), OCT using a Stratus OCT version 3, and confocal scanning laser ophthalmoscopy using an HRT III were performed.
Standard automated perimetry (SAP) was performed with a Humphrey field analyzer (Carl Zeiss Meditec, Dublin, CA, USA), applying the Swedish Interactive Threshold Algorithm standard and program 24-2 test. Optical lens correction was placed before the tested eye, while the other eye was occluded with a patch. A reliable test was defined as one with <30% fixation losses and false-positive or false-negative responses. When the test results did not meet the reliability criteria, the test was repeated. SAP test results were classified as glaucomatous when at least one of the following was present in at least two consecutive exam- inations: 1) a cluster of more than three points in the pattern deviation plot, located in typical glaucomatous areas, with p < 5% and with at least one point with p < 1%, and in which none of the points was an edge point, unless located immediately above or below the nasal horizontal meridian;7 2) pattern standard deviation (PSD) of <5%; or 3) Glaucoma Hemifield Test results outside the normal limits. The visual field indices (mean deviation [MD] of PSD) from SAP were evaluated in each group. All ophthalmic examinations, two consecutive perimetry tests which were accomplished on different day, and topographic analyses were performed within 1 month from the subject’s date of enrollment.
Localized RNFL defects according to red-free RNFL photographs were determined when its width at a distance
of one disc diameter from the edge of the disc was larger than that of a major retinal vessel, it diverged in an arcuate or wedge shape, and it reached the edge of the disc.8 This included only RNFL defects clearly visible by red-free photography, irrespective of glaucomatous visual field loss.
Our protocol was set to exclude localized defects that were multiple or ambiguous.
Instrumentation
1. Confocal scanning laser ophthalmoscopy
Topographic analysis of the ONH was performed by con- focal scanning laser ophthalmoscopy using a HRT III with a diode laser (wavelength, 670 nm). The spherical equiva- lent refractive error of each eye was adjusted in the dioptric ring of the HRT. After keratometric readings were entered into the software (to correct for magnification errors), topographic images were obtained through dilated pupils with a combination of topical tropicamide 1.0% (Ocutrop- ic) and phenylephrine 2.5% (Mydfrin) and analyzed using Advanced Glaucoma Analysis 3.0 software. All scans were required to have an interscan standard deviation of less than 30 µm. The margin of the optic disc was traced manually by experienced users, while viewing the stereophoto- graphs under a stereoscopic viewer, and the inner edge of Elschnig’s ring was defined with at least a 4-point contour line. It was reviewed by the glaucoma specialist (C.K.P), who was blinded to patient identity and clinical history. The HRT III software displays several windows in which the topographic results are detailed. Among the measured GPS parameters, horizontal and vertical RNFL curvatures were evaluated in this study.
2. Optical coherence tomography
Examinations of the optic disc and RNFL were per- formed using a Stratus OCT version 3, which measured RNFL thickness by the fast RNFL thickness scan mode.
Average measurements of three sequential circular scans of 3.4-mm diameter, centered on the optic disc, were recorded.
The RNFL thickness was determined by the difference in distance between the vitreoretinal interface and a posterior
boundary based on a predefined reflectivity signal level.
Only well-focused and centered scans with signal strength of at least 7 were included. The parameters provided by the software were global mean average RNFL thickness, mean thickness in each of four quadrants, and thickness in each of the 12 clock hours. The RNFL thickness parameters evaluated in this study were those for the temporal, superi- or, nasal, and inferior quadrants.
Classification into groups
The normal controls were consecutively recruited from staff at our hospital. Healthy control eyes were defined as those having normal anterior and posterior segments, in- traocular pressure <21 mmHg, and normal optic disc and nerve fiber layer appearance, with no abnormality on SAP.
Suspected glaucoma eyes were defined as eyes with a glaucomatous ONH on stereophotographs, or a glaucoma- tous RNFL defect on red-free RNFL photographs, and nor- mal SAP. Glaucomatous changes to the ONH were one or more of the following: vertical cup-to-disc ratio >0.6; cup- to-disc asymmetry between fellow eyes >0.2; disc hem- orrhage; notching of more than 2 clock hours; or focal or diffuse atrophy of a neural area of more than 2 clock hours.
Eyes were classified as glaucomatous when a glauco- matous ONH was seen on stereophotographs, or a glau- comatous RNFL defect was identified on red-free RNFL photographs, and typical glaucomatous visual field defects were evident on two consecutive SAP, regardless of the ap- pearance of the optic disc. The eyes were classified by one glaucoma specialist (C.K.P) blinded to patient identity and clinical history.
Focal RNFL defects identified on red-free RNFL pho- tographs occurred primarily in the inferior quadrant, and the relationship between RNFL thickness in each quadrant and RNFL curvatures was not evaluated in subjects with defects in other quadrants because of limited number. Eyes in the suspected glaucoma and glaucoma groups that ex- hibited localized inferior RNFL defects according to red- free RNFL photographs were classified as the focal inferior RNFL defect group.
Statistical analyses
Statistical analyses were performed with SPSS software (ver. 17.0; SPSS, Chicago, IL, USA). Differences among groups were assessed by Student’s t-test for continuous pa- rameters and the chi-squared test for numeric parameters.
One-way analysis of variance (ANOVA) was used to ana- lyze differences among the three groups. A paired t-test was used to determine whether horizontal and vertical RNFL curvatures differed in the same subject. Area receiver oper- ating characteristic curves (AROC) were used with contin- uous categories created from the continuous stereometric variables, to determine the discriminatory capabilities between control and glaucomatous eyes (suspected glauco- ma group and glaucoma group). The correlation between RNFL curvature and RNFL thickness values in each quad- rant was evaluated using the Pearson/Spearman correlation test and by use of partial correlation controlling for variable factors. Values of p < 0.05 were deemed to indicate statisti- cal significance.
Results
Comparison of RNFL curvature and RNFL thickness
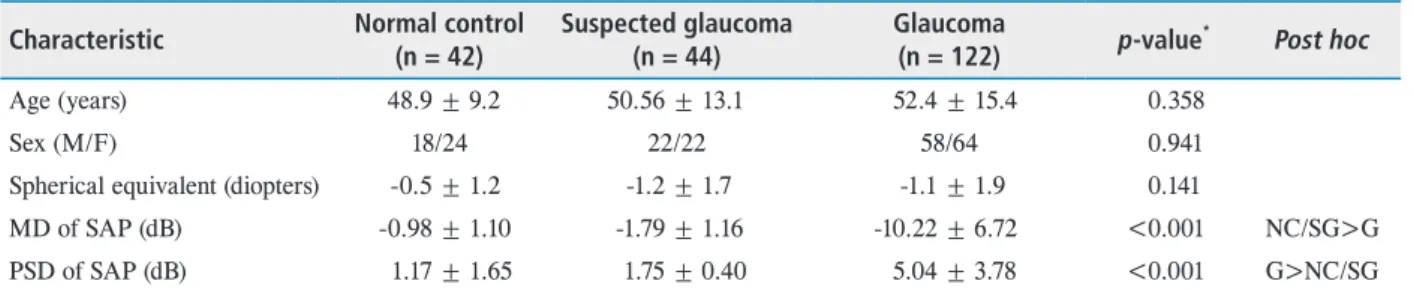
In total, 122 eyes with definite glaucoma, 44 eyes with suspected glaucoma, and 42 normal control eyes were en- rolled. The study demographics are summarized in Table 1.
Neither age (p = 0.358) nor gender (p = 0.941) differed sig- nificantly among the three groups. The average SAP MD
was -0.98 ± 1.10 dB in the normal control group, -1.79 ± 1.16 dB in the suspected glaucoma group, and -10.22 ± 6.72 dB in the glaucoma group, reflecting a moderate degree of glaucomatous damage (Table 1).
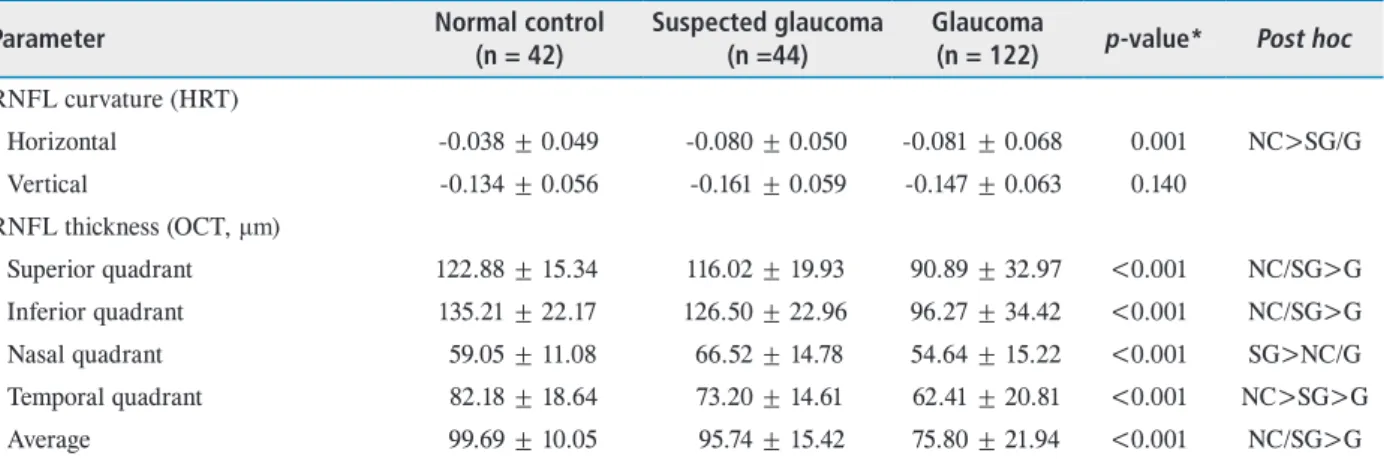
In the normal control group, the horizontal RNFL cur- vature (-0.038 ± 0.049) was more convex than the vertical RNFL curvature (-0.134 ± 0.056; p = 0.001). According to glaucoma categories, the horizontal RNFL curvature was -0.038 ± 0.049 in the normal control group, -0.080 ± 0.050 in the suspected glaucoma group, and -0.081 ± 0.068 in the glaucoma group. The horizontal RNFL curvature was low- est in eyes with glaucoma and differed significantly among the three groups (one-way ANOVA, p = 0.001; Post hoc, normal control < glaucoma suspect/glaucoma). The vertical RNFL curvature was -0.134 ± 0.056 in the normal control group, -0.161 ± 0.059 in the suspected glaucoma group, and -0.147 ± 0.063 in the glaucoma group. The vertical RNFL curvature was not significantly different among the three groups (p = 0.140). Among the OCT parameters, the superi- or, inferior, and temporal quadrant RNFLs were thinner in the glaucoma group than in the normal control or suspected glaucoma group, and the difference was statistically signifi- cant (all p ≤ 0.001; Table 2).
Correlation of RNFL curvature and rim volume
The horizontal RNFL curvatures had a weak positive correlation with rim volume in the whole group (p = 0.001, γ = 0.335) and in the group with suspected glaucoma+glau-
Table 1. Clinical characteristics of subjects in the study Characteristic Normal control
(n = 42) Suspected glaucoma
(n = 44) Glaucoma
(n = 122) p-value* Post hoc
Age (years) 48.9 ± 9.2 50.56 ± 13.1 52.4 ± 15.4 0.358
Sex (M/F) 18/24 22/22 58/64 0.941
Spherical equivalent (diopters) -0.5 ± 1.2 -1.2 ± 1.7 -1.1 ± 1.9 0.141
MD of SAP (dB) -0.98 ± 1.10 -1.79 ± 1.16 -10.22 ± 6.72 <0.001 NC/SG>G
PSD of SAP (dB) 1.17 ± 1.65 1.75 ± 0.40 5.04 ± 3.78 <0.001 G>NC/SG
Continuous variables are expressed as n or mean ± standard deviation.
M = male; F = female; MD = mean deviation; SAP = standard automated perimetry; PSD = pattern standard deviation; NC = normal control; SG = suspected glaucoma; G = glaucoma.
*Statistically significant differences between normal control, suspected glaucoma, and glaucoma groups (p < 0.05) by one-way analysis of variance for continuous variables and chi-squared test.
coma group (p = 0.001, γ = 0.307). The vertical RNFL curvatures had no significant correlation with rim volume in the whole group or suspected glaucoma+glaucoma group (Table 3).
Correlation of RNFL curvature and RNFL thickness
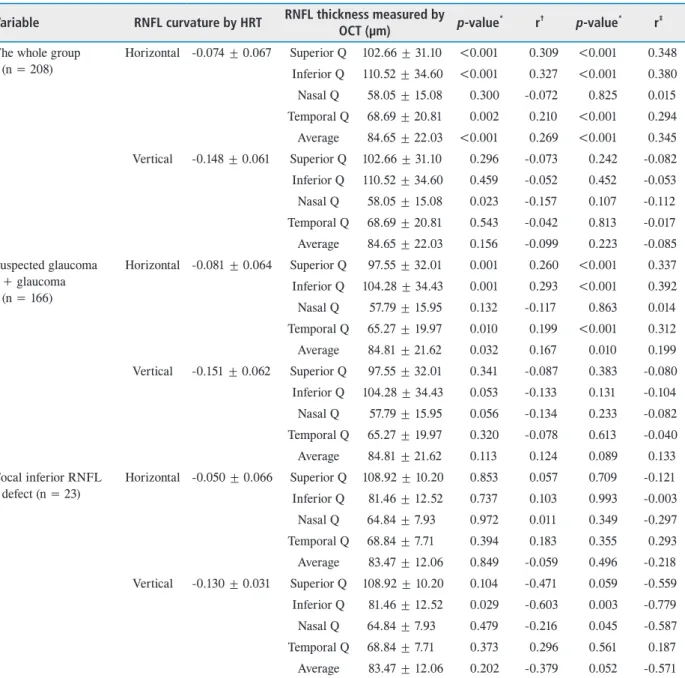
The horizontal RNFL curvature showed a positive corre- lation with the superior, inferior, and temporal RNFL thick- nesses (p ≤ 0.001, p < 0.001, p = 0.002; γ = 0.309, γ = 0.327, γ = 0.210, respectively). Similar correlations were observed in the glaucoma and suspected glaucoma groups. The ver- tical RNFL curvature had a slight negative correlation with
the inferior RNFL thickness, but this was not statistically significant (p = 0.053, γ = -0.133). In a partial correlation analysis controlling for disc size, the horizontal RNFL curvature had a significant correlation with the inferior and superior, and temporal RNFL thicknesses (p ≤ 0.001, p < 0.001, p < 0.001; γ = 0.348, γ = 0.380, γ = 0.294, re- spectively). The subgroup with the focal inferior RNFL defect showed early glaucomatous changes (MD = -4.4 ± 2.8 dB, PSD = 7.21 ± 3.8 dB). In the focal inferior RNFL de- fect group, the vertical RNFL curvature showed a strong negative correlation with the inferior RNFL thickness (p = 0.029, γ = −0.603). The horizontal RNFL curvature
Table 2. RNFL curvature measured using HRT and RNFL thickness measured using OCT in normal control, suspected glaucoma, and glaucoma groups
Parameter Normal control
(n = 42)
Suspected glaucoma (n =44)
Glaucoma
(n = 122) p-value* Post hoc RNFL curvature (HRT)
Horizontal -0.038 ± 0.049 -0.080 ± 0.050 -0.081 ± 0.068 0.001 NC>SG/G
Vertical -0.134 ± 0.056 -0.161 ± 0.059 -0.147 ± 0.063 0.140
RNFL thickness (OCT, μm)
Superior quadrant 122.88 ± 15.34 116.02 ± 19.93 90.89 ± 32.97 <0.001 NC/SG>G Inferior quadrant 135.21 ± 22.17 126.50 ± 22.96 96.27 ± 34.42 <0.001 NC/SG>G
Nasal quadrant 59.05 ± 11.08 66.52 ± 14.78 54.64 ± 15.22 <0.001 SG>NC/G
Temporal quadrant 82.18 ± 18.64 73.20 ± 14.61 62.41 ± 20.81 <0.001 NC>SG>G
Average 99.69 ± 10.05 95.74 ± 15.42 75.80 ± 21.94 <0.001 NC/SG>G
Continuous variables are expressed as mean ± standard deviation.
RNFL = retinal nerve fiber layer; HRT = Heidelberg retina tomography; OCT = optical coherence tomography; NC = normal control; SG = suspected glaucoma; G = glaucoma.
*Statistically significant differences between normal control, suspected glaucoma, and glaucoma groups (p < 0.05) by one-way ANOVA test.
Table 3. Correlation of RNFL curvature and rim volume measured using a HRT
Variable RNFL curvature Rim volume p-value* r† p-value r‡
The whole group (n = 208) Horizontal -0.074 ± 0.067 0.275 ± 0.158 0.001 0.335 0.001 0.444 Vertical -0.148 ± 0.061 0.275 ± 0.158 0.280 -0.075 0.487 -0.049 Suspected glaucoma+glaucoma (n = 166) Horizontal -0.083 ± 0.068 0.258 ± 0.164 0.001 0.307 0.001 0.432 Vertical -0.151 ± 0.062 0.258 ± 0.164 0.079 -0.137 0.182 -0.104 Focal inferior RNFL defect (n = 23) Horizontal -0.050 ± 0.066 0.227 ± 0.151 0.227 0.150 0.534 -0.200 Vertical -0.130 ± 0.031 0.227 ± 0.151 0.338 0.289 0.209 0.391 Variables are expressed as mean ± standard deviation.
RNFL = retinal nerve fiber layer; HRT = Heidelberg retina tomography.
*p-value < 0.05 is statistically significant; †r = Pearson’s correlation coefficient; ‡r = partial correlation coefficient adjusted by disc size.
was not significantly correlated with RNFL thickness in any quadrant (Table 4).
Discriminative power of RNFL curvature and RNFL thickness The areas under the (AROCs) for differentiation between normal control and glaucomatous eyes (with suspected
glaucoma classified with glaucoma) are reported in Table 5 and Fig. 1. The inferior RNFL thickness provided the best area under the curve (AROC, 0.766). The discriminant function of the horizontal RNFL curvature had an AROC of 0.703, and that of the vertical RNFL curvature had an AROC of 0.575.
Table 4. The correlation of RNFL curvature measured using HRT and RNFL thickness measured using OCT Variable RNFL curvature by HRT RNFL thickness measured by
OCT (µm) p-value* r† p-value* r‡ The whole group
(n = 208)
Horizontal -0.074 ± 0.067 Superior Q 102.66 ± 31.10 <0.001 0.309 <0.001 0.348 Inferior Q 110.52 ± 34.60 <0.001 0.327 <0.001 0.380 Nasal Q 58.05 ± 15.08 0.300 -0.072 0.825 0.015 Temporal Q 68.69 ± 20.81 0.002 0.210 <0.001 0.294 Average 84.65 ± 22.03 <0.001 0.269 <0.001 0.345 Vertical -0.148 ± 0.061 Superior Q 102.66 ± 31.10 0.296 -0.073 0.242 -0.082 Inferior Q 110.52 ± 34.60 0.459 -0.052 0.452 -0.053 Nasal Q 58.05 ± 15.08 0.023 -0.157 0.107 -0.112 Temporal Q 68.69 ± 20.81 0.543 -0.042 0.813 -0.017 Average 84.65 ± 22.03 0.156 -0.099 0.223 -0.085 Suspected glaucoma
+ glaucoma (n = 166)
Horizontal -0.081 ± 0.064 Superior Q 97.55 ± 32.01 0.001 0.260 <0.001 0.337 Inferior Q 104.28 ± 34.43 0.001 0.293 <0.001 0.392 Nasal Q 57.79 ± 15.95 0.132 -0.117 0.863 0.014 Temporal Q 65.27 ± 19.97 0.010 0.199 <0.001 0.312 Average 84.81 ± 21.62 0.032 0.167 0.010 0.199 Vertical -0.151 ± 0.062 Superior Q 97.55 ± 32.01 0.341 -0.087 0.383 -0.080 Inferior Q 104.28 ± 34.43 0.053 -0.133 0.131 -0.104 Nasal Q 57.79 ± 15.95 0.056 -0.134 0.233 -0.082 Temporal Q 65.27 ± 19.97 0.320 -0.078 0.613 -0.040 Average 84.81 ± 21.62 0.113 0.124 0.089 0.133 Focal inferior RNFL
defect (n = 23)
Horizontal -0.050 ± 0.066 Superior Q 108.92 ± 10.20 0.853 0.057 0.709 -0.121 Inferior Q 81.46 ± 12.52 0.737 0.103 0.993 -0.003 Nasal Q 64.84 ± 7.93 0.972 0.011 0.349 -0.297 Temporal Q 68.84 ± 7.71 0.394 0.183 0.355 0.293 Average 83.47 ± 12.06 0.849 -0.059 0.496 -0.218 Vertical -0.130 ± 0.031 Superior Q 108.92 ± 10.20 0.104 -0.471 0.059 -0.559 Inferior Q 81.46 ± 12.52 0.029 -0.603 0.003 -0.779 Nasal Q 64.84 ± 7.93 0.479 -0.216 0.045 -0.587 Temporal Q 68.84 ± 7.71 0.373 0.296 0.561 0.187 Average 83.47 ± 12.06 0.202 -0.379 0.052 -0.571 Values are presented as mean ± standard deviation.
RNFL = retinal nerve fiber layer; HRT = Heidelberg retina tomograph; OCT = optical coherence tomography; Q = quadrant.
*p-value < 0.05 is statistically significant; †r = Pearson’s correlation coefficient; ‡r = partial correlation coefficient adjusted by disc size.
Discussion
The HRT software adds a new automated classification called GPS, which has the theoretical advantage of obtain- ing structural measurements without operator-dependent factors, thus minimizing variability. However, absolute val- ues for each GPS parameter such as RNFL curvature have not been widely validated, nor have the relative values in normal subjects and glaucoma patients.
Among the GPS parameters, the horizontal and vertical RNFL curvatures reflect the overall curvature along the na- so-temporal axis and the inferior-superior axis, respectively.
In an automatic model of ONH, positive values of RNFL curvature indices indicate that the neuroretinal rim region around the cup is convexly curved, causing it to bulge up- ward into the vitreous.4 Swindale et al.4 showed positive values in the horizontal and vertical RNFL curvatures in normal subjects (0.0193 ± 0.091 and 0.045 ± 0.075, respec- tively). Of note, however, normal eyes in our study showed negative values for the horizontal and vertical RNFL cur- vatures (-0.038 ± 0.049 and -0.134 ± 0.056, respectively;
Table 2). The different profile in our study suggests that the current built-in normative database should be used with
caution for RNFL curvature in Asian subjects. The HRT III normative database includes 733 healthy Caucasian eyes and 215 healthy African-American eyes.9 On the other hand, the horizontal RNFL curvature (-0.038 ± 0.049) was more convex than the vertical RNFL curvature (-0.134 ± 0.056; p = 0.001) in normal subjects and was comparable to the results of a previous study.4
The horizontal RNFL curvature was flatter in the glauco- matous eyes than normal control group (p = 0.001), but the vertical RNFL curvature showed no significant difference among the three groups (p = 0.140). We reasoned that the RNFL curvature along each axis might have a relationship with rim-related parameters or RNFL thickness in different quadrants. Thus, we evaluated whether the RNFL curva- ture in each axis was correlated with rim volume or RNFL thickness in each quadrant. Good agreement has been reported for RNFL thickness determined by OCT and his- tological measurements. The sensitivity of the Stratus OCT Table 5. AROC (95% confidence interval) for discrimination
between normal control and glaucomatous eyes (suspected glaucoma+glaucoma group) using RNFL curvature measured by HRT and RNFL thickness at each quadrant measured by OCT in the whole group
Characteristic AROC in whole group (95% confidence interval) RNFL curvature (HRT)
Horizontal 0.703 (0.620-0.786)
Vertical 0.575 (0.482-0.668)
RNFL thickness (OCT, µm)
Superior quadrant 0.750 (0.682-0.818) Inferior quadrant 0.766 (0.693-0.838)
Nasal quadrant 0.558 (0.470-0.646)
Temporal quadrant 0.738 (0.659-0.816) AROC = area under the receiver operating characteristic curve;
RNFL = retinal nerve fiber layer; HRT = Heidelberg retina
tomography; OCT = optical coherence tomography. Figure 1. Area receiver operating characteristic (AROC) curves (95% confidence interval) for discrimination between normal control and glaucomatous eyes (suspected glaucoma+glaucoma group) using retinal nerve fiber layer (RNFL) curvatures measured using a Heidelberg retina tomograph and RNFL thicknesses at each quadrant measured by optical coherence tomography. The inferior RNFL thickness provided the best area under the curve (AROC, 0.766). The AROC in the horizontal RNFL curvature was 0.703, and 0.575 in the vertical RNFL curtvature.
has been shown to be higher than that of the HRT III.3,10 Thus, we used a Stratus OCT system version 3 for the RNFL measurements.
The horizontal RNFL curvatures had a weak positive cor- relation with rim volume in the whole group (Table 3). This may be attributable primarily to thinning of the neural rim in eyes with glaucoma.11 However, the rim volume determi- nations made using the HRT III did not provide individual values for each sector; thus, we could not evaluate the re- lationship between the rim volume in each sector and the RNFL curvature along each axis.
Regarding RNFL thickness, the horizontal RNFL cur- vature showed a positive correlation with the superior, inferior, and temporal RNFL thicknesses (Table 4). The analysis between variables showed a constant correlation in suspected glaucoma and glaucoma subjects. In a partial correlation controlling for disc size, the horizontal RNFL curvature had a significant correlation with the superior and inferior RNFL thicknesses. Although the GPS algorithm did not include disc size, in contrast to Moorfields regres- sion analysis, there was no significant effect of disc size on the positive correlation between variables.
Our study found that the horizontal RNFL curvature was correlated with the RNFL thickness along the superi- or-inferior axis, rather than the naso-temporal axis. In the parametric mathematical model of ONH shape, images of ONHs are superimposed on a relatively smooth surface with a variable degree of curvature (the rim region). However, the parabolic curvature of the background (i.e., the rim and disc margins) is unrealistic, because it leads to depth values that increase as the square of the distance from the center of the cup, which does not happen in reality.4 In real ONHs, the neural rim of the normal ONH is typically broadest in the inferior quadrant, followed by the superior and then the nasal rims, with the temporal rim being the thinnest.12 Also, for RNFL thickness, the superior and inferior quadrants of the peripapillary retina are thicker than the nasal and tem- poral quadrants.13 Thus, realistic images of ONHs cannot be based on the smooth surface of the background.
The overall RNFL curvature along the naso-temporal axis or the inferior-superior axis is influenced by not only the
RNFL thickness on same axis but also the RNFL thickness on the other axis. The correlation of the horizontal RNFL curvature with the RNFL thickness on the inferior-superior axis does not necessarily mean that the horizontal curvature is not related to the RNFL thickness in the nasal-temporal axis. It means that the horizontal RNFL curvature is in- fluenced to a greater extent by the RNFL thickness in the superior-inferior axis, which is thicker than that in the na- so-temporal axis. Thus, the horizontal RNFL curvature is more convex than the vertical curvature in healthy eyes. Se- lective loss of neural rim tissue in glaucoma occurs primar- ily in the inferior or inferotemporal region of the ONH, and to a lesser extent in the superotemporal sector, in the early stages of damage.14,15 The RNFL thickness in the inferior or superior region was best for glaucoma detection.16,17 Thus, it makes sense that the horizontal RNFL curvature, which is more convex than the vertical curvature in normal eyes, is substantially reduced as glaucoma progresses.
On the other hand, the vertical RNFL curvature had a slight negative correlation with the inferior RNFL thickness in the group of patients with suspected glaucoma or glauco- ma, although this was not statistically significant (indicated by shadowing in Table 4). In subjects with focal inferior RNFL defects, the vertical RNFL curvature showed a strong negative correlation with the inferior RNFL thick- ness (p = 0.029, γ = -0.603), but the horizontal RNFL curvature did not show a correlation with RNFL thickness parameters. In other words, in eyes with a localized RNFL defect in the inferior quadrant, the vertical RNFL curva- ture had a higher value than in normal control eyes. With thinning of the inferior RNFL, especially in eyes with a localized inferior RNFL defect, the difference between the inferior and superior RNFL thicknesses would become greater, and as a result, the RNFL curvature along the ver- tical axis would become more convex (Fig. 2). Monitoring the vertical RNFL curvature may enable the detection of early glaucomatous changes. Thus, it is not correct to say simply that the RNFL curvature, especially vertical curva- ture, decreases with glaucoma progression. The horizontal RNFL curvature decreased with glaucoma progression, but the vertical RNFL curvature increased with glaucoma
progression in early stage glaucoma with a focal inferior RNFL defect. Therefore, the type of RNFL curvature and glaucoma stage should be considered to the application of RNFL curvature in patients with glaucoma.
The AROC of the horizontal RNFL curvature (0.703) was slightly lower than that of the inferior RNFL thickness measured by OCT (AROC = 0.766). Burgansky-Eliash et al.5 reported that among individual GPS parameters, the horizontal RNFL curvature (AROC = 0.905) provided the
best discriminating ability between glaucoma and normal control eyes. Our study found a slightly lower AROC for the horizontal RNFL curvature, perhaps because we includ- ed suspected glaucoma subjects without definite visual field defects.
In summary, compared with the vertical RNFL curvature, the horizontal RNFL curvature showed a higher diagnostic ability to discriminate between healthy and glaucomatous eyes, and had positive correlation with RNFL thickness
Figure 2. Schematic showing configuration of horizontal (yellow color line) and vertical (red color line) retinal nerve fiber layer (RNFL) curvature, and the number corresponding to mean value of each RNFL curvature. In normal control, the horizontal RNFL curvature was more convex than the vertical RNFL curvature. In a subject with diffuse RNFL defect, the horizontal RNFL curvature is substantially reduced in subjects with diffuse RNFL defect (top). The number along each RNFL curvature presents the mean of the glaucoma group (center). In a subject with localized inferior RNFL defect, more change in the vertical RNFL curvature is seen. As the focal RNFL defect appears only in inferior or superior region in early glaucoma, the difference between the inferior and superior RNFL thicknesses be- comes greater. This results in a more convex configuration of the vertical RNFL curvature (bottom).
profiles in non-nasal quadrant. In eyes with a focal inferior RNFL defect, which is likely to be an early glaucomatous change, the vertical RNFL curvature had a strong negative correlation with the inferior RNFL thickness. Despite the reliable diagnostic ability of the horizontal RNFL curva- ture, its absolute value should be carefully interpreted ac- cording to glaucoma stage.
Acknowledgements/disclosure
None of the authors has any government or non-govern- ment support in any material or method mentioned. And none of the authors has any financial or proprietary interest in any material or method mentioned.
References
1. Janknecht P, Funk J. Optic nerve head analyser and Hei- delberg retina tomograph: accuracy and reproducibility of topographic measurements in a model eye and in volun- teers. Br J Ophthalmol 1994;78:760-8.
2. Miglior S, Albé E, Guareschi M, et al. Intraobserver and interobserver reproducibility in the evaluation of optic disc stereometric parameters by Heidelberg Retina Tomograph.
Ophthalmology 2002;109:1072-7.
3. Moreno-Montañés J, Antón A, García N, et al. Compari- son of retinal nerve fiber layer thickness values using Stra- tus Optical Coherence Tomography and Heidelberg Retina Tomograph-III. J Glaucoma 2009;18:528-34.
4. Swindale NV, Stjepanovic G, Chin A, Mikelberg FS.
Automated analysis of normal and glaucomatous optic nerve head topography images. Invest Ophthalmol Vis Sci 2000;41:1730-42.
5. Burgansky-Eliash Z, Wollstein G, Bilonick RA, et al.
Glaucoma detection with the Heidelberg retina tomogra- phy 3. Ophthalmology 2007;114:466-71.
6. ChylackLT Jr, Wolfe JK, Singer DM, et al. The Lens Opac- ities Classification System III. The Longitudinal Study of Cataract Study Group. Arch Ophthalmol 1993;111:831-6.
7. Caprioli J. Automated perimetry in glaucoma. Am J Oph- thalmol 1991;111:235-9.
8. Hoyt WF, Frisén L, Newman NM. Fundoscopy of nerve fiber layer defects in glaucoma. Invest Ophthalmol 1973;12:814-29.
9. Heidelberg Retina Tomography Glaucoma Module. Oper- ating Instructions Software Version 3.0. Heidelberg, Ger- many: Heidelberg Engineering; 2005.
10. Huang Y, Cideciyan AV, Papastergiou GI, et al. Relation of optical coherence tomography to microanatomy in normal and rd chickens. Invest Ophthalmol Vis Sci 1998;39:2405- 16.
11. Embadi A, Zangwill L, Sample PA, et al. Patterns of optic disk damage in patients with early focal visual field loss.
Am J Ophthalmol 1998;126:763-71.
12. Jonas JB, Gusek GC, Naumann GO. Optic disc, cup and neuroretinal rim size, configuration and correlations in normal eyes. Invest Ophthalmol Vis Sci 1988;29:1151-8.
13. Frenkel S, Morgan JE, Blumenthal EZ. Histological mea- surement of retinal nerve fiber layer thickness. Eye (Lond) 2005;19:491-8.
14. Kirsch RE, Anderson DR. Clinical recognition of glauco- matous cupping. Am J Ophthalmol 1973;75:442-54.
15. Spaeth GL, Hitchings RA, Sivalingam E. The optic disc in glaucoma: pathogenetic correlation of five patterns of cup- ping in chronic open-angle glaucoma. Trans Sect Ophthal- mol Am Acad Ophthalmol Otolaryngol 1976;81:217-23.
16. Kanamori A, Nakamura M, Escano MF, et al. Evaluation of the glaucomatous damage on retinal nerve fiber layer thickness measured by optical coherence tomography. Am J Ophthalmol 2003;135:513-20.
17. Nouri-Mahdavi K, Hoffman D, Tannenbaum DP, et al.
Identifying early glaucoma with optical coherence tomog- raphy. Am J Opthalmol 2004;137:228-35.
국문초록
녹내장에서 망막신경섬유층 곡률과 두께의 연관성
목적: Heidelberg retinal tomography (HRT) 3에서 산출되는 수평 및 수직 망막시신경섬유층 곡률과 빛간섭단층촬영으로 측정한 망막신경섬유층 두께의 연관관계를 알아보고자 하였다.
대상과 방법: 녹내장 122안, 녹내장 의증 44안, 정상 42안을 대상으로 하여 후향적 조사를 실시하였다. 모든 대상자는 시야검사, 공초점 스캐닝 레이저 검안경(HRT), 빛간섭단층촬영을 시행하였다. 세 군 간 망막시신경섬유층 곡률과 각 사분면의 망막신경섬유층두께를 비교하였다. 녹내장 진단 능력은 area receiver operating characteristics curves를 이용하여 분석하였다.
수평 및 수직 망막시신경섬유층 곡률과 빛간섭단층촬영으로 측정한 망막신경섬유층 두께의 상관관계를 Pearson correlation method를 사용하여 분석하였다.
결과: 정상안에서 수평 망막신경섬유층 곡률은 수직 망막신경섬유층 곡률보다 볼록했고 녹내장이 진행할수록 감소했다. 수평 망막신경섬유층 곡률은 상측, 하측, 이측 망막신경섬유층 두께와 양의 상관관계를 보였다(p ≤ 0.001, p < 0.001, p = 0.002; γ = 0.309, γ = 0.327, γ = 0.210). 하측 사분면에 망막신경섬유층 결손이 있는 환자에서 수직 망막신경섬유층 곡률은 하측 망막신경섬유층 두께와 음의 상관관계를 나타냈다(p = 0.029, γ = -0.603).
결론: 수직 망막신경섬유층 곡률과 비교하여, 수평 망막신경섬유층 곡률은 녹내장에 대한 더 높은 진단력을 보였고 몇몇 망막신경섬유층 두께 변수와 양의 상관관계를 보였다.