1. Introduction
Aluminum (Al) and its alloys are extensively used in automotive industries due to their low density, high specif- ic strength, high stiffness, high wear resistance, high elec- tric and thermal conductivity [1-4]. Machinability and workability of Al alloys are the challenging tasks; several alloying elements are added to improve these properties while developing Al alloys [5]. Aluminum alloy contain- ing minor alloying element ‘Ni’ is practically significant compared to other Al based alloys due to their high strength while maintaining stability [6]. Their strength and creep resistance are mainly depending on structural stabil- ity, Ni content, operating temperature, initial grain size and secondary phase morphologies and stability over ag- ing [7]. It is also reported that, low Ni content results in low conductivity, poor ductility at room temperature, lower high temperature strength and creep resistance [8].
Funda et al. [9] have recently reported that, the amount of Ni content in the Al-Ni alloy is directly proportional to the amount of intermetallic phases (Al-Al3Ni) at grain
boundaries of α-Al grains. The addition of Ni up to 5wt%
in pure Al caused the formation of 45 % of eutectic with intermetallic phases. Specifically Al3Ni intermetallic phase had a fibers morphology and the eutectic region is consisted of Al3Ni fibers and α-Al around the fibers.
It had also been reported that, addition of Ni in Al-Si alloy improved its hot hardness [10]. The influence of Ni addition on the microstructure and mechanical proper- ties of Al based alloys were reported by Mendex et al.
[11] and the addition of Ni improved the mechanical prop- erties of Al alloys mainly due to the presence of Al3Ni intermetallic compounds. These studies clearly indicated that, the formation of Al3Ni phase is beneficial to improve the mechanical properties of Al alloys. However, the pres- ence of Al3Ni intermetallic phases is detrimental to Al corrosion since Al3Ni is cathodic to Al matrix [12].
Extensive studies on electrochemical corrosion behavior of Al-Ni alloys were carried out by Osorio et al [13 &
14]. It was confirmed that, the distribution of Al3Ni phase play a key role on the corrosion behavior of Al-Ni alloys and the coarse dendrite arrays are highly susceptible to pitting corrosion than fine dendrite arrays in 0.05 M NaCl solution at 25 ºC. Corrosion behavior of Ni-Al inter-
Corrosion Behavior of High Pressure Die Cast Al-Ni and Al-Ni-Ca Alloys in 3.5% NaCl Solution
Srinivasan Arthanari, Jae Cheol Jang, and Kwang Seon Shin†
Magnesium Technology Innovation Center, School of Materials Science and Engineering, Seoul National University, 1 Gwanak-ro, Gwanak-gu, Seoul - 08826, Korea (Received December 31, 2016; Revised April 25, 2017; Accepted June 13, 2017)
In this investigation corrosion behavior of newly developed high-pressure die cast Al-Ni (N15) and Al-Ni-Ca (NX1503) alloys was studied in 3.5% NaCl solution. The electrochemical corrosion behavior was evaluated using open circuit potential (OCP) measurement, potentiodynamic polarization, and electrochemical impedance spectroscopy (EIS) techniques. Potentiodynamic polarization results validated that NX1503 alloy exhibited lower corrosion current density (icorr) value (5.969 µA/cm2) compared to N15 (7.387 µA/cm2). EIS-Bode plots revealed a higher impedance (|Z|) value and maximum phase angle value for NX1503 than N15 alloy. Equivalent circuit curve fitting analysis revealed that surface layer (R1) and charge transfer resistance (Rct) values of NX1503 alloy was higher compared to N15 alloy. Immersion corrosion studies were also conducted for alloys using fishing line specimen arrangement to simultaneously measure corrosion rates from weight loss (PW) and hydrogen volume (PH) after 72 hours and NX1503 alloy had lower corrosion rate compared to N15 alloy. The addition of Ca to N15 alloy significantly reduced the Al3Ni intermetallic phase and further grain refinement may be attributed for reduction in the corrosion rate.
Keywords: aluminum alloys, die-casting, corrosion, polarization, impedance
†Corresponding author: [email protected]
metallic compounds with varying Ni: Al ratio have re- cently been investigated in 3.5% NaCl solution at room temperature [15] and increase of Ni content was detri- mental to corrosion since the formed NiAl and Ni3Al acted as cathode and anodes respectively. In addition to that, higher Al content produced thick and fairly complete sur- face layer of Al2O3 and blocked the further corrosion of the matrix. These findings clearly indicated that, though the addition of Ni significantly improved the mechanical properties of Al alloy, affected its corrosion characteristics.
Therefore, tuning the microstructure of the Al-Ni alloy would further require to improves its corrosion resistance while maintaining its mechanical properties.
Certain alloying elements viz., Ti, B, Ca, Sr, Be, Mn and Cr has been identified as microstructure modifier of Al alloys [1]. Hence addition of one of these elements could refine the microstructure of Al-Ni alloy, thereby in- fluence its mechanical and chemical properties and re- search on these directions are scanty. Therefore, in the
present investigation the influence of Ca addition in Al-Ni alloy on the corrosion behavior has been studied systematically. Electrochemical and immersion corrosion studies were carried out for the high pressure die cast Al-Ni and Al-Ni-Ca alloys to evaluate their corrosion behavior. Surface morphologies and chemical composition of the alloys after corrosion studies have also been inves- tigated to explain their corrosion behavior.
2. Experimental Procedure
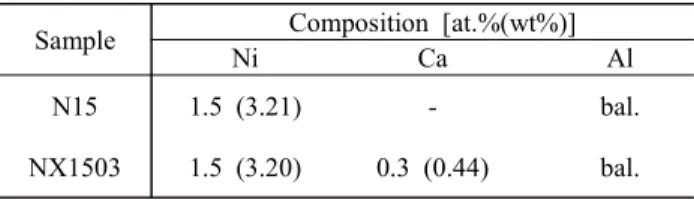
N15 and NX1503 Al alloys used in the present inves- tigation were developed by high pressure die casting (HPDC) method using 125 ton die casting machine (BD-125V5EX, TOYO Co. Ltd.). Al alloys with the pro- posed composition of Ni and Ca were melted at 730 oC and casted. The mold was pre-heated at 200 oC and the plunger inner diameter was 40 mm and the casting was carried out at plunger speed of 0.2 m/s (Initial speed) and 2.0 (Fastest speed) the chemical composition of the devel- oped alloys are given in Table 1.
The specimens with the dimension of 15 x 10 x 3 mm were sliced from the biscuit (ASTM-E8 Standard) of cast alloys to carryout corrosion studies. Prior to the corrosion studies the samples were abraded up to 2000 # silicon carbide (SiC) emery papers, ultrasonicated in acetone for 10 min, air dried and subjected to electrochemical and immersion corrosion studies.
Table 1 Chemical compositions of high pressure die cast N15 and NX1503 Al alloys
Sample Composition [at.%(wt%)]
Ni Ca Al
N15 1.5 (3.21) - bal.
NX1503 1.5 (3.20) 0.3 (0.44) bal.
3.5% NaCl solution
Fig. 1 Laboratory fishing line specimen arrangement used to measure the corrosion rates of N15 and NX1503 Al alloys.
Electrochemical corrosion behavior of N15 and NX1503 alloys was evaluated using a conventional three-electrode flat cell in 3.5% NaCl solution [16-18]. N15 and NX1503 with an exposed area of 1 cm2 was used as working elec- trode (WE). Pt sheet and Ag/AgCl were used as counter (CE) and reference (RE) electrodes, respectively.
Princeton Applied Research VersaStat 3 Potentiostat/
Galvanostat was used for OCP, EIS and potentiodynamic polarization studies. Initially, WE was exposed to 3.5%
NaCl solution for 1800 s to stabilize its OCP and then EIS study was carried out in the frequency range from 100 kHz to 0.1 Hz with an amplitude of 10 mV.
Potentiodynamic polarization study was carried out in the potential range of OCP ± 250 mV at a scan rate of 1 mV/s to shorten the experiment time [18].
Immersion corrosion studies were carried out using fishing line specimen arrangement (Fig. 1) [19] to measure the corrosion rates from weight loss (PW) and hydrogen volume (PH) methods. The samples were hung into the inverted funnel in 1000 ml of 3.5% NaCl solution using fishing line at 24 ± 1 ºC. Subsequently the burette filled with 3.5% NaCl solution was positioned over the inverted funnel to measure the evolved hydrogen. The samples were immersed for 3 days (72 h), then taken away from the solution, thoroughly washed with running water to re- move the adsorbed solution and corrosion products. The corrosion products were removed by immersing the sam- ples into 200 g/l CrO3 solution containing 10 g/l of AgNO3. The change in sample weight before and after corrosion tests [20] and volume of evolved hydrogen were used to calculate the corrosion rates and the detailed for- mula used for corrosion rate calculation are given below.
Weight loss corrosion rate =
(K × W) / (A × T × D) mm/y (1) Where, K = 8.76 x 10⁴, W = Mass loss (mg), A - Area
(cm2), T - Time (h) and D - Density (2.7 g/㎤)
26.98 g of Al (1 mol) corrosion ≡ 33.5 L of Hydrogen gas evolution
W = 26.98/33.5 VH ≈ 0.805 VH mg.. (2) VH - Volume of Hydrogen evolved (ml/cm2/d) Hydrogen volume corrosion rate =
(K × 0.805 VH) / (A × T × D) mm/y (3)
Surface morphology and chemical composition of N15 and NX1503 alloys after immersion corrosion tests for 72 h were examined using JEOL-JSM 6360 scanning elec- tron microscope (SEM) attached with an INCA X-Sight Oxford Instruments EDAX analyzer. SEM images and EDAX chemical composition were obtained at an accel- erating voltage of 20 kV with the working distance of 10 mm.
3. Results and Discussion
3.1 Microstructural studies
Optical micrographs of high pressure die-cast N15 and NX1503 alloys are shown in Fig. 2. It can be seen from the microstructures that, both N15 and NX1503 alloys are consisted of intermetallic compounds at the grain boundaries.
The dark region at the grain boundaries of N15 alloy are mainly attributed to fiber-like Al3Ni intermetallic com- pounds and the bright regions are corresponding to α-Al matrix [13]. Interestingly the fraction of dark regions has reduced for NX1503 Al alloy with grain refinement. These results clearly indicate that, the addition of Ca sig- nificantly reduced the Al3Ni intermetallic compound precipitation. In addition to that, the average grain size of N15 and NX1503 alloys was about 6 and 4.5 µm respectively. The lower grain size in NX1503 alloy is at- Fig. 2 Microstructures of high pressure die cast N15 and NX1503 Al alloys.
tributed to the addition of Ca, which would reduce the grain boundary movement [21,22].
3.2 Corrosion behavior
3.2.1 Electrochemical corrosion studies
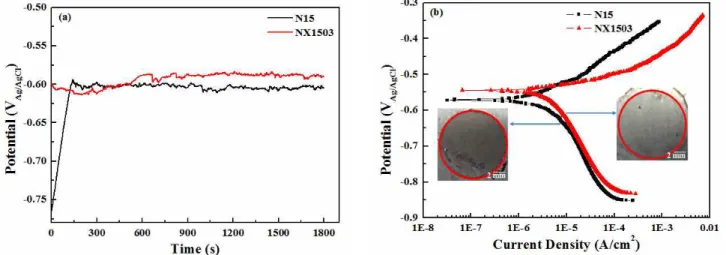
The change in OCP values of N15 and NX1503 alloys as a function of time in 3.5% NaCl solution are compared in Fig. 3a. It is seen from the plots that, the potential of NX1503 alloy has marginally shifted to positive direction
(∼0.03 VAg/AgCl) compared to N15 indicating its passive nature. However, minor fluctuations were noticed for both the alloys during entire exposure duration confirming the metastable pit formation and passivation. Potentiodynamic polarization curves of N15 and NX1503 alloys are com- pared in Fig. 3b and the obtained Tafel parameters viz., corrosion potential (Ecorr), corrosion current density (icorr), cathodic (βc) and anodic slopes (βa) are compared in Table 2. As can be seen from the Table 2, the Ecorr values of NX1503 and N15 alloys are -0.546 VAg/AgCl and -0.572 VAg/AgCl respectively, indicating that NX1503 surface is more noble compared to N15 alloy. Furthermore, the icorr
values are also decreased from 7.387 to 5.969 µA/cm2 when the Ca was added to N15 alloy confirming that, addition of Ca improved the corrosion resistance of Al-Ni alloy. The decrease in Al3Ni intermetallic phase in NX1503 alloy could be responsible for its improved corro- sion resistance.
In order to further understand the corrosion behavior, EIS studies were carried out for N15 and NX1503 alloys and the obtained bode plots (Frequency vs. Phase angle and Frequency vs. |Z|) are represented in Fig. 4. It is inter- esting to note that, the |Z| value of NX1503 increased compared to N15 alloy and the phase angle maxima at 102 to 1 Hz frequency region was also increased from -67º (N15) to -71º (NX1503) with slight increase in peak
Fig. 3 (a) OCP and (b) Potentiodynamic polarization curves of N15 and NX1503 Al alloys in 3.5% NaCl solution.
Table 2 Comparison of potentiodynamic polarization parameters of N15 and NX1503 Al alloys
Sample E
corr (V
Ag/AgCl) i
corr (µA/cm
2
) βc
(VAg/AgCl)
βa (VAg/AgCl)
N15 -0.572 7.387 0.283 0.113
NX1503 -0.546 5.969 0.214 0.028
Fig. 4 EIS Bode plots of N15 and NX1503 Al alloys in 3.5%
NaCl solution after 1800 s.
area. The material becomes more stable to corrosive envi- ronment as the phase angle maxima increases with peak broadening [15], the obtained results confirming the ca- pacitive behavior and the addition of Ca improved the corrosion resistance of Al-Ni alloy [23].
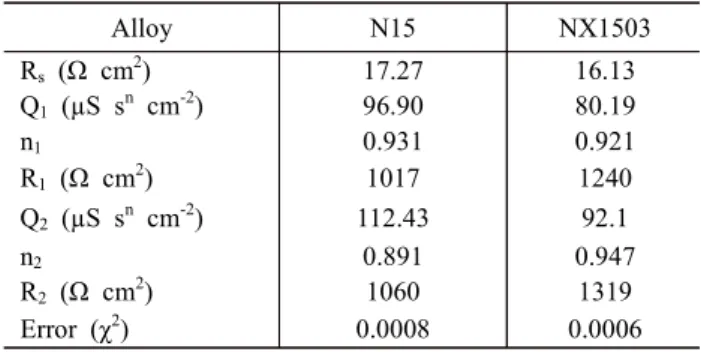
Equivalent circuit (EC) curve fitting analysis was also performed to EIS results, the EC model [14,15] and the derived parameters are given in Fig. 5 and Table 3 respectively. The EC was constructed using several ele- ments viz., RE - reference electrode, CE - counter elec- trode, WE - working electrode, Rs - solution resistance, R1 - surface layer resistance and R2 - charge transfer resist- ance and constant phase elements (CPE) of surface layer (Q1) and double layer (Q2). CPEs with coefficients n1 and
n2 have been used instead of capacitance to show the devi- ation from the ideal capacitive behavior [14,18]. The fitted plots are also included in Fig. 6 and there is a good agree- ment between the experimental and calculated values, the error (χ2) values were also in the range of 10-4. From the Table 3 it is inferred that, the R1 and Q1values of N15 and NX1503 alloys are 1017 and 1240 Ω cm2 and 96.9 and 80.19 µS sn cm-2 respectively, confirming that the sur- face layer resistance of NX1503 is higher than that of N15. Hence, nearly 200 Ω cm2 increment in R1 value of NX1503 alloy is attributed to the addition of Ca to N15 alloy. As can be identified from the microstructures (Fig.
2), the significant reduction in Al3Ni phase in NX1503 alloy could be responsible for the increase of R1 value.
Interestingly R2 value of NX1503 (1319 Ω cm2) was high- er than that of N15 (1060 Ω cm2) revealing that the charge transfer resistance (Rct) also increased as the Ca was added. These results are clearly indicating that, addition of Ca control the penetration of aggressive ions through the surface layer to the metal/surface layer interface, there- by increases the corrosion resistance in aggressive chlor- ide medium. These results further substantiated the po- tentiodynamic polarization results.
3.2.2 Immersion corrosion studies
Fig. 7 shows the change in Hydrogen volume of N15 and NX1503 alloys as a function of time in 3.5% NaCl solution. The increasing trend in hydrogen evolution vol- ume was noticed with increase in immersion duration. In particular, the volume of hydrogen evolved for N15 alloy was found to be 0.13, 0.32 and 0.37 ml/cm2 after 24, 48 and 72 h respectively. Whereas, in the case of NX1503 alloy it was 0.12, 0.25 and 0.32 ml/cm2 after 24, 48 and 72 h respectively. These results clearly indicating that dur- ing initial immersion time, the hydrogen evolution rate Fig. 5 Equivalent circuit model used for curve fitting of EIS results.
Table 3 Equivalent circuit curve fitting parameters of N15 and NX1503 Al alloys
Alloy N15 NX1503
Rs (Ω cm2) 17.27 16.13
Q1 (µS sn cm-2) 96.90 80.19
n1 0.931 0.921
R1 (Ω cm2) 1017 1240
Q2 (µS sn cm-2) 112.43 92.1
n2 0.891 0.947
R2 (Ω cm2) 1060 1319
Error (χ2) 0.0008 0.0006
Fig. 6 Fitted plots of experimental and calculated EIS results.
is higher and when the immersion duration is increased, it decreases and it could be attributed to the formation
of corrosion product layers on the surface, which acted as a barrier to the aggressive ions to penetrate through Fig. 7 Change in hydrogen volume of N15 and NX1503 Al alloys
in 3.5% NaCl solution as a function of time.
Fig. 8 Comparison of corrosion rates (PW and PH) of N15 and NX1503 Al alloys after 72 h of immersion in 3.5% NaCl solution.
(a) (b)
Fig. 9 Macroscopic images of (a) N15 and (b) NX1503 Al alloys after 72 h in 3.5% NaCl solution (WCP- With corrosion products and ACPR- After corrosion products removal).
(a)
(b)
Fig. 10 SEM images and EDAX spectra of (a) N15 and (b) NX1503 Al alloys after removal of corrosion products.
the substrate and control the further corrosion [19].
Corrosion rates of N15 and NX1503 alloys were calcu- lated based on weight loss (PW) and volume of hydrogen evolved (PH) and the obtained results are represented as a function of immersion time in Fig. 8. The mass loss values were about 0.197 and 0.159 mg/cm2/d for N15 and NX1503 respectively after 72 h in 3.5% NaCl solution.
It can also be seen from the figure that, the corrosion rate of N15 alloy was found to be 0.266 (PW) and 0.184 (PH) mm/y while that of NX1503 was about 0.215 (PW) and 0.157 (PH) mm/y after 72 h of immersion. These re- sults clearly indicating an improved corrosion resistance of NX1503 alloy. Macroscopic images of N15 and NX1503 alloys subjected to immersion corrosion studies before and after removal of corrosion products are given in Fig. 9. The existence of white corrosion products layer along with corrosion pits are clearly seen on the surface of N15. However, in the case of NX1503 the white layer was relatively less compared to N15 and also the visible pits are not seen, confirming its improved corrosion resistance.
SEM images of N15 and NX1503 alloys after removal of corrosion products are shown in Fig. 10. SEM images were taken at two different spots (mentioned in macro- scopic images as ‘A’, ‘B’, ‘C’, and ‘D’) and it is seen from the images of N15 alloy that, the sample has under- gone uniform corrosion along with several deep pits. The magnified image revealed that, the precipitates are seen at the grain boundaries and Al matrix has undergone the dissolution [24]. Furthermore, the EDAX patterns and chemical composition also indicated that, matrix is con- sisted of Al with trace amount of Ni and the precipitate is mainly consisting of Al and Ni corresponding to Al3Ni intermetallic phase. These results confirming that, α-Al phase preferentially undergo pitting corrosion than α -Al/Al3Ni eutectic region [25]. It is interesting to note that, though the similar behavior was noticed in the case of NX1503 alloy, the severe pits were not noticed, confirm- ing the better corrosion resistance. In addition to that, the surface layer was existing on the surface with uniform pits. Higher amount of precipitates was clearly seen on the grain boundaries mainly consisting of Al, Ni and Ca, which would control the Al dissolution [22]. Therefore, it is understood from the results that, Ca addition alters the intrinsic microstructure of the Al-Ni alloy by refining the grains and precipitation of Ca containing intermetallic phases at the grain boundaries and attributed to improved corrosion resistance of NX1503 alloy.
4. Conclusions
Microstructure revealed that, the addition of Ca to Al-Ni significantly reduced the Al3Ni intermetallic phase for- mation with grain refinement. Corrosion behavior of high pressure die-cast N15 and NX1503 alloys has been inves- tigated in 3.5% NaCl solution. The icorr value of NX1503 alloy was lower than that of N15 alloy confirming its im- proved corrosion resistance. Further, the equivalent circuit parameters derived from EIS results revealed the higher surface layer (R1) and charge transfer resistance (R2) val- ues for NX1503 alloy and substantiated the polarization results. Corrosion rate (PW) measured using fishing line specimen arrangement was decreased from 0.266 to 0.215 mm/y with the addition of Ca (0.3 at.%) confirming that Ca addition alters the intrinsic microstructure of Al-Ni alloy by reducing Al3Ni intermetallic phase thereby de- crease the corrosion rate. SEM surface morphology and EDAX results after corrosion studies of N15 and NX1503 alloys revealed the uniform corrosion with several pits for N15 and surface layer with isolated pits for NX1503 alloy. Therefore, the reduction of Al3Ni intermetallic phase and decrease of grain size with the addition of Ca im- proved the corrosion resistance of NX1503 alloy.
Acknowledgements
Author Srinivasan Arthanari acknowledges the BK21 Plus project, SNU materials division fellowship for the financial support. This work was financially supported by the World Class 300 R&D Program(S2404600) funded by the Small Business Administration of Korea through the Research Institute of Advanced Materials(0417-20160064) and Magnesium Technology Innovation Center.
References
1. R. S. Rana, R. Purohit, S. Das, International Journal of Scientific and Research (IJSR), 2, 1 (2012).
2. S. Das, D. P. Mondal, S. Sawla, N. Ramkrishnan, Wear, 264, 47 (2008).
3. T. I. So, H. C. Jung, C. D. Lee, K. S. Shin, Met. Mater.
Int., 21, 842 (2015).
4. C. D. Lee, K. S. Shin, Mater. Sci. Eng. A, 599, 223 (2014).
5. A. Pithan, H. Koch, Inter. Metalcast., 9, 67 (2015).
6. M. Li, S. Du, Y. Hou, H. Geng, P. Jia, D. Zhao, J.
Non-Cryst. Solids, 411, 26 (2015).
7. M. Ragab, H. G. Salem, Powder Technol., 222, 108 (2012).
8. M. Li, S. Du, R. Liu, S. Lu, P. Jia, H. Geng, J. Mol.
Liq., 200, 168 (2014).
9. F. G. Koc, E. Karakulak, R. Yamanoglu, M. Zeren, Proc.
23rd International Conference on Metallurgy and Materials, pp. 1283-1287, Brno, Czech Republic (2014).
10. J. E. Hanafee, Mod. Cast., 71, 514 (1963).
11. F. H. Mendez, A. A. Torres, J. G. M. Hernandez, E. T.
Rojas, E. R. Rangel, Mater. Sci. Forum, 691, 10 (2011).
12. B. Peric, Z. Grubac, L. Sablic, Croat. Chem. Acta, 67, 289 (1994).
13. W. R. Osorio, J. E. Spinelli, C. R. M. Afonso, L. C.
Peixoto, A. Garcia, Electrochem. Acta, 69, 371 (2012).
14. W. R. Osorio, L. C. Peixoto, M. V. Cante, A. Garcia, Electrochem. Acta, 55, 4078 (2010).
15. J. Wen, H. Cui, N. Wei, X. Song, G. Zhang, C. Wang, J. Alloy. Compd., 695, 2424 (2017).
16. A. Srinivasan, K. S. Shin, N. Rajendran, RSC Adv., 6, 49910 (2016).
17. T. Dorin, N. Stanford, N. Birbilis, R. K. Gupta, Corros.
Sci., 100, 396 (2015).
18. S. K. Kairy, P. A. Rometsch, C. H. J. Davies, N. Birbilis, Corrosion, 73, 87 (2017).
19. Z. Shi, A. Atrens, Corros. Sci., 53, 226 (2011).
20. NACE TM0169/G31-12a, Standard guide for laboratory immersion corrosion testing of metals (2012).
21. S. J. Park, H. C. Jung, K. S. Shin, Mat. Sci. Eng. A, 679, 329 (2017).
22. J. Yang, J. Peng, E. C. Nyberg, F. Pan, Appl. Surf. Sci., 396, 92 (2016).
23. J. N. Balaraju, A. Srinivasan, G. Yoganandan, V. K.
William Grips, K. S. Rajam, Corros. Sci., 53, 4084 (2011).
24. Z. Zhang, E. Akiyama, Y. Watanabe, Y. Katada, K. Tsuzaki, Corros. Sci., 49, 2962 (2007).
25. E. Akiyama, Z. Zhang, Y. Watanabe, K. Tsuzaki, J. Solid State Electr., 13, 277 (2009).