D I A B E T E S & M E T A B O L I S M J O U R N A L
This is an Open Access article distributed under the terms of the Creative Commons At- tribution Non-Commercial License (http://creativecommons.org/licenses/by-nc/3.0/) which permits unrestricted non-commercial use, distribution, and reproduction in any medium, provided the original work is properly cited.
Women Are Diagnosed with Type 2 Diabetes at Higher Body Mass Indices and Older Ages than Men: Korea National Health and Nutrition Examination Survey 2007–2010
Su Kyoung Kwon
Department of Endocrinology and Metabolism, Kosin University Gospel Hospital, Kosin University College of Medicine, Busan, Korea
Background: Many epidemiologic studies have shown that women with type 2 diabetes have an increased risk of developing car- diovascular disease compared with men with diabetes. The aim of this study is to elucidate whether disparities of adiposity, age and insulin resistance (IR) at the time of diabetes diagnosis exist between women and men in the adult Korean population.
Methods: Data from The Korea National Health and Nutrition Examination Survey, performed in Korea from 2007 to 2010, were used. In the survey, anthropometric data and blood samples were obtained during a fasting state. IR and β-cell function were cal- culated using the homeostasis model assessment (HOMA-IR and HOMA-β, respectvely).
Results: The mean age of diabetes diagnosis was 58.5 years in women and was 55.1 years in men (P=0.015). The mean body mass index (BMI) of newly diagnosed diabetes subjects was 26.1 kg/m2 in women and 25.0 kg/m2 in men (P=0.001). The BMI was in- versely related to age in both genders, and the higher BMI in women than men was consistent throughout all age groups divided by decade. The HOMA-IR in women with diabetes is higher than in men with diabetes (7.25±0.77 vs. 5.20±0.32; P=0.012).
Conclusion: Korean adult women are diagnosed with type 2 diabetes at higher BMI and older age than men and are more insu- lin-resistant at the time of diabetes diagnosis. This may help explain why women with diabetes have an increased risk of develop- ing cardiovascular disease after the diagnosis of diabetes, compared to men.
Keywords: Adiposity; Cardiovascular diseases; Diabetes; Insulin resistance; Korea
Corresponding author: Su Kyoung Kwon
Department of Endocrinology and Metabolism, Kosin University Gospel Hospital, Kosin University College of Medicine, 262 Gamcheon-ro, Seo-gu, Busan 602-702, Korea
INTRODUCTION
Increasing numbers of patients with diabetes pose a major threat to global health, and the rising incidence is closely related to increasing obesity in Western and Eastern countries [1-4]. There have been many studies that demonstrated various influences of weight gain and body fat distribution on the onset of diabe- tes, with differences reported according to age, gender, and ethnic group [5-7]. In the general population, men are less obese but are more vulnerable to abdominal obesity and show
an increased risk of cardiovascular disease (CVD) and diabe- tes compared with women [7-9]. Although there is some vari- ability, both men and women gain progressively more fat as they age [10].
Patients with diabetes are in a well-known high-risk group for CVD [11]. In the nondiabetic population, men generally have a greater relative risk of CVD than women [9]. However, this gender difference in CVD risk is lessened in diabetic groups [12-14], and there have been several studies demonstrating that the relative risk of CVD in type 2 diabetes is greater in women http://dx.doi.org/10.4093/dmj.2014.38.1.74
pISSN 2233-6079 · eISSN 2233-6087
than men [15,16]. The cause of the greater increase of relative CVD risk in diabetic women compared with diabetic men is not fully understood. Some propose that the findings may be explained as a result of differing adverse effects of diabetes on cardiovascular risk profiles, differing treatment intensity, or differing changes of metabolic parameters during transition from nondiabetes to diabetes between men and women [17-21].
The purpose of this study is to evaluate whether gender dif- ferences in adiposity exist and to gain a better understanding regarding how these differences relate to insulin resistance and the time of diabetes diagnosis according to age and sex in an adult Korean newly diagnosed diabetes population.
METHODS
Study subjects
The data from the Korea National Health and Nutrition Ex- amination Survey (KNHANES) conducted from 2007 to 2010 by the Korea Centers for Disease Control and Prevention were used. A total of 33,829 subjects between the ages of 20 and 85 years were included. The survey was performed in three parts:
1) a health interview survey, 2) a health examination survey, and 3) a nutrition survey. The KNHANES is a nationwide study of a noninstitutionalized population and used a stratified and multistage probability sampling design with a rolling survey sampling model. The sampling units were based on household unit data from the 2005 National Census Registry, which in- cludes age, sex, and geographic area. Using a structured ques- tionnaire, trained staff members conducted in person interviews of all subjects.
Subjects who were at high-risk for steroid use with conditions such as bronchial asthma, allergic disease, and autoimmune disease like rheumatoid arthritis were excluded. Subjects with cancer, pregnancy or an infectious disease, such as tuberculo- sis or pneumonia, were also excluded. Those who showed an increased creatinine level greater than 1.5 mg/dL, serum bili- rubin greater than 2.0 mg/dL, or alanine aminotransferase (ALT) and aspartate aminotransferase (AST) greater than 100 U/L were also excluded. After exclusion, newly diagnosed dia- betes subjects were drawn secondarily from a total of 21,797 subjects. Newly diagnosed diabetes was defined by plasma glucose ≥126 mg/dL in the health examination survey with no reported previous history of diabetes in health interview survey. Lastly, we excluded subjects under the age of 30 years in order to reduce the possibility of including type 1 diabetes.
Finally, a total of 396 subjects (205 men and 191 women) were included in the present study (Fig. 1). The subjects were divid- ed into age groups, <40, 40 to <50, 50 to <60, 60 to <70, 70 to
<80, and ≥80 years, and into five groups by body mass index (BMI), <20, 20 to <25, 25 to <30, 30 to <35, and ≥35. The database showed no identifiable information, and all subjects provided written informed consent.
Anthropometric and biochemical measurements
A well-trained personnel member recorded the subjects’ mea- surements using predefined methods. The heights and weights were measured in centimeters and kilograms, respectively, while the subjects were wearing light clothing and no shoes. Systolic blood pressure (SBP) and diastolic blood pressure (DBP) were measured three times for each subject using a mercury sphyg- momanometer (Baumanometer; W. A. Baum Co., Inc., Co- piague, NY, USA) after the subject had rested in a sitting posi- tion for at least 5 minutes. Average blood pressure values of the second and third measurements were used for analysis.
Waist circumference (WC) was measured at the horizontal midline between the lower costal margin and iliac crest at the end of inspiration. Total body fat (%) was measured by whole body dual-energy X-ray absorptiometry using a QDR Discov- ery fan beam densitometer (Hologic Discovery; Hologic Inc., Bedford, MA, USA).
33,829 Subjects from KNHANES 2007-2010
21,797 Subjects
402 Subjects
396 Subjects (M:F, 205:191) were analyzed
Newly diagnosed diabetes subjects were selected by predefined criteria
Age under 30 years were excluded
12,030 Subject were excluded by following criteria
■ High risk groups of steroid use:
rheumatoid arthritis, bronchial asthma
■ History of cancer treatment
■ Pregnancy
■ Active infection:
active pulmonary tuberculosis, pneumonia
■ Biochemical evidence of renal and liver disease:
Cr >1.5, bilirubin >2, AST/ALT >2.5 normal value
Fig. 1. Selection and enrollment of study subjects. KNHANES, Korea National Health and Nutrition Examination Survey; CR, creatinine; AST/ALT, aspartate aminotransferase/alanine ami- notransferase; M, male; F, female.
Blood samples were drawn in the fasting state after a mini- mum 8-hour fast. The fasting blood glucose (FBG), total cho- lesterol (TC), high density lipoprotein cholesterol (HDL-C), triglyceride (TG), low density lipoprotein cholesterol (LDL- C), AST, ALT, and creatinine levels were measured enzymati- cally using a Hitachi Automatic Analyzer 7600 (Hitachi, To- kyo, Japan) at the Central Testing Institute in Seoul, Korea.
Glycated hemoglobin (HbA1c) levels were measured by high performance liquid chromatography using HLC-723G7 (Tosoh, Tokyo, Japan). Serum insulin levels were measured by immu- noradiometric assay using the 1470 Wizard Gamma Counter (PerkinElmer, Turku, Finland). The coefficient of variation of the assays for serum insulin was 1.2%. Urine microalbumin levels were measured by turbidimetric assay using a Hitachi Automatic Analyzer 7600 (Hitachi). Insulin resistance and pancreatic β-cell function were calculated using the homeo- stasis model assessment of insulin resistance (HOMA-IR) and HOMA β-cell by the following respective formulas [22]:
HOMA-IR=[fasting insulin (μU/mL)×fasting plasma glu- cose (mmol/L)]/22.5
HOMA β-cell=fasting insulin (μU/mL)/[fasting plasma glucose (mmol/L)-3.5]
Statistical analysis
Data are presented as mean±standard deviation unless other- wise stated. In order to compare baseline clinical characteris- tics, t-tests, and general linear models (f-test) were used. Anal- ysis of variance was used to compare the means of men and women by age and BMI group. Analysis of covariance was used to compare the age and BMI of subjects between men and women after adjusting for covariates. Linear regression analy- sis was used to reveal the linear association of BMI and age for each sex, and we construct a regression equation for each sex.
All statistical tests were two-tailed, P<0.05 was considered sta- tistically significant and 95% confidence limits for each vari- able were given. Data were analyzed using SPSS version 18.0 (IBM Co., Armonk, NY, USA).
RESULTS
A total of 396 subjects (1.8%) were newly diagnosed with type 2 diabetes from a population of 33,829 standard subjects in Korea. These subjects included 205 men (51.8%) and 191 wom- en (48.2%). The baseline characteristics of newly diagnosed dia- betes patients by sex are presented in Table 1. The mean age of
newly diagnosed diabetes was 58.5 years in women and 55.1 years in men, and this difference is statistically significant (P=
0.015). Mean BMI, whole body fat, TC, TG, LDL-C, non-HDL- C, white blood cell count, and DBP were different between men and women. However, mean WC, SBP, FBG, and HbA1c did not differ between men and women.
Regarding both HOMA-IR and HOMA-β, all of those val- ues, being unadjusted for age, adjusted for age, and adjusted for age, BMI, and WC, were significantly higher in women than in men (Table 2).
The mean BMI at the time of diabetes diagnosis was higher in women than in men (26.13±3.59 and 25.05±25.05, respec- tively; P=0.001) (Table 1). Estimated BMI by age was 29.608- 0.059×age (year) (95% confidence interval [CI], -0.095 to -0.023;
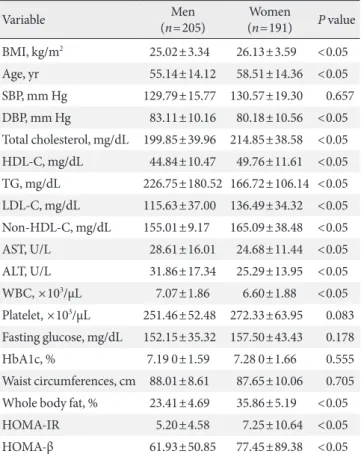
Table 1. Baseline characteristics of newly diagnosed Korean diabetes subjects
Variable Men
(n=205) Women
(n=191) P value BMI, kg/m2 25.02±3.34 26.13±3.59 <0.05 Age, yr 55.14±14.12 58.51±14.36 <0.05 SBP, mm Hg 129.79±15.77 130.57±19.30 0.657 DBP, mm Hg 83.11±10.16 80.18±10.56 <0.05 Total cholesterol, mg/dL 199.85±39.96 214.85±38.58 <0.05 HDL-C, mg/dL 44.84±10.47 49.76±11.61 <0.05 TG, mg/dL 226.75±180.52 166.72±106.14 <0.05 LDL-C, mg/dL 115.63±37.00 136.49±34.32 <0.05 Non-HDL-C, mg/dL 155.01±9.17 165.09±38.48 <0.05 AST, U/L 28.61±16.01 24.68±11.44 <0.05 ALT, U/L 31.86±17.34 25.29±13.95 <0.05 WBC, ×103/μL 7.07±1.86 6.60±1.88 <0.05 Platelet, ×103/μL 251.46±52.48 272.33±63.95 0.083 Fasting glucose, mg/dL 152.15±35.32 157.50±43.43 0.178
HbA1c, % 7.19 0±1.59 7.28 0±1.66 0.555
Waist circumferences, cm 88.01±8.61 87.65±10.06 0.705 Whole body fat, % 23.41±4.69 35.86±5.19 <0.05
HOMA-IR 5.20±4.58 7.25±10.64 <0.05
HOMA-β 61.93±50.85 77.45±89.38 <0.05 Values are presented as mean±standard deviation.
BMI, body mass index; SBP, systolic blood pressure; DBP, diastolic blood pressure; HDL-C, high density lipoprotein cholesterol; TG, tri- glyceride; LDL-C, low density lipoprotein cholesterol; AST, aspartate aminotransferase; ALT, alanine aminotransferase; WBC, white blood cell; HbA1c, glycated hemoglobin; HOMA-IR, homeostasis model assessment of insulin resistance; HOMA-β, homeostasis model as- sessment of β-cell function.
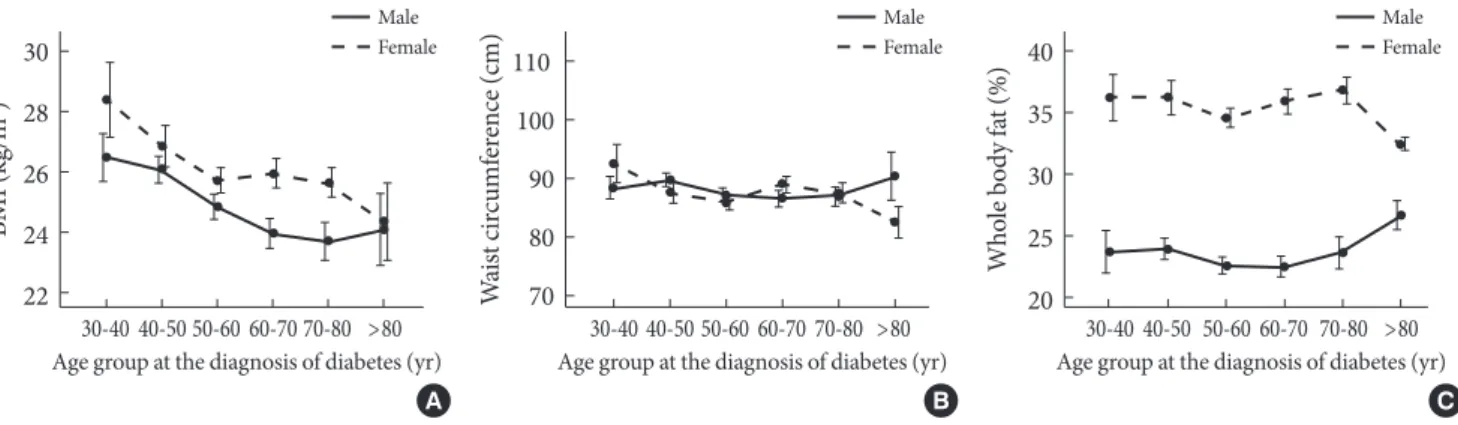
P=0.002) in women and 29.015-0.072×age (year) (95% CI, -0.105 to 0.039; P<0.001) in men according to linear regres- sion analysis. The higher BMI in women than men at the onset of diabetes was consistent throughout all age groups, and BMI was inversely related to age in both genders (Fig. 2). The mean WC was not different by sex or age in men and showed mar- ginal significance by age in women (data not shown, P=0.038) (Fig. 2). Whole body fat content was consistently higher in women than in men but not different across age groups (Fig. 2).
The mean age of diabetes diagnosis was consistently and sig- nificantly older in women than men belonging to similar BMI groups, except when the BMI was less than 25 kg/m2 (Fig. 3).
DISCUSSION
All of the subjects enrolled in this study were newly diagnosed
with diabetes; therefore, none had attempted any lifestyle in- tervention or drug treatment to impact body weight, blood glucose, or insulin resistance.
The results from this study demonstrate an inverse relation- ship between average BMI and age of newly diagnosed diabe- tes subjects. Both men and women showed similar inverse re- lationships between BMI and the age of diabetes diagnosis.
Such inverse relationships were previously similarly reported in Scottish and United States populations [23,24]. The steep- ness of linear regression slope is slightly greater in men (calcu- lated slope -0.059 [95% CI, -0.095 to -0.023] in women; -0.072 [95% CI, -0.105 to -0.039] in men; P<0.001) in this study. This result is different from that of a previous study, which revealed
BMI (kg/m2 ) 30 28 26 24
22 30-40 40-50 50-60 60-70 70-80 >80 Age group at the diagnosis of diabetes (yr)
A Male Female
Waist circumference (cm)
110 100 90 80
70 30-40 40-50 50-60 60-70 70-80 >80 Age group at the diagnosis of diabetes (yr)
B Male Female
Fig. 2. Distribution of mean (A) body mass index (BMI), (B) waist circumference, and (C) whole body fat content by age group at the diagnosis of diabetes. The solid lines represent data for men, and dotted lines represent data for women. Vertical bars re- veal standard error around the mean.
Whole body fat (%)
40 35 30 25
20 30-40 40-50 50-60 60-70 70-80 >80 Age group at the diagnosis of diabetes (yr)
C Male Female
Table 2. Age-adjusted means±standard error of HOMA-IR and HOMA-β in newly diagnosed Korean diabetes subjects
Variable Men Women P value
HOMA-IR 5.29±0.57 7.15±0.59 0.006
Unadjusteda 5.20±0.32 7.25±0.77 0.012
Adjustedb 5.34±0.59 7.12±0.61 0.018
HOMA-β 65.19±5.14 76.64±5.32 0.005
Unadjusteda 61.93±3.55 77.45±6.47 0.033 Adjustedb 63.40±5.25 75.81±5.43 0.005 Values are presented as mean±standard error.
HOMA-IR, homeostasis model assessment of insulin resistance;
HOMA-β, homeostasis model assessment of β-cell function.
aUnadjusted, age unadjusted value; bAdjusted, age, body mass index and waist circumference adjusted values.
Fig. 3. Distribution of mean age of newly diagnosed diabetes by body mass index (BMI) group. The solid line indicates the mean age at diagnosis of diabetes in men, and the dotted line repre- sents the mean age of diagnosis in women. Vertical bars repre- sent standard error around the mean. Across BMI groups, the average diagnostic ages of diabetes are higher in women than men.
Age (yr)
80 70 60 50 40 30
<20 20 to <25 25 to <30 30 to <35 ≥35 BMI group (kg/m2)
Male Female
a steeper inverse relationship in women than in men (-0.18 [95%
CI, -0.18 to -0.17] in women; -0.12 [95% CI, -0.13 to -0.12] in men) [23]. The mean BMI at the time of diagnosis of diabetes in Koreans was reported to be around 25 kg/m2, while it is typ- ically around 32 kg/m2 in Scottish and 35 kg/m2 in American populations [23,24]. This distinction might be due to an ethnic difference of adiposity. In those with similar body mass indi- ces, Eastern populations demonstrate higher visceral obesity, higher insulin resistance, and higher risk of metabolic disease than do Western populations [6]. In addition, sexual differ- ence of adiposity can be different in various ethnic groups [5].
Men were diagnosed with diabetes at a younger age than women at a given BMI throughout all age groups in this study.
This suggests that men are more vulnerable to development of diabetes than women at the same degree of obesity. This find- ing is supported by a previous study that demonstrated that the prevalence of diabetes in middle-aged men is higher than that in similarly aged women, although the prevalence of obe- sity in middle-aged men is lower than in women [9]. We can assume from this that men are more insulin resistant and tend to develop diabetes more often at a similar degree of obesity, as calculated by BMI.
Higher insulin resistance in diabetic women than diabetic men is demonstrated in this study, and it was sustained even after adjusting for age and adiposity, including BMI and WC.
This increased insulin resistance in female diabetic patients was also demonstrated in a previous study and is associated with a relatively increased risk of CVD in diabetes compared to male diabetic subjects [21].
This study also demonstrated that the average BMI and whole body fat content of women were higher than those of men, but the average WC at the time of diabetes diagnosis was similar (approximately 88 cm) in both genders in this study throughout most age groups (except for women older 80 years, who showed significant differences compared with other age groups in post hoc analysis, data not shown). In general, BMI represents general obesity and WC represents visceral or ab- dominal obesity. From the results of this study, it appears that Korean women tend to possess more fat than men of a similar age when diagnosed with diabetes, and the predominant site of fat accumulation in Korean women might not be the abdo- men. Female tendency for subcutaneous fat deposition is a well-known phenomenon, and differences of fat distribution are associated with differences in insulin resistance and onset of diabetes [7,8,25,26]. The reason for the similar WC at the
time of diabetes diagnosis despite different whole body fat con- tent and BMI in this study is not clear, and it is difficult to gener- alize this observation on the base of this one set of data. Further study is needed to confirm this finding and clarify the causes.
As previously mentioned, the average WC at the diagnosis of diabetes was similar in most age groups, contrary to the higher average BMI of women than men in most age groups in this study. Most academic societies recommend different cri- teria for WC relative to increased risk of cardiometabolic dis- orders for men and women. Most define higher cutoff points for men; for example, >102 cm for men and >88 cm for wom- en in Western countries according to National Cholesterol Ed- ucation Program and ≥90 cm for men and ≥80 cm for women in Asian countries according to International Diabetes Federa- tion guidelines [27,28]. One exception is a Japanese criterion that defines the cutoff value of a larger WC in women (≥85 cm for men and ≥90 cm for women) [29]. Conversely, most aca- demic societies use the same BMI to indicate increased risk of cardiometabolic disorders in both sexes, 30 kg/m2 for Western countries and 25 kg/m2 for Asian populations [30,31]. The re- sults of the present study demonstrated no gender- or age-re- lated differences in WC and strong gender- and age-related differences in BMI at the time of diabetes diagnosis in a Kore- an population. Although the cross-sectional nature of this study and small number of subjects limited to Korea restrict generalization of these findings, there have been many reports that suggest similar gender differences of adiposity/obesity [32-34]. Men tend to develop diabetes at younger age, are more insulin resistant and have larger WC at any given BMI than women, suggesting that men are globally and generally vul- nerable to weight gain when using the same BMI criteria of obesity for both sexes [7,32-34]. We pay attention to adiposity/
obesity as defined by BMI because obesity increases insulin resistance and the risk of related cardiometabolic disorders such as diabetes. If the definitions of overweight and obesity should be formed on the basis of increased risk of cardiometa- bolic disorders, this study suggest that BMI cutoffs for over- weight and obesity could be defined differently according to gender, similar to the different cutoff values of WC for men and women. Further study will be needed to clarify this sug- gestion.
This study has several limitations. Although subjects were selected from a strictly randomized general population, the number of study subjects is relatively small, especially in the age groups older than 70 and younger than 40 years. This may
affect the results, but the trends in those groups are consistent with other age groups, and the results are not expected to change by adding more subjects. Due to the cross-sectional nature of this study, the causal relationship between adiposity and diagnosis of diabetes according to aging and gender is dif- ficult to demonstrate. Further prospective studies are needed.
I did not analyze the effects of smoking or menopause on adi- posity or their relationships with diabetes diagnosis according to gender. Smoking is known as a contributing factor to obesi- ty and diabetes, but previous reports have not shown any defi- nite confounding effects of smoking on the relationship be- tween adiposity and diabetes onset in both sex groups accord- ing to age [23]. Changes in levels of sex steroids, especially es- trogen changes due to menopause in women, can have an ef- fect on adiposity and diabetes onset, but the trends of adiposi- ty/obesity are consistent across age groups in both genders, and the effect of menopause is not the main concern of this study [35].
In spite of these limitations, there are many strengths of this study. This is the first study that demonstrates the inverse rela- tionship between BMI and the diagnostic age of diabetes and the higher BMI of women than men throughout most age groups at the time of diabetes diagnosis in a Korean adult population using national representative data.
In conclusion, Korean women are diagnosed with type 2 di- abetes at higher BMIs and at older ages than Korean men, and these women are more insulin resistant than men at the time of diagnosis of diabetes. These findings may help explain why women with diabetes have a more greatly increased risk of CVD compared with their nondiabetic counterparts than do men with diabetes compared with their nondiabetic counter- parts. Additionally, this study suggests that BMI cutoffs for overweight and obesity could be defined differently according to gender in Korea, similar to the different cutoff values of WC for men and women.
CONFLICTS OF INTEREST
No potential conflict of interest relevant to this article was re- ported.
REFERENCES
1. Engelgau MM, Geiss LS, Saaddine JB, Boyle JP, Benjamin SM, Gregg EW, Tierney EF, Rios-Burrows N, Mokdad AH, Ford
ES, Imperatore G, Narayan KM. The evolving diabetes burden in the United States. Ann Intern Med 2004;140:945-50.
2. van Dieren S, Beulens JW, van der Schouw YT, Grobbee DE, Neal B. The global burden of diabetes and its complications: an emerging pandemic. Eur J Cardiovasc Prev Rehabil 2010;17 Suppl 1:S3-8.
3. Yoon KH, Lee JH, Kim JW, Cho JH, Choi YH, Ko SH, Zimmet P, Son HY. Epidemic obesity and type 2 diabetes in Asia. Lan- cet 2006;368:1681-8.
4. Ramachandran A, Ma RC, Snehalatha C. Diabetes in Asia.
Lancet 2010;375:408-18.
5. Lear SA, Humphries KH, Kohli S, Chockalingam A, Frohlich JJ, Birmingham CL. Visceral adipose tissue accumulation dif- fers according to ethnic background: results of the Multicul- tural Community Health Assessment Trial (M-CHAT). Am J Clin Nutr 2007;86:353-9.
6. Misra A, Khurana L. Obesity-related non-communicable dis- eases: South Asians vs White Caucasians. Int J Obes (Lond) 2011;35:167-87.
7. Geer EB, Shen W. Gender differences in insulin resistance, body composition, and energy balance. Gend Med 2009;6 Suppl 1:60-75.
8. Kanter R, Caballero B. Global gender disparities in obesity: a review. Adv Nutr 2012;3:491-8.
9. Lipscombe LL, Hux JE. Trends in diabetes prevalence, inci- dence, and mortality in Ontario, Canada 1995-2005: a popula- tion-based study. Lancet 2007;369:750-6.
10. Evans WJ, Campbell WW. Sarcopenia and age-related changes in body composition and functional capacity. J Nutr 1993;123(2 Suppl):465-8.
11. Almdal T, Scharling H, Jensen JS, Vestergaard H. The indepen- dent effect of type 2 diabetes mellitus on ischemic heart dis- ease, stroke, and death: a population-based study of 13,000 men and women with 20 years of follow-up. Arch Intern Med 2004;164:1422-6.
12. Becker A, Bos G, de Vegt F, Kostense PJ, Dekker JM, Nijpels G, Heine RJ, Bouter LM, Stehouwer CD. Cardiovascular events in type 2 diabetes: comparison with nondiabetic individuals without and with prior cardiovascular disease. 10-year follow- up of the Hoorn Study. Eur Heart J 2003;24:1406-13.
13. Juutilainen A, Kortelainen S, Lehto S, Ronnemaa T, Pyorala K, Laakso M. Gender difference in the impact of type 2 diabetes on coronary heart disease risk. Diabetes Care 2004;27:2898-904.
14. Natarajan S, Liao Y, Cao G, Lipsitz SR, McGee DL. Sex differ- ences in risk for coronary heart disease mortality associated
with diabetes and established coronary heart disease. Arch In- tern Med 2003;163:1735-40.
15. Lee WL, Cheung AM, Cape D, Zinman B. Impact of diabetes on coronary artery disease in women and men: a meta-analy- sis of prospective studies. Diabetes Care 2000;23:962-8.
16. Huxley R, Barzi F, Woodward M. Excess risk of fatal coronary heart disease associated with diabetes in men and women: me- ta-analysis of 37 prospective cohort studies. BMJ 2006;332:73-8.
17. Howard BV, Cowan LD, Go O, Welty TK, Robbins DC, Lee ET. Adverse effects of diabetes on multiple cardiovascular dis- ease risk factors in women. The Strong Heart Study. Diabetes Care 1998;21:1258-65.
18. Wexler DJ, Grant RW, Meigs JB, Nathan DM, Cagliero E. Sex disparities in treatment of cardiac risk factors in patients with type 2 diabetes. Diabetes Care 2005;28:514-20.
19. Kautzky-Willer A, Kamyar MR, Gerhat D, Handisurya A, Ste- mer G, Hudson S, Luger A, Lemmens-Gruber R. Sex-specific differences in metabolic control, cardiovascular risk, and in- terventions in patients with type 2 diabetes mellitus. Gend Med 2010;7:571-83.
20. Gobl CS, Brannath W, Bozkurt L, Handisurya A, Anderwald C, Luger A, Krebs M, Kautzky-Willer A, Bischof MG. Sex-spe- cific differences in glycemic control and cardiovascular risk factors in older patients with insulin-treated type 2 diabetes mellitus. Gend Med 2010;7:593-9.
21. Wannamethee SG, Papacosta O, Lawlor DA, Whincup PH, Lowe GD, Ebrahim S, Sattar N. Do women exhibit greater dif- ferences in established and novel risk factors between diabetes and non-diabetes than men? The British Regional Heart Study and British Women’s Heart Health Study. Diabetologia 2012;
55:80-7.
22. Matthews DR, Hosker JP, Rudenski AS, Naylor BA, Treacher DF, Turner RC. Homeostasis model assessment: insulin resis- tance and beta-cell function from fasting plasma glucose and insulin concentrations in man. Diabetologia 1985;28:412-9.
23. Logue J, Walker JJ, Colhoun HM, Leese GP, Lindsay RS, McK- night JA, Morris AD, Pearson DW, Petrie JR, Philip S, Wild SH, Sattar N; Scottish Diabetes Research Network Epidemiol- ogy Group. Do men develop type 2 diabetes at lower body mass indices than women? Diabetologia 2011;54:3003-6.
24. Hillier TA, Pedula KL. Characteristics of an adult population
with newly diagnosed type 2 diabetes: the relation of obesity and age of onset. Diabetes Care 2001;24:1522-7.
25. Meisinger C, Doring A, Thorand B, Heier M, Lowel H. Body fat distribution and risk of type 2 diabetes in the general popu- lation: are there differences between men and women? The MONICA/KORA Augsburg cohort study. Am J Clin Nutr 2006;84:483-9.
26. Wei M, Gaskill SP, Haffner SM, Stern MP. Waist circumference as the best predictor of noninsulin dependent diabetes mellitus (NIDDM) compared to body mass index, waist/hip ratio and other anthropometric measurements in Mexican Americans: a 7-year prospective study. Obes Res 1997;5:16-23.
27. Expert Panel on Detection, Evaluation, and Treatment of High Blood Cholesterol in Adults. Executive summary of the third report of The National Cholesterol Education Program (NCEP) expert panel on detection, evaluation, and treatment of high blood cholesterol In adults (Adult Treatment Panel III). JAMA 2001;285:2486-97.
28. Alberti KG, Zimmet P, Shaw J. Metabolic syndrome: a new world-wide definition. A Consensus Statement from the Inter- national Diabetes Federation. Diabet Med 2006;23:469-80.
29. Definition and the diagnostic standard for metabolic syndrome:
committee to evaluate diagnostic standards for metabolic syn- drome. Nihon Naika Gakkai Zasshi 2005;94:794-809.
30. World Health Organization. Obesity: preventing and manag- ing the global epidemic: report of the WHO Consultation of Obesity. Geneva: World Health Organization; 2000.
31. WHO Expert Consultation. Appropriate body-mass index for Asian populations and its implications for policy and interven- tion strategies. Lancet 2004;363:157-63.
32. Power ML, Schulkin J. Sex differences in fat storage, fat metab- olism, and the health risks from obesity: possible evolutionary origins. Br J Nutr 2008;99:931-40.
33. Shi H, Seeley RJ, Clegg DJ. Sexual differences in the control of energy homeostasis. Front Neuroendocrinol 2009;30:396-404.
34. Nedungadi TP, Clegg DJ. Sexual dimorphism in body fat dis- tribution and risk for cardiovascular diseases. J Cardiovasc Transl Res 2009;2:321-7.
35. Fuente-Martin E, Argente-Arizon P, Ros P, Argente J, Chowen JA. Sex differences in adipose tissue: it is not only a question of quantity and distribution. Adipocyte 2013;2:128-34.