An Usefulness of h T -index for Topic Preference Measurement
Yeseul Song (송예슬)**
Ji-Hong Park (박지홍)***
Jiyoung Shim (심지영)****
Contents 1. Introduction
2. Literature Review 3. Methods
3.1 Data Source 3.2 Procedure 4. Results
4.1 Comparing h-type Indices on Web contents
4.2 The h T -index on Web contents 4.3 Evaluating contents using the
h T -index and Pathfinder Network Analysis
5. Discussion and Conclusion
ABSTRACT
The purpose of this study is to suggest an appropriate index for evaluating preferences of Web contents by examining the h-index and its variants. It focuses on how successfully each index represents relative user preference towards topical subjects. Based on data obtained from a popular IT blog (engadget.com), subject values of the h-index and its variants were calculated using 53 subject categories, article counts and the ‘Likes’ counts aggregated in each category. These values were compared through critical analysis of the indices and Spearman rank correlation analysis. A PFNet (Pathfinder Network) of subjects weighted by h T values was drawn and cluster analysis was conducted. Based on the four criteria suggested for the evaluation of Web contents, we concluded that the h T -index is a relatively appropriate tool for the Web contents preference evaluation. The h T -index was applied to visually represent the relative weight (topic preference by user ‘Likes’ count) for each subject category of the real online contents after suggesting the relative appropriateness of the h T -index. Applying scientometric indicators to Web information could provide new insights into, and potential methods for, Web contents evaluation.
In addition, information on the focus of users’ attention would help online informants to plan more effective content strategies. The study tries to expand the application area of the h-type indices to non-academic online environments. The research procedure enables examination of the appropriateness of the index and highlights considerations for applying the indicators to Web contents.
Keywords: Web Contents Evaluation, Preference Measurement, Tapered h-index, h T -index, h-type Indices
*
**
***
****
본 연구는 한국연구재단 BK21 플러스 지원을 받았음.
연세대학교 문헌정보학과 석사과정([email protected]) (제1저자) 연세대학교 문헌정보학과 부교수([email protected]) (교신저자) 연세대학교 문헌정보학과 강사([email protected]) (공동저자)
논문접수일자: 2015년 4월 16일 최초심사일자: 2015년 4월 23일 게재확정일자: 2015년 5월 6일
한국문헌정보학회지, 49(2): 27-49, 2015. [http://dx.doi.org/10.4275/KSLIS.2015.49.2.027]
1. Introduction
Digital technologies have become everyday environment. The Web has already been a stabilized tool for business services and marketing. It enables individuals to participate in exchanging their ideas and opinions through various social media. Such social interactions are so common that a large volume of the interactive data is archived and openly available. A typical phenomenon in Web information sharing is that users express their opinions toward content through the interactions with other people as well as the content itself. Writing a feedback post for a specific piece of content (‘Replies’), putting a short message as a response (‘Comments’), taking posts to users’
own online space (‘Trackbacks’), ‘Retweets’ in twitter, and ‘Likes’ in Facebook are examples of this phenomenon.
Abundance of Web information led to increased level of studies on ranking methods for the discernment of information resources. Recently, user-generated data are utilized, which comes in recognition of their value. While earlier studies of this kind use page views and links count (e.g., Wang, Zhang, Ru and Ma 2008), more recent studies report that social media user-generated data have less noise and more reliable than page views and links count (e.g., Shuai, Liu and Bollen 2012; McCreadie, Macdonald and Ounis 2010). The ‘Like’ icon, in a shape of a ‘thumbs up’ is displayed on considerable number of websites. By clicking ‘Like’, users can simply show an affirmative gesture toward a specific piece of content. This icon has now been adopted, not only by blogs, business, and news websites, but also by public office sites and government homepages.
It is also considered as an influential indicator in Web cotents (Timian, Rupcic, Kachnowski and Luisi 2013; Kevin, Jason, Marco, Andreas and Nicholas 2008).
Regarding the evaluation of scholarly research, there has been a long tradition of developing and applying indicators to evaluate research in the area of scientometrics. Over the past decade, the h-index, introduced by Hirsch (2005), has become one of the most prevalent indicators of scientific research performance. It has received high recognition for its simplicity and performance.
Several studies on the h-index variants and their applications reflect its popularity. One characteristic of the h-index is that it is not influenced by papers with a low number of citations or by the continuous increase in citations of already very highly cited papers (Egghe 2010). While this characteristic, so-called “robustness”, was proposed as a strength of the h-index (Hirsch 2005), other scholars agreed that it is rather a drawback, and referred to it as “insensitivity” (Egghe 2006; Jin, Rousseau and Egghe 2007).
While there is a common topic between the two areas of Web contents evaluation and research
evaluation, few studies have applied scientometric indicators in the Web contents ranking. The h-index has been applied to various areas and there is an abundance of h-index application studies that evaluate researchers, research groups, journals, topics, compounds, different countries and aggregations. Nevertheless, most studies focus on academic areas and use citation counts of authors or journals. There are few studies on the web environment, although information evaluation on the Web is significant. We found out only one study on this context. Hovden (2013) reported on the evaluation of video creators’ popularity by applying the h-index and g-index to hits on Youtube videos. The study estimated the potential application of the h- and g-indices to the Web environment, which has significance as the first mover, however it failed to evaluate the effectiveness of these indices on analyzing data from Web environments. Our study used Facebook ‘Likes’
to evaluate Web contents on one of the most influential information technology blogs (Engadget).
We assumed that these user-generated responses provide credible information about users’ preferences for content, more accurately than mechanical records like hits or access logs. Based on our literature review, it seems this is the first attempt to use ‘Likes’ data for the evaluation of user preferences by applying h-type indices.
Considering the lack of studies on Web contents evaluation and the potential of h-index as an evaluation indicator, it is necessary to seek an appropriate evaluation index for the Web-based online communication data. Thus, this study aims to suggest an appropriate index for evaluating Web contents by examining the original h-index and its variants. Specifically, Web contents topic preferences are measured by using h-type indices. The topic preference is similar as topic popularity however it considers both quality and productivity as like h-index. Each topic consists of a number of postings and ‘Likes.’ While the degree of popularity can be operationalized as the ‘Likes’ count, the h-index-based topic preference in a certain topic can be used as the maximum rank value of postings in the topic whose ‘Likes’ count is greater or equal to the rank value. It can be expressed as following:
topic preference = max{j: Likes j ≥ j} where Likes j is the number of ‘Likes’ in jth posting.
Like this, the topic preference can be measured by using other h-type indices. This study compares the h-type variants in this sense. The variants compared are the g-index (Egghe 2006), the A-index (Jin 2006), the R-index (Jin, Rousseau and Egghe 2007), the hg-index (Alonso et al. 2010), and the tapered h-index (h
T
-index) (Anderson, Hankin and Killworth 2008). The findings indicate that among these indicators, the hT
-index shows an useful ability to represent the topic preference.The following procedures were performed in this study: (1) the essential requirements of a Web contents evaluator were drawn by comparing h-type indices. (2) the reasons that the h
T
-index is appropriate as an Web contents evaluator were derived, based on the features of the hT
-index and the hT value of real data. The popularity of each topic in Engadget (http://engadget.com), one of the most influential IT blogs on the Internet, was evaluated. (3) Using the hT
-index values as weights, PFNet was visualized. Also, clustering was conducted and the hT
-index for each cluster was calculated.2. Literature Review
There have been various attempts to employ user-generated data for evaluating the Web content.
Most commonly, page view is a means of measuring users’ attention. A well-known web ranking service, Alexa (www.alexa.com) adopts this data for evaluating website popularity. In academia, Wikipedia’s ranking and online news ranking algorithm are proposed based on the page view statistics (Wang et al. 2008; Laurent and Vickers 2009). Several other content rating studies use user response data as well. The comment, exemplary data of user response, created by the viewer of the Web content is used for evaluating video contents. Murakami and Ito (2011) suggest a new ranking method for a video-sharing website by using emotional words extracted from the user comments. Davidson et al. (2010) utilize the comment data for developing a YouTube recom- mendation system. Similarly, another type of user response data, the ‘tweet’ is utilized, mainly for online news ranking. Shuai et al. (2012) propose a voting model based on the tweet data for evaluate Google News and Yahoo News. Zhang et al. (2013) suggest a news ranking algorithm using tweet data.
More specifically, preference data, revealing positive attitudes toward the Web content, has been mainly concerned with the quality of Web content (e.g., Timian et al. 2013; Wiyartanti et al. 2008; Davidson et al. 2010). For example, users can express their preference or support for certain content via Web content voting system such as ‘likes’ or ‘five stars’. And the data can be employed for developing content ranking algorithm (e.g., Wiyartanti et al. 2008) or recom- mendation system (e.g., Davidson et al. 2010).
Notwithstanding serious attempts in this direction, there is still no general indicator of Web content. Some webometric indicators (e.g., Web Impact Factor (WIF), PageRank) have been suggested for Web content, mainly based on Web link structure (Thelwall et al. 2005; Noruzi 2006; Page
et al. 1999; Markscheffel and Eine 2012). For example, WIF considers hyperlinks (inlinks and self-link pages) citations and is the adaptation of the Journal Impact Factor for the Web. Yet, such Web content indicators based on link structure is that the unit of evaluation is the web sites consisting of web pages rather than single web page.
Recently, there is an application of bibliometric indicator for evaluating a single Web content.
Hovden (2013) tests h-index and g-index to see if each indicator can be used for evaluating Web video content (e.g., YouTube) by using ‘view counts’ instead of ‘citation’ data denoting
‘popularity’. However, the view count data is not good substitution for citation data. Rather,
‘like’ data is more analogous to citation in that it indicates that certain user approve of content (Bornmann and Marx 2014). Also, most evaluation indicator studies fail to the effectiveness of the indices.
Hence, and since the necessity of seeking an appropriate evaluation indicator for the Web content is obvious in today’s Web environment, we address at the following research questions:
1. What are essential properties for the evaluation of Web content topic preference?
2. Which Hirsch-type indices is more appropriate for Web content topic preference evaluation?
3. How well does the selected Hirsh-type indicator present the Web content ranking?
3. Methods
3.1 Data Source
Data were obtained from Engadget (http://engadget.com), a popular blog in a cutting-edge in- formation technology subject area. On this site are professional reviews of gadgets, electronics, science and technology, written by IT experts. The blog has produced meaningful articles steadily since 2004. We judged that the articles in the blog reflect IT trends accurately, considering its currency, topical content and high credibility. This blog generates 20-40 articles per day regularly.
Active updates of articles are regarded as a suitable condition for this research, with a sufficient number of articles and little gap between article publications. Due to these features, this blog was considered useful to determine the popularity of the topical subjects by analyzing data over a short period of time.
The present study expanded ‘cell’ and ‘element’ concepts to the Web. Conventional bibliometric
studies find relationships between certain units such as authors, journals, subjects, institutions, and nations by the means of an aggregated element such as articles published by an individual author. These units are referred to as ‘cells’ and the aggregated element as an ‘element.’ For example, in an author co-citation analysis, the ‘cell’ is the author and the ‘element’ is the article aggregated by author unit; in journal co-citation analysis, the ‘cell’ is the journal and the ‘element’
is the article aggregated by journal unit. In the present study, these ‘cell’ and ‘element’ concepts were applied to the online communication data from Engadget. In the Engadget site, each article has been pre-categorized into IT subjects and received ‘Likes’ counts from the readers. Thus, in this study, the cell was the subject and the element was the article aggregated by subject category.
The number of ‘Likes’ and the subjects included in the articles were collected: In most cases, an article belongs to multiple subjects. There are 55 IT subjects in “Engadget”, including ‘Mobile’,
‘Cellphones’, ‘Internet’, ‘Software’, ‘HD’ (high-definition video), and ‘Tablets’. The analysis was carried out on 53 subjects, and excluded two subjects (‘Meta’ and ‘Nikon’) that had no article at the time of the data collection. Each article was included in more than one subject category, as shown in Table 1. For example the article in the first row is categorized to both ‘Home Entertainment’ and ‘HD.’ The ‘Likes’ counts of this article were used for each of the two subjects respectively.
No Article Subjects
1 Netflix confirms May 26th launch date for new Arrested Development
season Home Entertainment, HD
2 AT&T announces plans for 1Gbps fiber service in Austin, Texas Internet, AT&T 3 Google Fiber is officially coming to Austin, Texas Internet, HD, Google 4 Samsung Galaxy Mega is official and comes in 6.3- and 5.8-inch
sizes Cellphones, Mobile, Samsung
5 Ericsson T28z review Cellphones, Mobile
<Table 1> Example of Articles in Multiple Subject Categories
3.2 Procedure
The data analysis consisted of two stages. Firstly, we chose appropriate indicators for Web contents evaluation. Based on the frequency of ‘Likes’ from each subject category of Engadget.com, user preferences, as measured by five h-type indices, were compared. The five h-type indices
were the original h-index and its variants: h
T
-index, g-index, A-index, and R-index. It is noticeable that the insensitivity problem of the original h-index was the main reason for the emergence of its variants. The variants were used to solve this insensitivity problem of the Web contents in this study. Definitions of each index are presented in Table 2.Secondly, we judged the ability of each index to effectively evaluate the Web contents that causes the insensitivity problem of the h-index. In order to judge the appropriateness, four criteria (see Table 5) were determined. Based on a comparative analysis using these four criteria, the h
T
-index was highlighted as appropriate, and its use in the evaluation of Web contents was examined.Throughout this procedure, total article counts, total ‘Likes’ counts, and the highest number of
‘Likes’ for each subject category were compared; and Spearman’s rank correlation analyses were conducted to examine correlations among the 5 indicators.
In the next stage, based on the fact that each article has more than one subject category, we calculated the co-occurrence frequencies of 53 subject categories. These co-occurrence frequencies were used to draw a Pathfinder Network (PFNet) (White 2003) and group the subjects into 8 clusters through Parallel Nearest Neighbor Clustering (PNNC) method (Lee 2006; Kim, Lee and Park 2009). The size of each node was calculated by the h
T
-index. Pajek software was used for the visualization.Index Definition
h-index “A scientist has index h if h of his or her Np papers have at least h citations each and the other (Np-h) papers have ≤h citations each.” (Hirsch 2005)
g-index “The highest number of g of papers that together receive g 2 or more citations (g 2 ≥h)”
(Egghe 2006)
A-index A = (cit=citation counts) [‘Sum of citation counts in the h-core’ / h]
R-index R = (cit=citation counts) [Square root of ‘sum of citation counts in the h-core’]
h T -index
h T(j) = , n j
≤j and h T(j) = +
, n j > j (j=rank, n j =citation counts) h T =
<Table 2> Definitions of the h-type indices
4. Results
4.1 Comparing h-type Indices on Web contents
For the purpose of choosing appropriate indices for Web contents evaluation, we applied the h-index, g-index, A-index, R-index and h
T
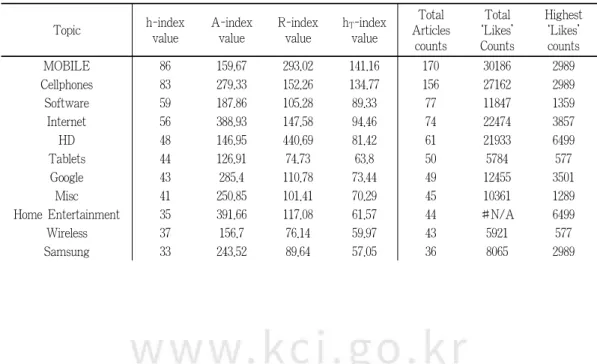
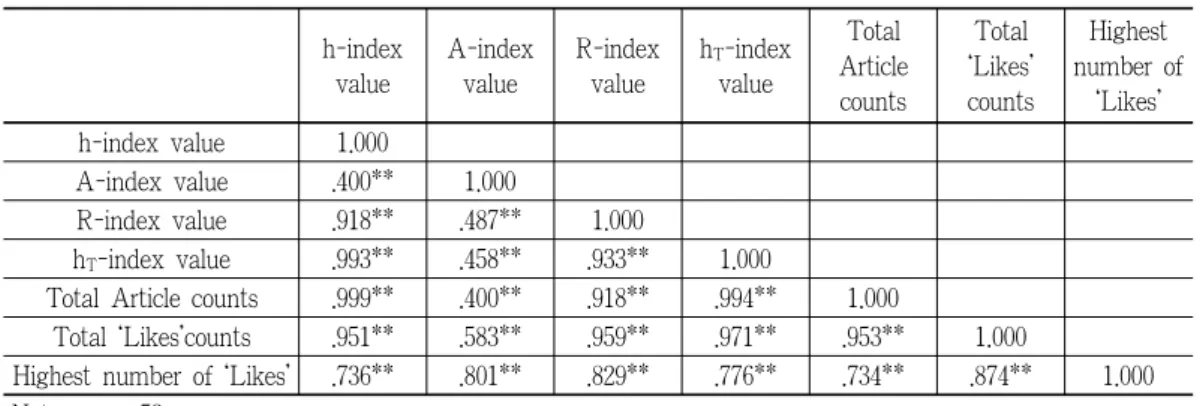
-index to the same data set gathered from Engadget.com.Table 3 shows the values from the four indicators, except the g-index, in 53 subject categories, and Table 4 presents the results of Spearman’s rank correlations among these four indicators. The article counts, ‘Likes’ counts and the highest number of ‘Likes’ are also included in both tables.
The g-index was developed to solve the insensitivity problem of the original h-index: it should be sensitive to the level of highly cited articles. In most academic research evaluation, the g-index generates meaningful results. The g-index value can be calculated by finding the highest rank for which the squared rank is equal to or less than the cumulative citation count (cumulative
‘Likes’ count in this study). However, in our data analysis, due to the extremely high popularity (average number of ‘Likes’ (citations) exceeds the total number of articles) of the 53 subject categories, the g-index was not adapted to generate valid values. Even in some subject categories, the single ‘Likes’ count of the highest-ranked article which had the smallest cumulative ‘Likes’
count was greater than the squared rank. Thus, for all 53 subjects, the g-index values were same as the number of articles, regardless of the ‘Likes’ counts. For this reason, the g-index was ruled out of our analyses in Table 3 and Table 4.
Topic h-index
value
A-index value
R-index value
h T -index value
Total Articles counts
Total
‘Likes’
Counts
Highest
‘Likes’
counts
MOBILE 86 159.67 293.02 141.16 170 30186 2989
Cellphones 83 279.33 152.26 134.77 156 27162 2989
Software 59 187.86 105.28 89.33 77 11847 1359
Internet 56 388.93 147.58 94.46 74 22474 3857
HD 48 146.95 440.69 81.42 61 21933 6499
Tablets 44 126.91 74.73 63.8 50 5784 577
Google 43 285.4 110.78 73.44 49 12455 3501
Misc 41 250.85 101.41 70.29 45 10361 1289
Home Entertainment 35 391.66 117.08 61.57 44 #N/A 6499
Wireless 37 156.7 76.14 59.97 43 5921 577
Samsung 33 243.52 89.64 57.05 36 8065 2989
<Table 3> Values of h-type indices and the Counts of Articles and ‘Likes’
(in the order of total article counts)
Topic h-index value
A-index value
R-index value
h T -index value
Total Articles counts
Total
‘Likes’
Counts
Highest
‘Likes’
counts
Gaming 31 188.68 76.48 53.62 31 5849 837
Facebook 26 269.08 83.64 52.17 29 7029 1359
HTC 28 153.43 65.54 51.98 29 4329 449
Peripherals 27 109.74 54.43 43.8 29 3013 302
Cameras 26 340.31 94.06 47.83 28 8882 2260
Science 27 302.30 90.34 53.11 27 8162 948
Transportation 25 258.28 80.36 46.52 25 6457 1596
ALT 24 80.89 272.08 45.6 24 6530 1596
Microsoft 23 161.65 60.98 40.52 23 3718 1047
Apple 22 132.18 53.96 39.16 22 2908 403
Sony 19 156.53 54.50 35.83 19 2974 713
AT&T 16 350.00 74.83 31.98 16 5600 3857
Desktops 16 110.69 42.08 29.6 16 1771 360
Displays 14 201.64 53.13 27.5 14 2823 1359
Laptops 14 106.86 38.68 25.6 14 1496 427
Portable Audio/Video 13 89.92 34.19 24.12 14 1169 302
Blackberry 11 104.82 33.96 22.62 11 1153 207
LG 11 87.82 31.08 21.48 11 966 181
Storage 11 228.36 50.12 24.63 11 2512 906
Wearables 11 124.55 37.01 23.23 11 1370 283
Announcements 10 32.76 107.3 20.91 10 1073 229
T-Mobile 10 142.1 37.7 22.21 10 1421 326
Networking 9 233 45.79 21.27 9 2097 763
Nokia 9 98 29.7 18.8 9 882 269
Sprint 9 150.33 36.78 20.1 9 1353 302
Robots 8 208 40.79 19 8 1664 728
Verizon 8 193.25 39.32 18.92 8 1546 577
ASUS 7 130.43 30.22 16.83 7 913 240
Handhelds 7 125.14 29.6 16.24 7 876 282
Podcasts 6 28.17 13 10.17 6 169 39
Intel 5 192.4 31.02 14.05 5 962 614
Amazon 4 200 28.28 11.11 4 800 475
AMD 4 134.25 23.17 10.56 4 537 225
GPS 4 204 28.57 11.15 4 816 475
Household 4 291.5 34.15 11.93 4 1166 739
Nintendo 4 213 29.19 11.64 4 852 376
HP 3 254.67 27.64 9.3 3 764 484
Lenovo 3 54.67 12.81 7.18 3 164 89
Dell 2 77 12.41 5.61 2 154 89
NVIDIA 2 78.5 12.53 5.57 2 157 107
Acer 1 89 9.43 3.22 1 89 89
Canon 1 61 7.81 3.03 1 61 61
h-index value
A-index value
R-index value
h T -index value
Total Article counts
Total
‘Likes’
counts
Highest number of
‘Likes’
h-index value 1.000
A-index value .400** 1.000
R-index value .918** .487** 1.000
h T -index value .993** .458** .933** 1.000
Total Article counts .999** .400** .918** .994** 1.000
Total ‘Likes’counts .951** .583** .959** .971** .953** 1.000
Highest number of ‘Likes’ .736** .801** .829** .776** .734** .874** 1.000 Notes: n= 53
* p<0.05; ** p<0.01
<Table 4> Spearman’s rank correlation coefficients among the h value, A value, R value, h T value, Article counts, ‘Likes’ counts, and Highest number of ‘Likes’
Table 3 and Table 4 imply the inappropriateness of the h-index, g-index, A-index, and R-index for Web contents evaluation. The following discussions explain the reasons for this conclusion.
h-index: Two main problems existed with regard to Web contents evaluation. Firstly, the in-
sensitivity of the h-index stood out. This means that the influence of high-ranked articles is not reflected in the results. More specifically, the h-index values of two subject categories were the same (32 subjects among 53 subjects (60.04%) had exactly same value with multiple subjects.) or very similar. These two categories should have the same or a similar number of ‘Likes’, indicating that they have equivalent user preferences. However, in our analysis, the h-index did not distinguish between the user preferences of subject categories that had large different numbers of ‘Likes’in high-ranked articles.
For example, while the ‘Peripherals’ and ‘Science’ subjects had the same h-index value (h = 27), the ‘Likes’ counts of the 1st, 2nd, and 3rd-ranked articles differed considerably. The ‘Likes’ counts of the high-ranked articles in ‘Science’ were 948, 837, and 822, whose sum is about 3.7 times more than that of ‘Peripherals’, whose counts were 302, 202, and 202. The case of the ‘Google’
and ‘Tablets’ categories was more extreme. These categories had similar h-index values (h = 43 for ‘Google’ and h = 44 for ‘Tablets’), but the ‘Likes’ counts of high-ranked articles in the ‘Google’
category was 3,501, 1,594, and 437 likes, whose sum is about 4.3 times more than that of the
‘Tablets’ category, which had 577, 403, and 401 likes.
It seems reasonable to argue that the h-index value simplifies real data so excessively that it has a limited ability to reflect users’ preferences. When evaluating Web contents, the user preferences
for particular articles need to be considered to produce more reliable results. The results of the Spearman’s rank correlation (see Table 4) also show that the h-index correlates relatively lower with ‘Likes’ counts and highest number of ‘Likes’ than other indicators do. This means that the h-index does not consider the number of ‘Likes’ (or citations) thoroughly.
The other problem is that when the article count for a subject is relatively low compared to the number of ‘Likes’, it is difficult to produce valid results. In this case, the rank of the article receiving the lowest number of ‘Likes’ (or citations more generally) inevitably becomes the h-index value (Anderson et al. 2008). However, this inevitable value has less meaning because this feature might preclude the evaluation itself, so it needs to be dealt with more seriously. As shown in Table 3, of the 53 h-index values, the 37 underlined h-index values are exactly same as the article counts (70%). This suggests that each of these 37 h-index values was calculated simply using the number of articles in a corresponding subject category rather than the comparison of the number of ‘Likes’ and the number of articles in a corresponding category. We are going to call this h-index value ‘invalid’. The results of the Spearman’s correlation analysis (see Table 4) also showed that the h-index and article counts have a very strong positive correlation (r = 0.999).
Taken together, these results suggest that the original h-index is an inappropriate indictor for evaluating Web contents services, as the communication data have a wide variance and the h-index does not deal with this flexibly.
A-index: This indicator uses the sum of the citation counts in the h-core, which is the sum
of the ‘Likes’ counts from rank 1 to rank h. By considering the total ‘Likes’ counts, the A-index is used to overcome the insensitivity problem of the h-index. However, this indicator still has limitations in Web contents evaluation. Since it uses the h-index value directly in the calculation, the inappropriateness of the h-index is reflected in the calculation. In particular, in the case of subjects that have an invalid h-index value because the total article count is low compared with the ‘Likes’ count (i.e. the h value is fixed to total article count regardless of the ‘Likes’ count), the reliability of the h-index come into question too. These cases are underlined in Table 3.In the Spearman’s correlation analysis shown in Table 4, the correlation strength between the A-index and the highest number of ‘Likes’ was the second highest. This is due to the fact that it uses high-ranked articles’ ‘Likes’ directly.
R-index: The R-index was developed to overcome drawbacks of the A-index. It has such advantages
that it does not punish scientists with a higher number of quality citations, and it uses the h-indexindirectly, not directly. The R-index considers the number of ‘Likes’ in the h-core, and uses the h-index only to select articles to count. Nevertheless, this indicator has a deficiency in its ability to evaluate Web contents: Since the number of ‘Likes’ of articles in the h-core are treated as having the same weight, regardless of the rank or subject in the calculation, the R index is “very sensitive to just a very few top papers” (Bornmann, Mutz and Daniel 2008, 833). For example, in Table 3, the ‘Mobile’ category has the highest value in all other indicators, but in the R-index,
‘HD’ held the highest place (R-index value = 449.69). Figure 1 shows the distribution of ‘Likes’
counts in each of the two subjects (‘HD’ and ‘Mobile’). The numbers in the x-axis represent the rank of the articles by ‘Likes’ counts. For example, the article ranked 1 in the ‘HD’ category received 6,499 ‘Likes’; and the article ranked 1 in the ‘Mobile’ category received 2,989 ‘Likes’.
In Figure 1, the ‘HD’ category has a remarkably higher ‘Likes’ count in the articles ranked 1 and 2, and a few more ‘Likes’ counts in the articles ranked 5, 6, 7, and 8, than ‘Mobile’ category does. However, in all the other ranked articles, including ranks which are not presented in this graph, the ‘Mobile’ category has higher ‘Likes’ counts. It seems unreasonable to judge users’
preference based heavily on only a small number of articles that have higher ‘Likes’ counts.
The results of the Spearman’s correlation analysis in Table 4 also argue a similar point. The R-index values have the strongest correlation (r = 0.829) with the highest number of ‘Likes’, which shows that the ‘Likes’ counts of high-ranked articles seriously affect the R-index value. It can be concluded that the R-index is too dependent on a small number of articles that have a large number of ‘Likes.’
<Figure 1> The ‘Likes’ counts distribution of ‘HD’ and ‘Mobile’ subject categories.
Notes: The x-axis represents the rank (from 1 to 29) of articles by ‘Likes’ counts; the y-axis represents ‘Likes’
counts; The ‘HD’ category shows a short-tail pattern and the ‘Mobile’ subject shows a long-tail pattern.
Taken together, the sectional conclusions could be drawn from the analysis of the above four indices (h, g, A, R-index). The essential properties for the evaluation of an Web contents service that has highly popular content are: 1) calculation of the index value should be possible regardless of the number of articles; 2) the ‘Likes’ counts of articles should be reflected appropriately;
3) different weights should be assigned according to the rank of the article. If the ‘Likes’ counts of articles are calculated without different weight assignment, there would be a balancing problem of quantity and quality, because of excessive sensitivity of the index to the ‘Likes’ counts of high-ranked articles; and 4) the influence of the invalid h-index value should be minimized. As mentioned before, because there are some cases where the h-index value is invalid, it is better to use the value indirectly rather than directly in the index calculation.
These four properties might be general conditions for indicators; however they are points worth considering, especially when it is necessary to choose an appropriate and flexible evaluative indicator for online communication data whose topics and user preferences range widely. Thus, we examined whether the four indicators mentioned above (h, g, A, and R-index) and the h
T
-index satisfy the properties suggested. This checklist is shown in Table 5. The second property (‘Likes’ counts of articles should be reflected appropriately) is divided into two sub-properties: the h-core and non h-core. This is discussed in more detail in the next section.Requirement h-index g-index A-index R-index h T -index (1) Is the calculation of index value possible regardless of
the number of articles? No No No Yes Yes
(2) Can ‘Likes’ counts of articles be reflected appropriately?
Articles inside the h-core No No Yes Yes Yes
Articles outside the h-core No No No No Yes
(3) Can different weights be assigned according to the ranks? No No No No Yes (4) Can the influence of invalid h-index value be minimized? N/A N/A No Yes Yes
<Table 5> Checklist for appropriateness of each Indicator for Web contents Evaluation
4.2 The h T -index on Web contents
The h
T
-index is judged as an appropriate Web contents indicator for online communication data, satisfying the four conditions mentioned above. Table 3 and Table 4 show the results of application of the hT
-index and the relationship with other indicators respectively. Based on these results, the following sectional conclusions that this index satisfies the four conditions were drawn.Firstly, by using the h
T
-index, it was possible to gain values which other indicators cannotproduce. Neither the h-index nor the A-index generated valid values for the 37 subjects and the g-index failed to calculate values in all 53 subject categories. The intrinsic problem of the h-index highlighted by previous studies (Anderson, Hankin and Killworth 2008; Rousseau and Leuven 2008; Hua, Wan and Wu 2010) is that an individual’s h-index score cannot be over the total number of his or her articles, was also identified in the above three indicators (the h, A, and g-indices) for our evaluation of Web contents. However, the h
T
-index successfully overcame this calculation problem for our Web contents data, which had a large number of ‘Likes’ and thus high popularity.Secondly, the h
T
-index distinguished the subjects appropriately, while the h-index and g-index failed to. The hT
-index considers the ‘Likes’ counts of all the articles, whereas the h-index and g-index do not consider ‘Likes’ counts, and the A-index and R-index consider ‘Likes’ counts in the h-core only. Based on this feature, the hT
-index has advantages in evaluating such long-tailed type subjects that have even distributions of ‘Likes’, where the high-ranked articles’ ‘Likes’ counts are not large. In our data, the long-tailed type subjects correspond to the subjects that are not‘hot topics’ but receive steady attention. For example, as Figure 2 shows, high-ranked articles in the ‘Misc’ (miscellaneous) subject did not receive very high ‘Likes’ counts compared to the ‘Home Entertainment’ subject, which had similar article counts. However, the other subjects received relatively steady attention for all articles, except the 1st, 2nd, and 3rd-ranked articles in the ‘Home Entertainment’ category, which had higher ‘Like’ counts. In contrast, articles in the ‘Home Entertainment’ category received lower user attention compared to the ‘Misc’ category, except top-issued articles related to Netflix (e.g., ‘Netflix confirms May 26th launch date for new Arrested Development season’).
While the A-index (‘Misc’: 250.85; ‘Home Entertainment’: 391.66) and R-index (‘Misc’: 101.41;
‘Home Entertainment’: 117.08) granted a higher score to ‘Home Entertainment’, the h
T
-index produced a higher score for the ‘Misc’ category (‘Misc’: 70.29; ‘Home Entertainment’: 61.57).These results indicate that the A-index and R-index only consider ‘Likes’ counts of articles in the h-core, whereas the h
T
-index considers all the articles’ ‘Likes’ counts, including articles outside the h-core. For reference, the h-index value is 41 for ‘Misc’ and 35 for ‘Home Entertainment’.Taken together, these results indicate that when considering ‘Likes’ counts only in the h-core, the evaluation might be more distorted than not considering the ‘Likes’ counts at all. Particularly with regard to online communication, the risk of inappropriate evaluation might be high if ‘Likes’
counts of only high-ranked articles in the h-core are considered. This risk is based on the distinctive characteristics of the online communication data that can increase rapidly in a short period of
time due to the ease of generation and the characteristics of the content. Accordingly, the h
T
-index, considering all the articles’ ‘Likes’ counts is an appropriate indicator for evaluating online communica- tion data.In the correlation analysis (see Table 4), the indicator with the strongest relationship with the total ‘Likes’ counts was the h
T
-index (r = 0.971). As van Raan (2006) and Guan & Gao (2009) compared h-index with total citation counts to suggest its appropriateness in the sense that total citation counts can be a proxy for peer judgment. In a similar vein, we try to estimate the appropriateness of hT
-index by comparing with total citation counts correlation although this simple citation counts may reflect popularity degree.<Figure 2> ‘Likes’ counts distribution of ‘Misc’ and ‘Home Entertainment’ subject categories Notes: x-axis represents the rank (from 1 to 45) of articles by ‘Likes’ counts; y-axis represents ‘Likes’ counts.
Thirdly, the h
T
-index reflects quantity and quality using a differentiating ratio of ‘Likes’ counts depending on the rank of the articles. In the A-index and R-index, however, ‘Likes’ counts affect the index value excessively. This is because articles’ ‘Likes’ counts are simply added to the calculation as long as the article is included in the h-core. Similarly, if ‘Likes’ counts are used in the indicator value directly, the indicator might be too sensitive and the value cannot differ greatly from the total counts. The hT
-index does not use ‘Likes’ counts simply as they are; high-ranked articles’ ‘Likes’ counts do not excessively impact the indicator value.In the correlation analysis (see Table 4), the correlation of the h
T
-index with the highest number of ‘Likes’ counts was weaker than that of the A-index and of the R-index, and stronger thanthat of the h-index. This result seems appropriate, considering the above-mentioned points: the A-index and R-index are too sensitive to the ‘Likes’ counts of high-ranked articles, and the h-index is insensitive as it does not consider ‘Likes’ counts in its calculation.
Fourthly, the h
T
-index uses the h-index value indirectly, which relieves the negative effects of the h-index values. As mentioned above, the h-index value is invalid when the number of articles is too small compared to ‘Likes’ counts, and in some cases it is unreliable since the indicator does not consider ‘Likes’ counts. The hT
-index follows the score mechanism of the h-index (Anderson 2008) and uses the h-index value through a different method of calculating whether an article is included in the h-core or not. In other words, the hT
-index maintains the concept of the h-index, yet does not use the h-index value directly but weighted values of citation both in h-core and non h-core areas. Meanwhile, the A-index uses the invalid value of the h-index by using it directly in the calculation, which leads unreliable results.4.3 Evaluating contents using the h T -index and Pathfinder Network Analysis
Considering the appropriateness of the h
T
-index for Web contents evaluation, this section applied this index to draw a network using our data from Engadget.com. As Figure 3 shows, each node represents a subject category and links between nodes represent topical similarities. The size of each node shows the relative topic preference weighted by the hT
-index values. The networks were drawn and clustered using PFNet (White 2003) and PNNC methods (Lee 2006; Kim, Lee and Park 2009), respectively.The h
T
-index values were calculated by applying the subject category and the ‘Likes’ counts of each subject category. The subject category corresponds to the author (the so-called, ‘cell’), the number of ‘Likes’ to citations, and the articles within each subject category corresponds to the published journal articles (the so-called, ‘element’) of an author’s oeuvre. Based on these cell and element concepts, co-occurrence frequencies were calculated. For example, if an article is categorized to ‘Cellphones’ and ‘Mobile’ mutually, this article is co-occurred in both subject categories. If several articles are co-occurred in these two subjects, the two subjects have a strong relationship. Relationship intensity among subjects is expressed with line weights and values in the graph. The relationship intensity was calculated using Pearson’s correlation coefficient. The strongest intensity was 0.98, between the ‘Mobile’ and ‘Cellphones’ subjects.As the result of PNNC is based on PFNet, 53 subjects were classified into 8 clusters automati- cally and appropriate names were assigned to each cluster (Figure 3). Each node size was
weighted by its h
T
value. Table 6 also shows 8 clusters, the hT
value, and the topics for each cluster. The 8 clusters are shown in descending order of hT
value, which represents users’preference.
Rank Cluster h T value Subject Topics
1 Mobile 195.71
Amazon, Announcements, Apple, Blackberry, Cellphones, Google, GPS, Handhelds, Internet, LG, Microsoft, Mobile, Networking, Nokia, NVIDIA, Samsung, Software, Tablets, T-Mobile, Transportation
2 Home Device 112.39 Displays, HD, Home Entertainment, Household, Podcasts, Sony, Wearables 3 Peripherals 90.07 Gaming, Misc, Nintendo, Peripherals, Portable Audio/Video
4 Facebook 77.06 AT&T, HTC, Facebook 5 Alternative 67.96 Alt, Robots, Science
6 Wireless 66.34 Intel, Sprint, Verizon, Wireless
7 PC Device 56.98 Acer, AMD, ASUS, Dell, Desktops, HP, Laptops, Lenovo, Storage
8 Camera 47.83 Cameras, Canon
<Table 6> Eight Clusters Identified (arranged in order of h T value)
<Figure 3> h T -value-weighted PFNet of Subject Categories of Engaget.com
Note: Line weight is intensity between subjects calculated with Pearson’s correlation coefficient
Main findings from the network are summarized as follows:
∙Users preferences calculated by h
T
were greatest in the ‘Mobile’ cluster, followed by ‘Home Device’, ‘Peripherals’, ‘Facebook’, ‘Alternative’, ‘Wireless’, ‘PC Device’, and ‘Camera’.∙According to the raw data, representative outstanding issues at this time were HTC Facebook phone. The issue affected mostly to ‘Facebook’ cluster. This cluster consists of subjects that appeared to be weakly related (‘Facebook’, ‘HTC’, and ‘AT&T’), and the h
T
value gap between these three subjects was small. These weak relations and similar preferences among the three subjects are due to the articles about the HTC Facebook Phone release, which attracted high attention. The issue also contributed to ‘Mobile’ cluster’s high popularity, since the articles were included in ‘Mobile’ subject at the same time.∙Comprehensive subjects tended to have high h
T
values. For example, ‘Wireless’ subject had a higher value than ‘Verizon’, ‘Sprint’, and ‘Intel’. The latters are companies in ‘Wireless’area. This is caused by the facts that they tended to have more articles than others, and h
T
value is influenced by the number of articles.∙The subjects in the middle of the network with many connections tended to have higher h
T
values than the subjects in fringe with few connections. However, ‘Misc’, ‘HP’, ‘Acer’,‘Dell’, ‘HP’ categories were exceptions to this, which were influenced by high-ranked articles’
‘Likes’ counts, centrality of subjects and the number of articles.
∙When a subject in a cluster contained articles which were also included in subjects of outside the cluster, the network degree within the cluster was weak, owing to the dispersion of weights.
In this case, the subject was located in fringe of the network. ‘Misc’ is an example of this.
5. Discussion and Conclusion
This study evaluated Web contents using the h-type indices. The study expanded the application area of the h-type indices to online environments. As online environments become a common platform of information, the deluge of information became a problem; therefore a reliable evaluator is required. In bibliometrics and scientometrics, it is especially difficult to find studies that evaluate Web contents using the h-type indices.
The number of ‘Likes’, was used for evaluation in this study, however this kind of usage can be applicable to other communication data. The number of comments, replies, trackbacks, hits, and sharing counts of various social services such as Twitter, Google+, and Pinterest can
also be used to evaluate online communication data. This study provides a framework for utilizing this kind of data to evaluate Web contents. Table 7 suggests examples of applicable communication data types and websites offering the data. They include IT news blogs like Engaget.com (number 1, 2, and 3 items), representative news websites (number 4, 5, and 6 items), and representative video websites (number 7 and 8 items). All actively provide up to date information, and offer various online communication data.
No. Websites
Preference Data Facebook
(‘Likes’/
Shares)
Twitter (Retweets)
Google+
(Shares)
in-service vote
(Likes, votes) Comments
1 The Verge
(http://theverge.com) Yes Yes Yes - Yes
2 Gizmodo
(http://gizmodo.com/) Yes - - Yes Yes
3 Tech Crunch
(http://techcrunch.com) Yes Yes Yes - Yes
4 Fox News
(http://foxnews.com) Yes Yes Yes - Yes
5 CNN
(http://edition.cnn.com) Yes - - - Yes
6 USA Today
(http://usatoday.com) Yes Yes - - Yes
7 Youtube
(http://youtube.com) - - - Yes Yes
8 Vimeo
(http://vimeo.com) - - - Yes Yes
Note: “Yes” indicates that the corresponding Website has the corresponding preference data, and “-“ indicates that it does not.
<Table 7> Examples of the Prospective Websites and Corresponding Preference Data
This study determined 4 essential requirements for Web contents evaluation. 1) the calculation should be possible regardless of the number of articles, 2) ‘Likes’ counts of articles should be reflected in the evaluation, 3) it is worth considering whether the ‘Likes’ counts of articles should be used in the calculation as they are, as balancing quantity and quality could be difficult due to excessive sensitivity to the ‘Likes’ counts of high-ranked articles, and 4) because there are some cases where the h value is invalid, it is better to use the value indirectly (e.g., h
T
and R-index use h value to decide how to calculate the respective value) rather than directly (e.g.,A-index uses h value in its calculation directly) in the calculation. By applying five h-type indicators to the same data set and comparing the results, this study extracted the requirements for a Web contents evaluator. The requirements are expected to be used as a guideline for Web contents evaluator development.
Lastly, in this study the scientometric indicator was combined with PFNet for data visualization.
The h
T
-index was applied to represent the relative weight (topic preference by user ‘Likes’ count) for each subject category of the real online contents after proving the appropriateness of the hT
-index. This procedure enabled taking a broader view of popularity in Engadget.com and confirming several characteristics of hT
-index, suggesting combination of hT
-index and network visualization method.The results of this study are expected to be utilized in various settings. In academia, this study provides a framework for Web contents evaluation studies. In particular, the 4 suggested requirements would help the development of new methods for Web contents evaluation. In practice, this study helps online informants who plan content strategies. By obtaining information about users’ attention, online informants can create more tactical and user-friendly content. Currently, only tools for scholarly information evaluation are available by calculating an author or journal’s h-index value (e.g., Harzing’s Publish or Perish software, Google Scholar’s h-index calculator). Despite these benefits, this study focuses on h
T
-index only. This narrow scope might not capture some other indicators’ performances. In addition, Web contents differs from scholarly publications in which publishing and citations occur coincidently. The hT
-index considers both h-core (inside the Durfee square) and non h-core areas (outside the Durfee square) and assigns weighted values to each citation by hypothetically assuming it has a square of publications and citations. This study hypothe- sized that hT
-index would successfully reflect the weighted values even in Web contents. While some results support this, others still need more verification. Further study needs to investigate more indicators in various Web environments.Acknowledgement
This work was supported by the BK21 Plus (Brain Korea 21 Plus) project funded by the National Research Foundation of Korea (2014-11-0023). We also appreciate three anonymous reviewers.
References
[1] Alonso, S., Cabrerizo, F. J., Herrera-Viedma, E. and Herrera, F. 2009. “h-Index: A review focused in its variants, computation and standardization for different scientific fields.” Journal
of Informetrics, 3(4): 273-289.
[2] Alonso, S., Cabrerizo, F. J., Herrera-Viedma, E. and Herrera, F. 2010. “hg-index: A new index to characterize the scientific output of researchers based on the h-and g-indices.” Scientometrics, 82(2): 391-400.
[3] Anderson, T. R., Hankin, R. K. and Killworth, P. D. 2008. “Beyond the Durfee square: Enhancing the h-index to score total publication output.” Scientometrics, 76(3): 577-588.
[4] Batista, P. D., Campiteli, M. G., Konouchi, O. and Martinez, A. S. 2006. “Is it possible to compare researchers with different scientific interests?” Scientometrics, 68(1): 179-189.
[5] Bornmann, L., Mutz, R. and Daniel, H. D. 2008. “Are there better indices for evaluation purposes than the h index? A comparison of nine different variants of the h index using data from biomedicine.” Journal of the American Society for Information Science and Technology, 59(5):
830-837.
[6] Egghe, L. 2006. “An improvement of the H-index: the G-index.” ISSI newsletter, 2(1): 8-9.
[7] Egghe, L. 2010. “The Hirsch index and related impact measures.” Annual review of information
science and technology, 44(1): 65-114.
[8] Eppler, M. J. and Mengis, J. 2004. “The concept of information overload: A review of literature from organization science, accounting, marketing, MIS, and related disciplines.” The information
society, 20(5): 325-344.
[9] Guan, J. C. and Gao, X. 2009. “Exploring the h-index at patent level.” Journal of the American
Society for Information Science and Technology, 60(1): 35-40.
[10] Harzing, A. W. and Van Der Wal, R. 2009. “A Google Scholar h-index for journals: An alternative metric to measure journal impact in economics and business.” Journal of the
American Society for Information Science and Technology, 60(1): 41-46.
[11] Hirsch, J. E. 2005. “An index to quantify an individual’s scientific research output.” Proceedings
of the National academy of Sciences of the United States of America, 102(46): 16569-16572.
[12] Hovden, R. 2013. “Bibliometrics for Internet media: Applying the h-index to YouTube.”
Journal of the American Society for Information Science and Technology, 64(11): 2326-2331.
[13] Hua, P. H., Wan, J. K. and Wu, J. H. 2010. “A perfect Hirsch-type index? Experiences using the tapered h-index (h
T
).” Chinese Journal of Scientific and Technical Periodicals, 21(1): 33-37.[14] Jin, B. 2006. “H-index: an evaluation indicator proposed by scientist.” Science Focus, 1(1):
8-9.
[15] Jin, B., Liang, L., Rousseau, R. and Egghe, L. 2007. “The R-and AR-indices: Complementing the h-index.” Chinese science bulletin, 52(6): 855-863.
[16] Kevin, L., Jason, K., Marco, G., Andreas, W. and Nicholas, C. 2008. “Tastes, ties, and time:
A new social network dataset using Facebook.com.” Social Networks, 30(4): 330-342.
[17] Kim, P. J., Lee, J. Y. and Park, J. H. 2009. “Developing a new collection evaluation method:
Mapping and the user-side h-index.” Journal of the American Society for Information Science
and Technology, 60(11): 2366-2377.
[18] Lee, J. Y. 2006. “A novel clustering method for examining and analyzing the intellectual structure of a scholarly field.” Journal of Korean Society for Information Management, 23(4):
215-231.
[19] McCreadie, R. M. C., Macdonald, C. and Ounis, I. 2010. “Personalization and Fusion of Heterogeneous Information.” Proceedings of the RIAO '10 Adaptivity, LE CENTRE DE HAUTES ETUDES INTERNATIONALES D’INFORMATIQUE DOCUMENTAIRE, France:
Paris. 40-48.
[20] Rousseau, R. and Leuven, K. U. 2008. “Reflections on recent developments of the h-index and h-type indices.” COLLNET Journal of Scientometrics and Information Management, 2(1): 1-8.
[21] Shin, H. and Lee, J. 2009. “Ranking user-created contents by search user’s inclination in online communities.” Paper presented at the Proceedings of the 18th international conference
on World wide web, Spain: Madrid.
[22] Shuai, X., Liu, X. and Bollen, J. 2012. “Improving news ranking by community tweets.”
WWW '12 Companion Proceedings of the 21st international conference companion on World Wide Web, New York: ACM. 1227-1232.
[23] Timian, A., Rupcic, S., Kachnowski, S. and Luisi, P. 2013. “Do Patients “Like” Good Care? Measuring Hospital Quality via Facebook.” American Journal of Medical Quality, 1062860612474839.
[24] Van Raan, A. F. 2006. “Comparison of the Hirsch-index with standard bibliometric indicators and with peer judgment for 147 chemistry research groups.” scientometrics, 67(3): 491-502.
[25] Wang, C., Zhang, M., Ru, L. and Ma, S. 2008. “Automatic online news topic ranking using media focus and user attention based on aging theory.” CIKM '08 Proceedings of the 17th
ACM conference on Information and knowledge management, New York: ACM. 1033-1042.
[26] White, H. D. 2003. “Pathfinder networks and author cocitation analysis: A remapping of
paradigmatic information scientists.” Journal of the American Society for Information Science
and Technology, 54(5): 423-434.
[27] Wiyartanti, L., Yo-Sub, H. and Laehyun, K. 2008. “A ranking algorithm for user-generated video contents based on social activities.” Paper presented at the Digital Information Management, ICDIM 2008. Third International Conference on.