• 검색 결과가 없습니다.

Design of a hybrid power management system and cold start simulation in a fuel cell ship with PLECS

N/A
N/A
Protected

Academic year: 2021

Share "Design of a hybrid power management system and cold start simulation in a fuel cell ship with PLECS"

Copied!
8
0
0

로드 중.... (전체 텍스트 보기)

전체 글

(1)

http://dx.doi.org/10.5916/jkosme.2016.40.5.429 Original Paper

This is an Open Access article distributed under the terms of the Creative Commons Attribution Non-Commercial License (http://creativecommons.org/licenses/by-nc/3.0), which permits

†Corresponding Author (ORCID: http://orcid.org/0000-0003-3627-476X): Division of Marine Engineering, Korea Maritime and Ocean University, 727, Taejong-ro, Yeongdo-gu, Busan 49112, Korea, E-mail: [email protected], Tel: 051-410-4283

1 Underwater Vehicle Research Center, Korea Maritime and Ocean University, E-mail: [email protected], Tel: 051-410-4866

Design of a hybrid power management system and cold start simulation in a fuel cell ship with PLECS

Jin-Seok Oh ․ Young-Min Kang 1

(Received March 2, 2016; Revised April 25, 2016;Accepted May 18, 2016)

Abstract: Currently, many studies on green ships are under way. Fuel cell (FC) ships are of interest as future low-emission, fuel-efficient vessels. In this paper, a hybrid power management system for an FC ship was designed. The system consists of an FC, a battery, a unidirectional DC/DC converter, a bidirectional DC/DC converter, a filter, an inverter, and a propulsion component. To design the system, we analyze electric sources and converters, and create PLECS models of hybrid power man- agement system. Then, we check the cold start sequence and perform a simulation to understand the characteristics of the hy- brid power management system in an FC ship.

Keywords: Fuel cell ship, Hybrid power management system, Unidirectional DC/DC converter, Bidirectional DC/DC converter, PLECS

1. Introduction

Fuel cells (FCs) are emerging as an attractive power source because they are clean, highly efficient, and reliable [1]. However, the FC has several problems such as energy storage, response capability, cold starting, and voltage fluctu- ation at peak load. Therefore, hybrid power systems that have an auxiliary energy source, such as battery or an ul- tra-capacitor, for improving the dynamic response character- istics are used [2][3].

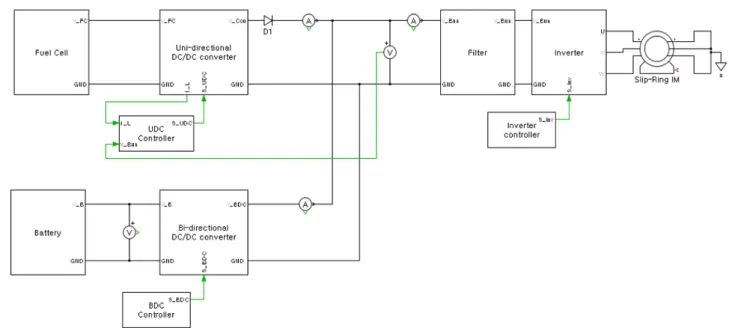
A hybrid power management system is composed of sev- eral parts: the generation, the auxiliary source, the con- verters, the filter, and the propulsion component. Figure 1 shows a diagram of the hybrid power management system for an FC ship.

Figure 1: Diagram of hybrid power management system for a fuel cell ship

The proposed hybrid power management system has two pow- er sources, namely, an FC as the generation source and a battery as the auxiliary source. The FC is connected to the unidirec- tional DC/DC converter (UDC) and the battery is connected to the bidirectional DC/DC converter (BDC). UDC and BDC are important for managing power in the system. By adjusting the duty ratio of the PWM signal, the UDC manages the FC power and the BDC manages the battery power in the system.

The ship load can change based on sea states. When the pulse load is generated, the FC supplies a much higher peak current than for a constant load. Once the peak load is generated, the FC is damaged by the sudden current fluctuation. This rapid change of the FC power can cause problems and reduce its lifetime. Therefore battery power is used to respond to sudden power surges.

If the system correctly changes the power output of the FC after using battery power, then the battery is charged using FC power.

Figure 2 shows the circuit of a hybrid power management

system for an FC ship. In peak power applications, the battery

is used in modules in which many components are connected in

series and parallel to obtain acceptable voltage and power

levels. The battery terminal voltage Vb determines the number

of battery modules, which must be connected in series to form

a module.

(2)

Figure 2: Circuit of hybrid power management system for a fuel cell ship

2. Modeling of electric sources 2.1 Fuel cell

A fuel cell is a power device that converts chemical energy into electrical energy. Therefore, the voltage and current values can be obtained using a thermodynamic equation. If the fuel cell is used for generating electrical energy, the actual voltage is lower than the theoretical voltage because of irreversible losses. The sources of voltage drop can be divided into three categories: active polar- ization, polarization resistance, and concentration polarization.

              

      

 

  

  

     



  (1) where   is the polarization voltage,    is the ideal cell volt- age of the temperature and pressure function,   is the active polarization,   is the concentration polarization,    is the polarization resistance,  is the gas constant,  is the chem- ical reaction temperature,  is the Transfer coefficient,  is the Faraday constant,  is the output current in the FC,   is the current loss,   is the exchange current density,   is the limit- ing current density, and  is the internal resistance.

The expression shows that the actual cell voltage of the fuel cell is the value after subtraction of the total losses from elec- trical energy production. A fuel cell stack voltage can be ob- tained by multiplying the cell voltage by the number of cells.

Because the FC output is low-voltage and high-current, in most cases, a DC/DC converter is used in conjunction with it.

2.2 Battery

A battery is used to provide auxiliary power in the system. In the case of the initial start-up scenario or a rapid load increase,

the battery supplies power instead of the FC. Specifically, lead-acid batteries can be rapidly charged and discharged. The battery is connected in parallel with the high voltage DC bus via the BDC. The BDC operates in a suitable mode based on the condition of the battery and the FC.

The battery can be modeled using an internal resistance model.

     

  (2)

where  is the battery terminal voltage,   is the open-circuit voltage,  is the Polarization constant,   is the battery SOC (state of charge),  is the internal resistance, and  is the out- put current.

Among the many available modeling methods, in this paper, the internal resistance model is used. The internal resistance model can estimate the SOC based on the power usage. A bat- tery pack voltage can be obtained by multiplying the number of battery cells connected in series.

3. Modeling of electric converters 3.1 Unidirectional DC/DC converter

The UDC is used to generate the constant DC grid voltage.

Because the fuel cell output voltage can be changed to the de-

sired output voltage, the fuel cell output voltage should be

made constant. The UDC is designed using phase-shift

full-bridge (PSFB) DC-DC converters, which are widely used in

FC power systems. The UDC can operate in a constant voltage

condition or in a limited current condition. The operation of the

proposed UDC is simplified, i.e., all devices and component are

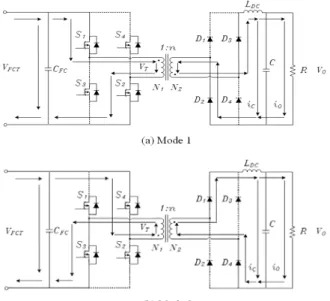
assumed to be ideal. Figure 3 shows the operation mode dia-

grams of the UDC.

(3)

Figure 3: Operation mode of full-bridge converter

Switches 1 and 2 turn on in mode 1. Switches 3 and 4 turns on in mode 2. The load current is the output in a specific direc- tion, regardless of the mode. The waveforms of each mode are shown in Figure 4.

Figure 4: Waveforms for each mode of full-bridge converter

Mode 1 is different from mode 2 in terms of its dynamic equations. The sign of the induced voltage in the transformerat primary side is different in mode 1 and mode 2. The fuel cell voltage input    and UDC output voltage    are repre- sented by a current applied to the converter internal coil, which is given by Equation (3) below [3].

    





 

        



 (3)

where  is the primary coil voltage and  is the turn ratio.

The filter part in the converter consists of an inductor  

and a capacitor  . The inductor is used to filter the converter output current ripples. The output capacitor is used to filter the converter output voltage ripple; it can be obtained as follows:

 ≥ 



         

≥ 



              

(4)

where   is the average inductor current at the boundary be- tween continuous and discontinuous condition,   is the con- verter switching frequency in the UDC,  is the duty cycle, and

  is the voltage of the grid. To ensure that the converter is always working in continuous conduction mode, a minimum out- put current is required; it is equal to the average maximum boundary current, which occurs at D = 0.5. The voltage ripple should be less than 1% of the output voltage.

Figure 5: UDC circuit with PLECS

The UDC PLECS model is shown in Figure 5. The UDC controller receives feedback regarding the primary coil voltage

and the inductor current  to maintain the output voltage at the target voltage. The UDC target voltage is 320 V DC; each element is designed to handle the voltage output well. The de- sign parameters of the UDC are given in Table 1.

Parameters Values Parameters Values

V out 320 [V] C 2 1 [uF]

V in 220 [V] C 4.7 [mF]

f UDC 50 [kHz] L M 80 [mH]

FET 0.01 [Ω] L DC 1 [mH]

D 0.01 [Ω] n 2

Table 1: Design parameters of UDC

3.2 Bidirectional DC/DC converter

The BDC allows power flows in both directions for energy

storage discharge and recharge. The BDC connects the DC bus

(4)

to the battery; it can transmit energy in both directions.

Additionally, the BDC boosts the battery voltage to the DC grid voltage. If the DC grid voltage is higher than the BDC output voltage, the BDC recharges the battery. The BDCha response must be fast enough to compensate for the slow dynamics of the FC during start-up or sudden load changes. Generally, a buck-boost converter is combined with the BDC, which can work in buck mode to charge the battery, and in boost mode to discharge the battery. Figure 6 shows the BDC circuit.

Figure 6: BDC circuit

To ensure that the inductor is designed for keeping the con- tinuous condition current mode, the inductor  in the BDC is given in buck and boost converter mode, as shown below.

   ≥ 

  



 

 

   ≥ 

  

    

(5)

Additionally, the capacitor  is chosen based on the delay time  , the voltage drop

, and the inverter maximum cur- rent   as follows:

   × 

 

(6)

The BDC PLECS model is shown in Figure 7. R1 and L1 are added for voltage stabilization of the basic circuit. FET 1 and FET 2 are switched in turn to allow bi-directional operation such that the battery is charged and discharged based on the rise and fall of the mains voltage, based on load variations.

Figure 7: BDC circuit with PLECS

The design parameters of the BDC is given in Table 2.

Parameters Values Parameters Values

V BDC 305 [V] L 1 10 [uH]

V Bat 220 [V] C 1 1.5 [mF]

f BDC 50 [kHz] L 2 10 [uH]

R 1 2 [㏀] C 2 1 [mF]

Table 2: Design parameters of BDC

3.3 Inverter and motor

The propulsion component usually includes a three-phase in- duction motor. Therefore a three-phase voltage source inverter (VSI) is used to change DC into three-phase AC. Figure 8 shows the topology of a three-phase inverter.

Figure 8: Three-phase voltage source inverter

VSIs are divided into three categories; this paper uses a pulse-width modulated (PWM) inverter. Among the various PWM techniques, sinusoidal pulse width modulation (SPWM) is suitable in many industrial applications. The model of the inverter circuit with PLECS is shown in Figure 9.

Figure 9: Inverter circuit with PLECS

The design parameters of the inverter ars given in Table 3.

Parameters Values Parameters Values

VI DC 320 [V] f out 60 [Hz]

V Out AC 220 [V] FET 0.01 [Ω]

Table 3: Design parameters of inverter

The inverter drives the propulsion motor for ship propulsion.

Propulsion motors are modeled based on a 1.5-kW induction

motor. The induction motor model is supported by PLECS. The

propulsion motor PLECS model is shown in Figure 10.

(5)

Figure 11: Hybrid power management system model

Parameters Values Parameters Values

R St 8 [Ω] Friction

coefficient 1.15

R Ro 8 [Ω] J 0.1 [kgm 2 ]

L Mag 70 [mH] Pole 6

L Ro_Leak 2 [mH] L St_Leak 2 [mH]

Figure 10: Propulsion Motor circuit with PLECS

The design parameters of the propulsion motor are given in Table 4.

Table 4: Design parameters of propulsion motor

4. Simulation

Based on the models described in the previous section, a hy- brid power management system model for an FC ship is developed. The hybrid power management system modeling is shown in Figure 11.

Then, a cold start simulation is carried out to evaluate the sys- tem’s dynamic response. Because the FC takes a long time to oper- ate at start-up, we use a battery to compensate for the initial load.

Table 5 shows the cold start operation sequence of an FC ship.

State FC UDC Battery BDC

State 1 stop No

operation stop No operation

State 2 Warm-up No

operation Slip in Boost Soft start

State 3 Warm-up No

operation Supply

Buck Soft start and Boost

State 4 Standby No

operation Supply Buck and Boost State 5 Slip in Soft start Supply Buck and

Boost State 6 Supply Soft start Slip out Buck and

Boost State 7 Supply Operation charge or

discharge

Buck and Boost Table 5: Cold start operation sequence in a fuel cell ship

The DC bus voltage is changed by the operational condition.

The working situation of the FC is defined by the FC lim- it-power point voltage V FCLP . For simulation purposes, the opera- tional condition of the FC can be defined in terms of the DC bus voltage as follows:

1) V bus < VFCLP : battery supplies energy to the load 2) V bus > V UDCO : surplus power is transferred to battery 3) V FCLP ≤ V bus ≤ V UDCO : the FC normal state

where    is the UDC output voltage. We must select the

FC limit-power point voltage V FCLP , which has two control

points: the slip-in point V SLIP and the slip-out point V SLOP .

Additionally, V bus is sensed for the control process of a hybrid

power system.

(6)

During overload conditions, the battery must slip into the sys- tem, and the BDC should begin to work in a boost con- stant-voltage mode. V SLIP can be determined in the overload condition. V SLIP should be less than V BDCO-Boost , but close to V BDCO-Boost . V SLOP is determined based on the battery’s slip-out time and FC’s self-start finish time. When the FC finishes its self-start and supplies power to the load, the UDC operates at constant voltage, and V bus = V UDCO . In this paper, V SLOP is de- termined as V BDCO-Boost ≤ V SLOP ≤ V UDCO .

The FC response time is tens of seconds for the cold-start state, and hundreds of milliseconds in the standby (warm-up) condition.

The UDC response time is tens of microseconds. Therefore, the UDC response performance is not a serious issue in the hybrid system.

For smooth operation of the system, soft-start logic is used when initiating the UDC, BDC, and inverter. The voltage ramp-up time is 0.2 s. The soft-start logic used for PWM switching is shown in Figure 12.

Figure 12: Soft start logic for PWM switching

In this paper, the simulation operation time was adjusted to allow rapid identification of a change in the voltage and current corresponding to the drive unit. Figure 13 shows the adjusted operation time and operation sequence in the simulation.

Figure 13: Operation sequence in simulation

An FC takes a long time to begin driving the load. Therefore, it needs to drive the BDC first. First, it increases the duty cycle of switches that operate the BDC in boost mode and increases the du- ty cycle of the complementary switches that operate the BDC in buck mode. After the BDC is operating, it drives the inverter to turn the propulsion motor. The propulsion motor is driven by the power of the battery. When the fuel cell is ready to self-start, the UDC is driven and the load is switched from the battery to the FC.

5. Simulation results

Figure 14 shows the change of the main bus voltage dur- ing the operational sequence. When starting the simulation, the main bus voltage is increased to roughly the battery

voltage because of the characteristics of the BDC. After the duty cycle of the boost mode of the BDC is increased, the main bus voltage is maintained at roughly 305 V. When the motor is driven for 0.5 s, the voltage drops to 255 V after a soft start. The main bus voltage increases to the target voltage of 320 V as the UDC is driving the load.

Figure 14: Waveform of main bus voltage

The change of the main bus current is shown in Figure 15.

The current is repeatedly charged and discharged because of the driving of the BDC early in the simulation. The drive inverter main bus current rises to roughly 4.2 A after 0.5 s. The voltage is increased by the UDC.

Figure 15: Waveform of main bus current

The current changes in the BDC and the UDC are shown in Figure 16 and Figure 17, respectively. The BDC current increase as the inverter is driving the load. The UDC current does not flow until the UDC voltage is higher than the BDC voltage.

When the UDC voltage rises above the BDC voltage after 0.9 s, the BDC current falls and the UDC current rises sharply. The UDC appears to have a very fast reaction, because the FC mod- el does not reflect the slow reaction speed.

Once the current changes suddenly, UDC changes to the steady state and the battery begins to charge.

Figure 18 and Figure 19 show the waveforms of UDC operation. The UDC operates after 0.7 s. The PWM phase is shifted until v_C2 (i.e., the set voltage) is reached.

Figure 20 shows the waveform of the propulsion motor.

After the soft start, the line voltage and current rise when the

UDC voltage rises.

(7)

Figure 16: Waveform of BDC current

Figure 17: Waveform of UDC current

Figure 18: Waveforms of UDC

Figure 19: Waveforms of UDC in steady state

Figure 20: Waveforms of propulsion motor current and line voltage

6. Conclusions

A hybrid power management system in an FC ship was de- signed in this paper. To design the system, we confirmed the power system’t operation and analyze electric sources and converters. Then, system modeling was carried out using PLECS software. Finally, we performed a cold start simulation to understand the characteristics of the hybrid power manage- ment system. The proposed PLECS model can be effectively used to design a hybrid power management system in an ac- tual ship. Therefore, we must improve the model using an ac- tual ship experiment.

Acknowledgement

This work was supported by Development of EMS for Green-ship program funded by the Korea Institute of Marine Science & Technology Promotion and Development of eco-friendly Single Point Mooring System with intergrated control system operable up to maximum water depth 100 me- ters program funded by the Small and Medium Business Administration

References

[1] B. Zahedi and L. E. Norum, “Modeling and simu- lation of all-electric ships with low-voltage DC hybrid power systems,” IEEE Transactions on Power Electronics, vol. 28, no. 10, 2013.

[2] X. Kong, L. T. Choi, and A. M. Khambadkone,

“Analysis and control of isolated current-fed full

bridge converter in fuel cell system,” The 30th

Annual Conference of the IEEE Industrial Electronics

Society, vol, 3, pp. 2825-2830, 2004.

(8)

[3] D. Maksimovic, A. M. Stakovic, V. J. Thottuvelil, and G. C. Verghese, “Modeling and simulation of power electronic converters,” Proceedings of the IEEE, vol. 89, no. 6, 2001.

[4] C. L. Chu and Y. Chen, “ZVS-ZCS bidirectional full -bridge DC-DC converter,” Power Electronics and Drive Systems, PEDS 2009, pp. 1125-1130, 2009.

[5] E. V. Dijk, H. J. N. Spruijt, D. M. O'Sullivan, and J.

B. Klaassens, “PWM-switch modeling of DC-DC con- verters,” IEEE Transactions on Power Electronics, vol.

10, no. 6, 1995

[6] R. W. Erickson, “Fundamentals of Power Electronics,”

SpringerVerlag, Chap 6, 2013.

[7] P. Thounthong, S. Rael, and B. Davat, “Energy man- agement of fuel cell/battery/super capacitor hybrid power source for vehicle applications,” Journal of Power Sources, vol. 193, no. 1, pp. 376–385, 2009.

[8] M. Baei, “A ZVS-PWM full-bridge boost converter for applications needing high step-up voltage ratio,”

Applied Power Electronics Conference and Exposition (APEC), 2012 Twenty-Seventh Annual IEEE, pp.

2213-2217, 2012.

[9] F. Peng, H. Li, G. J. Su, and J. S. Lawleret, “A new ZVS bidirectional dc-dc converter for fuel cell and battery application,” IEEE Transactions on Power Electronics, vol. 19, no.1, pp. 54-65, 2004.

[10] Z. jiang and R. A. Dougalet, “A compact digitally con- trolled fuel cell/battery hybrid power source,” IEEE Transactions on Industrial Electronics, vol. 53, no. 4, 2006.

[11] G. W. Wester and R. D. Middlebrook, “Low-fre- quency characterization of switched dc-dc converters,”

IEEE Transactions on Aerospace and Electronic

Systems, vol. 9, no. 3, 1973.

수치

Figure  1:  Diagram  of  hybrid  power  management  system  for  a  fuel  cell  ship
Figure  2:  Circuit  of  hybrid  power  management  system  for  a  fuel  cell  ship
Figure  3:  Operation  mode  of  full-bridge  converter
Figure  8:  Three-phase  voltage  source  inverter
+3

참조

관련 문서