Predictive Performance
of Ultrasound-Determined Non-Alcoholic Fatty
Pancreas Disease Severity for Intermediate and
High Risk of Coronary Heart Disease
중간/고위험성 관상동맥심장질환 위험성을 예측하는데 있어 초음파상 비알콜성 지방췌장의 정도의 정확성
Younghoon An, MD1 , Seong Jong Yun, MD2* , In-Ho Yang, MD3 , Dong Hyeon Kim, MD4 , Dal Mo Yang, MD1
1Department of Radiology, Kyung Hee University Hospital at Gangdong, Kyung Hee University School of Medicine, Seoul, Korea
2Department of Radiology, G SAM Hospital, Gunpo, Korea
3Division of Cardiology, Department of Internal Medicine, Kyung Hee University Hospital at Gangdong, Kyung Hee University School of Medicine, Seoul, Korea
4Department of Radiology, Seoul National University Hospital, Seoul National University College of Medicine, Seoul, Korea
Purpose To evaluate non-alcoholic fatty pancreas disease severity on ultrasound (US-deter- mined NAFPD) as a risk factor for coronary heart disease (CHD) and to evaluate its predictive value for intermediate/high CHD risk compared with US-determined non-alcoholic fatty liver disease (US-determined NAFLD) severity.
Materials and Methods A retrospective analysis of 544 young adults, aged 18–40 years, was performed. NAFPD and NAFLD were classified as absent, mild, moderate, and severe. CHD risk was calculated using the Framingham Risk Score (FRS). Correlation, multivariate logistic regres- sion, and receiver operating characteristic curve analyses were used to compare the predictive performance.
Results FRS increased with increasing US-determined NAFPD severity (r = 0.624, p < 0.001), with a concomitant increase in the odds ratio for intermediate/high CHD risk. There was no difference between the predictive performance of US-determined NAFLD and NAFPD severities for inter- mediate/high CHD risk (p = 0.17). The combination of US-determined NAFPD and NAFLD severi-
Received March 6, 2019 Revised May 19, 2019 Accepted June 15, 2019
*Corresponding author Seong Jong Yun, MD Department of Radiology, G SAM Hospital, 591 Gunpo-ro, Gunpo 15839, Korea.
Tel 82-31-441-9020 Fax 82-31-441-9035
E-mail [email protected] This is an Open Access article distributed under the terms of the Creative Commons Attribu- tion Non-Commercial License (https://creativecommons.org/
licenses/by-nc/4.0) which permits unrestricted non-commercial use, distribution, and reproduc- tion in any medium, provided the original work is properly cited.
ORCID iDs Younghoon An https://
orcid.org/0000-0001-7577-1983 Seong Jong Yun
https://
orcid.org/0000-0002-3775-5701 In-Ho Yang
https://
orcid.org/0000-0002-2179-1767 Dong Hyeon Kim
https://
orcid.org/0000-0001-5019-8199 Dal Mo Yang
https://
orcid.org/0000-0001-7766-5826
ties significantly improved the differentiation between intermediate and high CHD risk (predictive val- ue, 0.807; p < 0.001).
Conclusion US-determined NAFPD severity was well-correlated with FRS and associated with the prevalence of intermediate/high CHD risk. The combination of US-determined NAFPD and NAFLD se- verities may be useful for predicting CHD risk.
Index terms Pancreatic Diseases; Coronary Heart Disease; Non-Alcoholic Fatty Liver Disease;
Predictive Value of Tests; Ultrasonography
INTRODUCTION
Ectopic fat, caused by a positive energy balance and impaired lipid storage capacity of the subcutaneous fat, can result in the accumulation of fat in undesired sites, such as the liver, skeletal muscle and the heart (1). Ectopic fat accumulation plays an important role in the pathogenesis of obesity-related metabolic consequences, including coronary heart disease (CHD) (2, 3).
Ectopic fat accumulation in hepatocyte is termed non-alcoholic fatty liver disease (NAFLD).
NAFLD ranges from simple steatosis to a more advanced fibrosis, with the potential to prog- ress to cirrhosis (4). Similar to NAFLD, the term non-alcoholic fatty pancreas disease (NAFPD) has recently been introduced to describe ectopic fat accumulation in pancreatic cells. FP may promote the development of chronic pancreatitis and pancreatic cancer (5-7).
NAFLD and NAFPD can be diagnosed by noninvasive means, using imaging modalities, in- cluding abdominal ultrasound (US), CT and MRI (8, 9). Although abdominal MRI is the best imaging modality for diagnosing NAFLD and NAFPD, abdominal US is more commonly used because of its accessibility (9-11).
A recent meta-analysis identified NAFLD as a significant risk factor for CHD (12). Similarly, NAFPD significantly increases the risk of metabolic comorbidities (13). However, the relation- ship between US-determined NAFPD severity and CHD risk has not yet been evaluated. More- over, comparison of the predictive value between US-determined NAFLD severity and US-de- termined NAFPD severity, as well as the predictive value of the combination of US-determined NAFLD and NAFPD severity, also need to be evaluated. We hypothesized that US-determined NAFPD severity would be significantly associated with CHD risk and, therefore, might be use- ful for predicting high CHD risk, in combination with US-determined NAFLD severity.
The primary goal of our analysis was to evaluate the relationship between US-determined NAFPD severity and CHD risk. We also aimed to evaluate the predictive performance of US- determined NAFPD severity in determining intermediate/high CHD risk compared to US-de- termined NAFLD severity.
MATERIALS AND METHODS STUDY POPULATION
This retrospective study was approved by our Institutional Review Board, and written in-
formed consent was waived as we used only de-identified data routinely collected during health screening visits (IRB No. 2018-09-001). We conducted a retrospective analysis of young adults who underwent a comprehensive health screening examination at our health promo- tion center between September 1, 2017 and June 30, 2018. We enrolled adults, 18- to 40-years- old based on a recent study which demonstrated a significant change in pancreatic echo- genicity and strain after the age of 40 years (14). Additionally, as our objective was to evaluate the association between NAFPD and CHD risk score, our analysis was restricted to partici- pants who underwent abdominal US (n = 1260). We excluded participants who had any of the following conditions: alcohol intake ≥ 30 g/d in men or ≥ 20 g/d in women (n = 585); history of liver cirrhosis, positive hepatitis B surface antigen or hepatitis C virus antibodies (n = 48);
history of CHD (n = 18); use of warfarin or antithrombotic medication (n = 15); history of dia- betic mellitus (n = 15), pancreatitis (n = 9) or use of anticancer drug (n = 8). Patients were ex- cluded from analyses if the pancreas was not visualized on US (n = 9) or laboratory data was incomplete (n = 9). Finally, the data of 544 consecutive participants were included in our analysis.
DATA COLLECTION
Data collection was performed consecutively based on self-administered questionnaires and electronic medical records. Demographic characteristics, smoking status, alcohol con- sumption, medical history, and medication use were collected through standardized, self-ad- ministered questionnaires. Alcohol consumption was categorized as none or moderate (< 30 g/d in men and < 20 g/d in women). Height, weight, waist circumference (WC), and seated blood pressure were measured by trained nurses. Body mass index (BMI) was calculated as weight in kilograms divided by height in meters squared.
We also evaluated the presence of metabolic syndrome. Metabolic syndrome was defined based on the Modified National Cholesterol Education Program Adult Treatment Panel III guidelines along with the WC values for Koreans suggested by the Korean Society for the Study of Obesity (15, 16).
SETTING OF THE ABDOMINAL US
Abdominal US was performed to assess the severity of pancreatic steatosis (US-determined NAFPD) and hepatic steatosis (US-determined NAFLD). Abdominal US was performed using the LogiQ E9 (GE Healthcare, Milwaukee, WI, USA) scanner, with a 1–5 MHz curvilinear ab- dominal transducer, by board-certified radiologists unaware of the study aims. In order to compare the echogenicity of the renal parenchyma to the one of the pancreatic parenchyma, we set dual screen mode. The US image of the right kidney was displayed on the left side of the US screen, and the US image of the pancreas was displayed on the right. Equipment set- tings for abdominal US were as follows: depth range, 9 cm; transmit focal depth, 6 cm; gain, 80 dB; dynamic range, 60 dB; time gain compensation sliders in central position; lateral gain compensation in neutral position; and mechanical index, 0.2. Changing the equipment set- tings during US examination was permitted for obtaining adequate image quality according to body habitus in patients.
US IMAGE ANALYSIS
US-determined NAFPD and NAFLD severity were evaluated independently on the picture archiving and communication system (PACS) (Centricity RA1000, GE Healthcare, Barrington, IL, USA) by two board-certificated radiologists who were not involved in participant selec- tion. The two reviewers were unaware of the final clinical diagnoses and disease prevalence.
Also, the written reports of abdominal US were not referenced.
A US diagnosis of FP was made based on previous studies (11, 17). FP was categorized as non FP, mild FP, moderate FP, or severe FP, based on the echogenicity of the pancreas rela- tive to that of the renal parenchyma (Fig. 1). A US diagnosis of FL was made based on stan- dard criteria (8, 10), including difference in echogenicity between the liver and kidney, visi- bility of the intrahepatic vessel walls, and of the diaphragm. It was categorized as normal liver, mild FL, moderate FL, or severe FL (Fig. 2). As we had already excluded participants with excessive alcohol use (≥ 30 g/d for men and ≥ 20 g/d for women) and other identifiable
A
C
B
D Fig. 1. Ultrasonographic findings of the pancreas based on the degree of steatosis.
A. Non-fatty pancreas: the pancreatic echogenicity (right, arrow) is equal to the renal cortical echogenicity (left, arrowhead).
B. Mild fatty pancreas: the pancreatic echogenicity (right, arrow) is higher than the renal cortical echogenicity (left, arrowhead); however, pan- creatic echogenicity is definitely lower than the retroperitoneal fat echogenicity (right, open arrow).
C. Moderate fatty pancreas: the pancreatic echogenicity (right, arrow) is higher than the renal cortical echogenicity (left, arrowhead) and slightly lower than the retroperitoneal fat echogenicity (right, open arrow).
D. Severe fatty pancreas: the pancreatic echogenicity (right, arrow) is higher than the renal cortical echogenicity (left, arrowhead) and equal to the retroperitoneal fat echogenicity (right, open arrow).
causes of FP and FL at baseline, as described in the exclusion criteria, FP and FL were con- sidered as NAFPD and NAFLD, respectively.
CARDIOVASCULAR RISK ASSESSMENT BY THE FRAMINGHAM RISK SCORE (FRS)
The FRS was calculated using participants’ sex, age, total cholesterol, high-density lipopro- tein cholesterol, systolic blood pressure, and smoking (18). The FRS is based on data from a sample of the Framingham Heart and Offspring studies (19). Participants with a probability of < 10% were classified as being at “low CHD risk,” while those with a probability of ≥ 10%
were classified as being at “intermediate/high CHD risk.” The clinician who calculated the FRS was unaware of the final clinical diagnoses and NAFPD/NAFLD prevalence.
STATISTICAL ANALYSIS
Continuous variables are presented as means ± standard deviation (SD), and categorical Fig. 2. Ultrasonographic findings of the liver based on the degree of steatosis.
A. Normal liver: the liver and the kidney have the same echogenicity (left). There is preservation of the echo line in the portal vein wall (right, arrow).
B. Mild fatty liver: slight increase in the liver echogenicity, with echogenic discrepancy between the liver and the kidney (left), and preserva- tion of the echo line in the portal vein wall (right, arrow).
C. Moderate fatty liver: increased liver echogenicity, with echogenic discrepancy between the liver and the kidney (left), and loss of the echo line from the portal vein wall (right, arrow).
D. Severe fatty liver: marked increase in the hepatic echogenicity, with echogenic discrepancy between the liver and the kidney (left), and poor visualization of the diaphragm (right, arrowheads).
A
C
B
D
data as percentages. Comparisons between the four NAFPD severity groups were performed using analyses of variance for continuous variables and the Kruskal-Wallis test for categorical data. Spearman correlation coefficients (ρ) were calculated to determine the correlation be- tween US-determined NAFPD severity and CHD risk score, with ρ value interpreted as fol- lows: ≤ 0.20, no; 0.21–0.40, weak; 0.41–0.60, moderate; 0.61–0.80, high; and ≥ 0.81, very high correlation (20).
In order to assess the independent association between US-determined NAFPD and FRS, multivariate-adjusted logistic regression models were used. We used four models with in- creasing degrees of adjustment to account for potential confounding factors at baseline. Age, sex, smoking status, alcohol consumption, BMI, and metabolic syndrome were assumed to be potential confounding factors because each could independently increase the risk of CHD.
Thus, we adjusted these factors and divided them into four categories: unchangeable demo- graphic factors (age and sex), life habit factors (smoking and alcohol consumption), body hab- itus (BMI), and metabolic syndrome. The odds ratios (ORs) and 95% confidence intervals (CIs) were calculated for each model.
In order to evaluate the predictive performance of 1) US-determined NAFPD severity, 2) US-determined NAFLD severity, and 3) US-determined NAFPD severity plus US-determined NAFLD severity for patients with intermediate or high CHD risk, receiver operating charac- teristic (ROC) curves were performed and then, cut-off values, sensitivity, specificity, and ar- eas under the ROC curves (AUC) with 95% CIs were calculated. Optimal cut-off values were defined as the point at which the value of “sensitivity+specificity-1” was maximum (Youden’s index) (21). The AUCs from ROC curve were compared by DeLong’s method (22). To assess the reliability of the NAFLD grading system, inter-observer reliabilities were calculated using weighted-kappa (κ) statistics and classified as follows: 0–0.20, poor; 0.21–0.40, fair; 0.41–0.60, moderate; 0.61–0.80, good; and 0.81–1.00, excellent agreement. Statistical analyses were per- formed by one statistician using statistical SPSS version 18.0 (SPSS Inc., Chicago, IL, USA) and MedCalc version 15.0 (MedCalc Software, Mariakerke, Belgium). A p-value < 0.05 was considered statistically significant for all tests.
RESULTS
The inter-observer agreement between the two reviewers for the US-determined NAFPD (κ = 0.893, 95% CI, 0.801–0.985) and US-determined NAFLD grading system (κ = 0.949, 95% CI, 0.932–0.962) was excellent. The baseline characteristics of the overall study participants and participants with different degrees of US-determined NAFPD are shown in Table 1.
The mean ± SD age of study participants was 31.3 years (range, 19–40 years). A total of 310 men and 234 women were included. Among the 544 forming the study group, US revealed mild NAFPD in 94 (17.3%), moderate NAFPD in 133 (24.5%), and severe NAFPD in 114 (21.0%) patients. Compared to participants without NAFPD, patients with NAFPD were more likely to be men and smokers; to have a higher BMI, WC and blood pressure; and to have higher ad- verse health metabolic markers (p < 0.001). The overall mean FRS was 7.5, with the FRS being higher among participants with NAFPD than those without NAFPD (p < 0.001).
US-determined NAFPD severity was positively correlated to the FRS (r = 0.624, p < 0.001).
Among the 203 patients without NAFPD, only 16.7% (34/203) were considered at intermedi- ate/high risk for CHD, whereas more than a quarter [27.7% (26/94)] of those with mild NAFPD, nearly two-fifths [39.1% (52/133)] of those with moderate NAFPD, and nearly one-half [50.9%
(58/114)] of those with severe NAFPD were identified as being at intermediate/high CHD risk.
US-determined NAFLD was also positively correlated to the FRS (r = 0.648, p < 0.001). US-de- Table 1. Baseline Characteristics of Study Participants According to NAFPD Severity
Characteristics Overall (n = 544) Severity of Ultrasonography-Determined NAFPD
None (n = 203) Mild (n = 94) Moderate (n = 133) Severe (n = 114)
Age (years) 31.3 (4.8) 31.1 (4.8) 30.7 (5.1) 31.1 (4.4) 32.5 (4.5)
Sex
Men 310 (57.0) 78 (38.4) 51 (54.3) 85 (63.9) 96 (84.2)
Women 234 (43.0) 125 (61.6) 43 (45.7) 48 (36.1) 18 (15.8)
Smoking
Never 192 (35.3) 95 (46.8) 29 (30.9) 38 (28.6) 30 (26.3)
Former 103 (18.9) 32 (15.8) 12 (12.8) 40 (30.1) 19 (16.7)
Current 249 (45.8) 76 (37.4) 53 (56.4) 55 (41.4) 65 (57.0)
Alcohol
None 158 (29.0) 69 (34.0) 24 (25.5) 39 (29.3) 26 (22.8)
Moderate 384 (71.0) 134 (66.0) 70 (74.5) 94 (70.7) 86 (77.2)
BMI (kg/m2) 25.1 (2.7) 23.8 (2.4) 24.7 (2.0) 26.1 (2.2) 26.8 (2.7)
Waist circumference (cm) 83.6 (7.8) 79.7 (8.1) 83.1 (5.3) 86.7 (7.1) 87.1 (6.1)
Systolic BP (mm Hg) 127.6 (11.7) 124.3 (11.3) 129.2 (10.1) 128.5 (11.6) 131.1 (12.4)
Diastolic BP (mm Hg) 83.8 (9.7) 81.3 (10.0) 84.7 (8.0) 84.6 (8.8) 86.7 (10.3)
Use of antihypertensive drug 31 (5.7) 7 (3.4) 5 (5.3) 9 (6.8) 10 (8.8)
Total cholesterol (mg/dL) 204.7 (35.5) 202.4 (35.9) 200.3 (33.1) 206.1 (33.9) 210.6 (38.1)
Triglycerides (mg/dL) 140.6 (92.3) 122.6 (87.6) 143.8 (92.7) 147.7 (79.6.) 161.7 (107.0)
Fasting glucose (mg/dL) 100.7 (13.4) 99.3 (10.1) 101.3 (12.0) 100.6 (13.4) 102.7 (18.6)
AST (IU/L) 28.1 (9.8) 26.0 (6.8) 26.5 (8.0) 30.5 (13.3) 30.1 (10.0)
ALT (IU/L) 31.8 (17.3) 25.7 (11.9) 28.5 (12.1) 36.5 (20.9) 40.1 (19.6)
γGT (IU/L) 44.5 (39.0) 34.7 (25.0) 38.1 (26.9) 58.2 (58.7) 51.1 (33.2)
LDL-cholesterol (mg/dL) 123.3 (33.3) 121.7 (32.2) 117.0 (29.6) 124.3 (33.2) 129.9 (37.0)
HDL-cholesterol (mg/dL) 54.5 (11.8) 58.7 (12.4) 54.5 (10.3) 52.2 (10.5) 49.9 (10.6)
Metabolic syndrome 22 (4.0) 2 (1.0) 3 (3.2) 8 (6.0) 9 (7.9)
Albumin 5.0 (3.2) 5.0 (3.3) 4.8 (3.2) 5.1 (3.3) 5.2 (3.2)
Platelet count 235.8 (48.9) 251.0 (54.5) 243.9 (49.2) 248.9 (45.5) 258.3 (49.6)
Ultrasound-determined NAFLD
Absent 314 (57.7) 159 (78.3) 60 (63.8) 56 (42.1) 39 (34.2)
Mild 173 (31.8) 44 (21.7) 27 (28.7) 57 (42.9) 45 (39.5)
Moderate 52 (9.6) 0 (0) 7 (7.5) 20 (15.0) 25 (21.9)
Severe 5 (0.9) 0 (0) 0 (0) 0 (0) 5 (4.4)
FRS 7.5 (4.3) 5.7 (4.5) 7.2 (4.3) 8.0 (4.2) 8.6 (3.6)
Data are presented as mean (standard deviation) or n (%).
γGT = γ-glutamyltransferase, ALT = alanine aminotransferase, AST = aspartate aminotransferase, BMI = body mass index, BP = blood pressure, FRS = Framingham Risk Score, HDL = high-density lipoprotein, LDL = low-density lipoprotein, NAFLD = non-alcoholic fatty liver disease, NAFPD = non-alcoholic fatty pancreas disease
termined NAFPD and US-determined NAFLD both had a very high correlation to the FRS (r = 0.860, p < 0.001).
In the adjusted multiple logistic regression model, participants with NAFPD had a signifi-
Table 3. AUC of the US-Determined NAFPD and US-Determined NAFLD for Predicting Intermediate/High Risk of Coronary Heart Disease
AUC Sensitivity Specificity p-Value
US-determined NAFPD 0.687
(0.646–0.726)
100 (97.6–100.0)
40.8 (35.9–45.8)
< 0.001
US-determined NAFLD 0.726
(0.687–0.764)
77.9 (70.5–84.2)
62.6 (57.6–67.4)
< 0.001 Combined US-determined NAFPD
and US-determined NAFLD
0.807 (0.771–0.839)
95.5 (90.9–98.2)
67.7 (62.8–72.3)
< 0.001 AUC = area under the receiver operating characteristic curve, NAFLD = non-alcoholic fatty liver disease, NAF- PD = non-alcoholic fatty pancreas disease, US = ultrasound
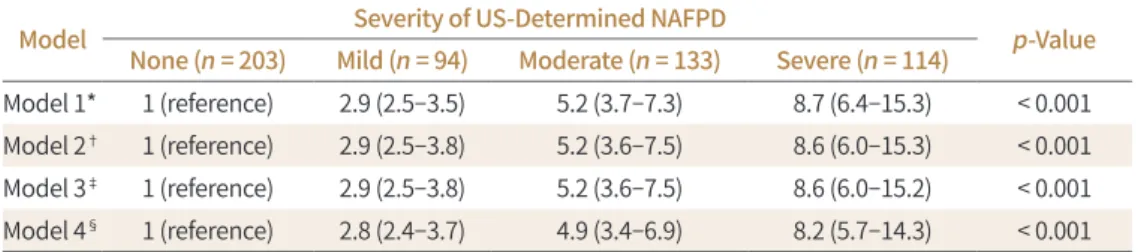
Table 2. Adjusted Odds Ratios According to US-Determined NAFPD Severity for Predicting Intermediate/
High Coronary Heart Disease Risk
Model Severity of US-Determined NAFPD
p-Value None (n = 203) Mild (n = 94) Moderate (n = 133) Severe (n = 114)
Model 1* 1 (reference) 2.9 (2.5–3.5) 5.2 (3.7–7.3) 8.7 (6.4–15.3) < 0.001 Model 2† 1 (reference) 2.9 (2.5–3.8) 5.2 (3.6–7.5) 8.6 (6.0–15.3) < 0.001 Model 3‡ 1 (reference) 2.9 (2.5–3.8) 5.2 (3.6–7.5) 8.6 (6.0–15.2) < 0.001 Model 4§ 1 (reference) 2.8 (2.4–3.7) 4.9 (3.4–6.9) 8.2 (5.7–14.3) < 0.001
*Adjusted for age and sex.
†Further adjusted for baseline smoking status (never, former, and current) and alcohol intake (none and moderate).
‡Further adjusted for body mass index.
§Further adjusted for metabolic syndrome.
NAFPD = non-alcoholic fatty pancreas disease, US = ultrasound
100
80
60
40
20
0
Sensitivity
0 20 40 60 80 100 100-specificity
US_NAFPD (AUC = 0.687) US_NAFLD (AUC = 0.726)
US_NAFPD + US – NAFLD (AUC = 0.807) Fig. 3. ROC curves for predicting in-
termediate/high coronary heart dis- ease risk. The AUC was calculated for US-determined NAFPD alone, US-de- termined NAFLD alone, and a combi- nation of both.
AUC = area under the ROC curve, NAFLD
= non-alcoholic fatty liver disease, NAFPD = non-alcoholic fatty pancreas disease, ROC = receiver operating characteristic, US = ultrasound
cantly higher OR of having intermediate/high CHD risk than those without NAFPD. ORs also increased with increasing severity of NAFPD. When we adjusted for age, sex, smoking, alco- hol consumption, BMI, and metabolic syndrome, the association between NAFPD and inter- mediate/high CHD risk was attenuated, but was still significant (Table 2).
Table 3 presents the AUC values of US-determined NAFPD and US-determined NAFLD for the determination of individuals with intermediate/high CHD risk. The AUCs of US-deter- mined NAFPD and US-determined NAFLD were 0.687 (95% CI: 0.646–0.726) and 0.726 (0.687–
0.764), respectively. There was no significant difference between US-determined NAFPD se- verity and US-determined NAFLD severity in terms of identifying intermediate/high CHD risk (p = 0.17). The combination of US-determined NAFPD severity and US-determined NAFLD severity significantly improved the predictive performance of US-determined severity for intermediate/high CHD risk to 0.807, compared to the predictive value of US-determined NAFPD severity or US-determined NAFPD severity alone (p < 0.001 for both) (Fig. 3).
DISCUSSION
We found out that the US-determined NAFPD severity can be used as an independent fac- tor for intermediate/high risk of CHD. Our result showed that FRS increases in direct propor- tion to US-determined NAFPD severity. Additionally, US-determined NAFPD severity provides complementary information to US-determined NAFLD, improving the accuracy of identify- ing an intermediate/high CHD risk compared to using either measure of severity alone.
NAFPD is the term used for an abnormal accumulation of ectopic pancreatic fat (6). Al- though the relationship between the presence of NAFPD and CHD risk has not been investi- gated, NAFPD has previously been known to be associated with an increased prevalence and incidence of metabolic comorbidities (6, 13). A meta-analysis of 24 studies demonstrated that NAFLD is significantly associated with a 67% higher risk of hypertension, 108% higher risk of diabetes mellitus (DM) and 137% higher risk of metabolic syndrome (13). In particular, it is well-established that the pathogenesis of type 2 DM involves insulin resistance and β cell dys- function. Although there is conflicting evidence regarding the association between pancreat- ic fat accumulation and β cell function, some studies have reported a significant association between pancreatic fat and β cell dysfunction (23, 24). Inversely, a decrease in pancreatic and hepatic fat content to ‘lean’ levels after bariatric surgery is associated with a decrease in insu- lin resistance, restoration of insulin secretion and reversal of type 2 DM (25, 26). Therefore, β cell dysfunction plays an important role in glucose intolerance and insulin resistance, which are associated with increased cardiovascular disease risk accompanied by the presence of an oxidative stress and endothelial injury at the coronary arteries (27, 28). According to previous studies that have investigated the relationship between β cell dysfunction and cardiovascular disease risk, NAFPD may increase the risk of the CHD, as we reported in our study.
Although age is not a risk factor of pancreatic steatosis, prevalence of pancreatic steatosis does increase with advancing age (29-31). However, the relationship between mean pancreat- ic echogenicity and age is not directly proportional, and it has been reported that a sharp de- cline in the mean pancreatic echogenicity occurs after the age of 40 years. Additionally, fatty change (also known as a soft pancreas) is the main factor contributing to the decline in pan-
creatic echogenicity after the age of 40 years (14). To control the effects of age on measured hyperechoicity of the pancreas, we only included individuals between the age of 18 and 40 years.
In our study, we identified a highly positive correlation between NAFPD severity and NAFLD severity (correlation coefficient > 0.8). This finding is supported by a histopathologi- cal study (32), in which pancreatic fat and hepatic fat were significantly correlated with both individuals with NAFPD and NAFLD. Additionally, FL was reported as a predictor of hyper- echoicity of the pancreas, on an endoscopic US (29). However, simple anthropometric mea- sures, such as BMI and WC, were not associated with the NAFPD severity in our study. This suggests BMI and WC alone may not be reliable measures for NAFPD. While obese patients may frequently have increased ectopic fat depositions, it may not always be a consequence of weight gain. We hypothesized that obese individuals are likely to have different metabolic phenotypes including ‘obese but metabolically healthy obese’ individuals who have metabol- ic profiles similar to those of lean individuals (i.e., high insulin sensitivity, high levels of high density lipoprotein, and low triglycerides). Such ‘metabolically healthy’ profiles can protect or lower the risk of these individuals of developing metabolic disorders, despite being obese.
Thus, the absence of NAFPD may be especially useful to characterize a low-risk phenotype of individuals who are deemed to be at high risk for developing metabolic disorders based on their BMI and WC. In the future, the absence of NAFPD may serve as a potential screening tool to prevent low risk obese individuals from undergoing futile bariatric surgery or from consuming therapeutic medications for weight loss.
MRI of the pancreas is considered as the best imaging technique for the diagnosis of NAF- PD. Various MRI-based methods are available to measure pancreatic fat. The three most common methods are in/opposed-phase, Dixon method and the spectral-spatial excitation techniques (33). Additionally, CT, with or without contrast, can be used to for the diagnosis of NAFPD. The density of a steatotic pancreas is similar to that of adipose tissue on CT scan.
Therefore, the amount of pancreatic steatosis on CT can be measured using Hounsfield units, using the spleen as a reference, with a steatotic pancreas being hypodense on CT images, with a negative Hounsfield unit, compared to the spleen (6). However, transabdominal US is the most widely and commonly used imaging technique for the evaluation of NAFPD due to the cost- and time-effectiveness (9-11). On US examination, the echogenicity of the pancreas has been traditionally compared to that of the liver echogenicity (30, 31). However, the reli- ability of this comparison has been brought into question as the liver is metabolically very ac- tive and, therefore, its echogenicity exhibits high variance (34, 35). To address this issue, Lee et al. (11) proposed basing the diagnosis of NAFPD on a comparison of the echogenicity of the pancreas over that of the kidney during US, which provides a more accurate measure of fat in the pancreas than when using the liver for comparison.
Transabdominal US has some limitations, including difficulty in clearly visualizing the pancreas in obese patients, as well as the appearance of pancreatic fibrosis as hyperechogen- ic. To avoid the latter problem, kidneys or liver can be used as a reference point; a higher pancreatic echogenicity compared to liver or kidney indicates pancreatic steatosis, while an echogenicity similar to retroperitoneal fat suggests the highest amount of pancreatic fat de- position (11).
Our study has several limitations which need to be acknowledged. First, the retrospective study design may have led to inevitable biases, including selection or misclassification bias.
Second, although US images were reviewed in PACS rather than in radiology reports, interob- server variability could exist because the US images were examined by various radiologists.
To overcome this limitation interobserver reliability was evaluated and excellent agreement was shown. Third, we did not perform abdominal MRI, which is regarded as the gold standard for diagnosing pancreatic steatosis, and our US classification of NAFPD was not compared to a MRI-based classification. Additionally, we did not perform pancreatic function tests to ex- clude the potential early stages of chronic pancreatitis. Fourth, we did not take into consider- ation of variations in metabolic profile over time, with only one measurement obtained for each participant. Fifth, it is quite difficult to precisely define either non-alcoholic or alcoholic patients because quantifying alcohol consumption is subjective and alcohol ingestion fluctu- ates over time. To overcome this problem, we excluded patients with ambiguous diagnosis.
Finally, our study was conducted in asymptomatic Korean men and women attending regu- lar health screening examinations; thus, our findings may not be generalizable to other pop- ulations, particularly other age or race/ethnicity groups. However, our study is meaningful in that it is the first to study the relationship between US-determined NAFPD severity and CHD and to evaluate the predictive performance of US-determined NAFPD for determining inter- mediate/high CHD risk.
In conclusion, we report a positive association between US-determined NAFPD severity and the prevalence of intermediate/high CHD risk in healthy young adults. More important- ly, US-determined NAFPD severity combined with US-determined NAFLD severity may be useful for predicting which patients may have a higher risk of CHD.
Author Contributions
Conceptualization, Y.S.J.; data curation, A.Y.; formal analysis, Y.S.J., Y.I., K.D.H.; investigation, Y.S.J., Y.I., K.D.H.; methodology, Y.S.J.; supervision, Y.D.M.; validation, Y.S.J., K.D.H.; writing—original draft, A.Y.; and writing—review & editing, Y.S.J., Y.I., K.D.H., Y.D.M.
Conflicts of Interest
The authors have no potential conflicts of interest to disclose.
REFERENCES
1. Britton KA, Fox CS. Ectopic fat depots and cardiovascular disease. Circulation 2011;124:e837-e841 2. Coutinho T, Goel K, Corrêa de Sá D, Kragelund C, Kanaya AM, Zeller M, et al. Central obesity and survival in
subjects with coronary artery disease: a systematic review of the literature and collaborative analysis with individual subject data. J Am Coll Cardiol 2011;57:1877-1886
3. Lee CM, Huxley RR, Wildman RP, Woodward M. Indices of abdominal obesity are better discriminators of cardiovascular risk factors than BMI: a meta-analysis. J Clin Epidemiol 2008;61:646-653
4. Brunt EM, Janney CG, Di Bisceglie AM, Neuschwander-Tetri BA, Bacon BR. Nonalcoholic steatohepatitis: a proposal for grading and staging the histological lesions. Am J Gastroenterol 1999;94:2467-2474
5. Mathur A, Marine M, Lu D, Swartz-Basile DA, Saxena R, Zyromski NJ, et al. Nonalcoholic fatty pancreas dis- ease. HPB (Oxford) 2007;9:312-318
6. Smits MM, Van Geenen EJ. The clinical significance of pancreatic steatosis. Nat Rev Gastroenterol Hepatol 2011;8:169-177
7. Pitt HA. Hepato-pancreato-biliary fat: the good, the bad and the ugly. HPB (Oxford) 2007;9:92-97
8. Hamaguchi M, Kojima T, Itoh Y, Harano Y, Fujii K, Nakajima T, et al. The severity of ultrasonographic find-
ings in nonalcoholic fatty liver disease reflects the metabolic syndrome and visceral fat accumulation. Am J Gastroenterol 2007;102:2708-2715
9. Tariq H, Nayudu S, Akella S, Glandt M, Chilimuri S. Non-alcoholic fatty pancreatic disease: a review of litera- ture. Gastroenterology Res 2016;9:87-91
10. Dasarathy S, Dasarathy J, Khiyami A, Joseph R, Lopez R, McCullough AJ. Validity of real time ultrasound in the diagnosis of hepatic steatosis: a prospective study. J Hepatol 2009;51:1061-1067
11. Lee JS, Kim SH, Jun DW, Han JH, Jang EC, Park JY, et al. Clinical implications of fatty pancreas: correlations between fatty pancreas and metabolic syndrome. World J Gastroenterol 2009;15:1869-1875
12. Targher G, Byrne CD, Lonardo A, Zoppini G, Barbui C. Non-alcoholic fatty liver disease and risk of incident cardiovascular disease: a meta-analysis. J Hepatol 2016;65:589-600
13. Singh RG, Yoon HD, Wu LM, Lu J, Plank LD, Petrov MS. Ectopic fat accumulation in the pancreas and its clinical relevance: a systematic review, meta-analysis, and meta-regression. Metabolism 2017;69:1-13 14. Chantarojanasiri T, Hirooka Y, Kawashima H, Ohno E, Sugimoto H, Hayashi D, et al. Age-related changes in
pancreatic elasticity: when should we be concerned about their effect on strain elastography? Ultrasonics 2016;69:90-96
15. Expert Panel on Detection, Evaluation, and Treatment of High Blood Cholesterol in Adults. Executive sum- mary of the third report of the national cholesterol education program (NCEP) expert panel on detection, evaluation, and treatment of high blood cholesterol in adults (adult treatment panel III). JAMA 2001;285:
2486-2497
16. Lee SY, Park HS, Kim DJ, Han JH, Kim SM, Cho GJ, et al. Appropriate waist circumference cutoff points for central obesity in Korean adults. Diabetes Res Clin Pract 2007;75:72-80
17. Ou HY, Wang CY, Yang YC, Chen MF, Chang CJ. The association between nonalcoholic fatty pancreas dis- ease and diabetes. PLoS One 2013;8:e62561
18. Anderson KM, Odell PM, Wilson PW, Kannel WB. Cardiovascular disease risk profiles. Am Heart J 1991;
121:293-298
19. Anderson KM, Wilson PW, Odell PM, Kannel WB. An updated coronary risk profile. A statement for health professionals. Circulation 1991;83:356-362
20. Zheng W, Xiong YH, Han J, Guo ZX, Li YH, Li AH, et al. Contrast-enhanced ultrasonography of cervical carci- noma: perfusion pattern and relationship with tumour angiogenesis. Br J Radiol 2016;89:20150887 21. Fluss R, Faraggi D, Reiser B. Estimation of the Youden Index and its associated cutoff point. Biom J 2005;
47:458-472
22. DeLong ER, DeLong DM, Clarke-Pearson DL. Comparing the areas under two or more correlated receiver operating characteristic curves: a nonparametric approach. Biometrics 1988;44:837-845
23. Tushuizen ME, Bunck MC, Pouwels PJ, Bontemps S, Van Waesberghe JH, Schindhelm RK, et al. Pancreatic fat content and beta-cell function in men with and without type 2 diabetes. Diabetes Care 2007;30:2916- 2921
24. Heni M, Machann J, Staiger H, Schwenzer NF, Peter A, Schick F, et al. Pancreatic fat is negatively associated with insulin secretion in individuals with impaired fasting glucose and/or impaired glucose tolerance: a nuclear magnetic resonance study. Diabetes Metab Res Rev 2010;26:200-205
25. Gaborit B, Abdesselam I, Kober F, Jacquier A, Ronsin O, Emungania O, et al. Ectopic fat storage in the pan- creas using 1H-MRS: importance of diabetic status and modulation with bariatric surgery-induced weight loss. Int J Obes (Lond) 2015;39:480-487
26. Steven S, Hollingsworth KG, Small PK, Woodcock SA, Pucci A, Aribisala B, et al. Weight loss decreases ex- cess pancreatic triacylglycerol specifically in type 2 diabetes. Diabetes Care 2016:39:158-165
27. Ceriello A, Motz E. Is oxidative stress the pathogenic mechanism underlying insulin resistance, diabetes, and cardiovascular disease? The common soil hypothesis revisited. Arterioscler Thromb Vasc Biol 2004;
24:816-823
28. Murata M, Adachi H, Oshima S, Kurabayashi M. Glucose fluctuation and the resultant endothelial injury are correlated with pancreatic β cell dysfunction in patients with coronary artery disease. Diabetes Res Clin Pract 2017;131:107-115
29. Al-Haddad M, Khashab M, Zyromski N, Pungpapong S, Wallace MB, Scolapio J, et al. Risk factors for hyper- echogenic pancreas on endoscopic ultrasound: a case-control study. Pancreas 2009;38:672-675
30. Glaser J, Stienecker K. Pancreas and aging: a study using ultrasonography. Gerontology 2000;46:93-96
31. Worthen NJ, Beabeau D. Normal pancreatic echogenicity: relation to age and body fat. AJR Am J Roent- genol 1982;139:1095-1098
32. Van Geenen EJ, Smits MM, Schreuder TC, Van der Peet DL, Bloemena E, Mulder CJ. Nonalcoholic fatty liver disease is related to nonalcoholic fatty pancreas disease. Pancreas 2010;39:1185-1190
33. Pezzilli R, Calculli L. Pancreatic steatosis: is it related to either obesity or diabetes mellitus? World J Diabe- tes 2014;5:415-419
34. Piekarski J, Goldberg HI, Royal SA, Axel L, Moss AA. Difference between liver and spleen CT numbers in the normal adult: its usefulness in predicting the presence of diffuse liver disease. Radiology 1980;137:727-729 35. Quinn SF, Gosink BB. Characteristic sonographic signs of hepatic fatty infiltration. AJR Am J Roentgenol
1985;145:753-755
중간/고위험성 관상동맥심장질환 위험성을 예측하는데 있어 초음파상 비알콜성 지방췌장의 정도의 정확성
안영훈1 · 윤성종2* · 양인호3 · 김동현4 · 양달모1
목적 본 연구에서는 초음파상 비알콜성 지방췌장(ultrasound-non-alcoholic fatty pancreas disease; 이하 US-NAFPD)이 관상동맥심장질환(coronary heart disease; 이하 CHD)의 위 험인자인지를 알아보고 중간/고위험성 CHD 위험성을 예측하는데 있어 US-NAFPD과 초음 파상 비알콜성 지방간(ultrasound-non-alcoholic fatty liver disease; 이하 US-NAFLD)의 정확도를 비교하고자 하였다.
대상과 방법 본 연구는 후향적 연구로써 젊은 성인(18~40세) 544명을 대상으로 하였다. US- NAFPD와 US-NAFLD는 경도, 중등도, 고도로 분류하였다. CHD 위험성은 Framingham Risk Score (이하 FRS)를 통하여 계산하였다. 통계적으로는 연관성 검사, 다변량 회귀 분석, 수신기작동특성곡선을 이용하였다.
결과 FRS가 증가함에 따라 US-NAFPD의 정도가 증가하는 경향을 보였으며(r = 0.624, p <
0.001), US-NAFPD의 정도가 중간/고위험성 CHD 위험성을 예측하는데 있어 유의한 인자로 나왔다. US-NAFPD와 US-NAFLD를 비교하였을 때 CHD 위험성의 예측정확도는 유의한 차 이가 없었다(p = 0.17). US-NAFPD와 US-NAFLD의 정도를 복합적으로 평가하였을 때 중간/
고위험성 CHD 위험성의 예측정확도가 유의하게 증가하는 것을 알 수 있었다(수신기작동특 성곡선면적, 0.807; p < 0.001).
결론 US-NAFPD는 FRS와 상관성을 보였으며 중간/고위험성 CHD 위험성을 예측할 수 있는 인자임을 알 수 있었다. US-NAFPD과 US-NAFLD의 정도를 복합적으로 평가함으로써 CHD 위험성을 예측하는데 유용할 것이라 판단된다.
1경희대학교 의과대학 강동경희대학교병원 영상의학과,
2군포G샘병원 영상의학과,
3경희대학교 의과대학 강동경희대학교병원 심장내과,
4서울대학교 의과대학 서울대학교병원 영상의학과