Influence of Body Mass Index, Smoking, and Blood Pressure on Survival of Patients with Surgically-Treated, Low Stage Renal Cell Carcinoma: A 14-Year Retrospective Cohort Study
The association of body mass index, smoking, and blood pressure, which are related to the three well-established risk factors of renal cell carcinoma, and survival in patients with renal cell carcinoma is not much studied. Our objective was to evaluate this association. A cohort of 1,036 patients with low stage (pT1 and pT2) renal cell carcinoma who underwent radical or partial nephrectomy were enrolled. We retrospectively reviewed medical records and collected survival data. The body mass index, smoking status, and blood pressure at the time of surgery were recorded. Patients were grouped according to their obesity grade, smoking status, and hypertension stage. Survival analysis showed a significant decrease in overall (P = 0.001) and cancer-specific survival (P < 0.001) with being underweight, with no differences of smoking status or perioperative blood pressure. On multivariate analysis, perioperative blood pressure ≥ 160/100 mmHg (HR, 2.642; 95% CI, 1.221-5.720) and being underweight (HR, 4.320; 95% CI, 1.557-11.984) were independent predictors of overall and cancer-specific mortality, respectively. Therefore, it is concluded that being underweight and perioperative blood pressure ≥ 160/100 mmHg negatively affect cancer- specific and overall survival, respectively, while smoking status does not influence survivals in patients with renal cell carcinoma.
Key Words: Carcinoma, Renal Cell; Body Mass Index; Smoking; Blood Pressure; Survival
Bumsoo Park,1,2,3 Byong Chang Jeong,1,2Seong Il Seo,1,2 Seong Soo Jeon,1,2 Han Yong Choi,1 and Hyun Moo Lee1,2
1Department of Urology, 2Institute for Refractory Cancer Research, Samsung Medical Center, Sungkyunkwan University School of Medicine, Seoul; 3Department of Urology, Kangnam General Hospital, Yongin, Korea
Received: 5 September 2012 Accepted: 26 December 2012 Address for Correspondence:
Hyun Moo Lee, MD
Department of Urology, Samsung Medical Center, Sungkyunkwan University School of Medicine, 81 Irwon-ro, Gangnam-gu, Seoul 135-710, Korea
Tel: +82.2-3410-3559, Fax: +82.2-3410-6992 E-mail [email protected]
http://dx.doi.org/10.3346/jkms.2013.28.2.227 • J Korean Med Sci 2013; 28: 227-236
INTRODUCTION
Obesity, cigarette smoking, and hypertension are three well-es- tablished risk factors for developing renal cell carcinoma (RCC), and epidemiological studies have consistently suggested evi- dence for an association between these risk factors and the eti- ology of RCC (1-3). However, the influence of these risk factors on prognosis and survival in patients with RCC has not been well studied, especially before the early 2000s. Recently, a number of studies have provided evidence that being overweight or obese, as measured by the body mass index, is a favorable prognostic factor in patients with RCC (4-11). A few studies have shown that smoking may increase the risk of mortality in patients with RCC (12-14), but there have been very few studies and inconsis- tent conclusions concerning blood pressure (15, 16). The prog- nostic value of smoking and blood pressure for RCC survival therefore remains unclear, compared to the increasing aware- ness of body mass index as a prognostic factor.
The current literature does not contain any studies that fully evaluate the association between these three major risk param- eters and overall or cancer-specific survival in patients with RCC.
Furthermore, most of the studies in the literature were conduct- ed for RCC with all pathologic T stages (T1-T4). Therefore, the association of the three risk parameters and the survival of low stage (pT1 and pT2) RCC is still unclear. Our objective was to assess the influence of body mass index, smoking, and blood pressure on overall and cancer-specific survival in patients with pT1 and pT2 RCC.
MATERIALS AND METHODS
Data collectionA total of 1,545 patients with RCC who underwent radical or par-
tial nephrectomy between October 1994 and December 2008
were initially selected. The exclusion criteria were: 1) pediatric
patients (age under 20 yr); 2) pT3 and pT4 stage renal cell carci-
noma; and 3) less than 12 months of follow-up. Patients with
clinical lymph node positivity or distant metastasis on preoper-
ative imaging were included because they were not pathologi-
cally proven preoperatively. Therefore, a cohort of 1,036 patients
was finally enrolled in this study. We retrospectively reviewed
the medical records of the cohort, and then followed them to
obtain survival and the cause of death data available from the Department of Medical Records in our hospital and the Korea National Statistics Office. The designated endpoint date was December 31, 2008. Body mass index, smoking status, and blood pressure at the time of surgery were recorded. The body mass index was calculated by a single author using height and weight of the patients measured preoperatively. Smoking status was in- terviewed by ward nurses before surgery and recorded on med- ical records. Blood pressure was measured pre- and postopera- tively on a daily basis and a single author calculated the mean value of three consecutive blood pressures measured one day before surgery and two consecutive postoperative days. The du- ration of survival was calculated from the date of surgery to the date of death or to the study endpoint. Other demographic co- variates including cancer stage and Fuhrman grade were col- lected. The stage for RCC was recorded based on the 2010 7th edition American Joint Committee on Cancer (AJCC) TNM stag- ing system. Pathologic T stage was obtained from the patholog- ic documentation of surgical specimen. Because not all patients underwent lymphadenectomies or metastasectomies, clinical N and M stage were obtained from preoperative and follow-up imaging studies such as computed tomography and bone scans.
The obesity grade was classified using the World Health Or- ganization (WHO) recommendation for Asians based on body mass index (underweight < 18.5 kg/m
2; normal weight ≥ 18.5 to < 23 kg/m
2; overweight ≥ 23 to < 27.5 kg/m
2; obese ≥ 27.5 kg/m
2) (17). Smoking status was recorded as non-smoker, for- mer smoker, or current smoker. The perioperative blood pres- sure was classified using the definition of hypertension stage from the Joint National Committee-7 (JNC-7) (blood pressure:
normal < 120/80 mmHg; prehypertension 120-139/80-89 mmHg;
stage 1 hypertension 140-159/90-99 mmHg; stage 2 hyperten- sion ≥ 160/100 mmHg) (18). All patients were grouped accord- ing to these classifications.
Statistical methods
To compare the distribution of important clinical and pathologic covariates across each of the three risk factors, we employed one-way analysis of variance (ANOVA), chi-square tests, and Fisher’s exact tests. A life table analysis was conducted by plot- ting survival curves and statistical significance was deduced by the Gehan’s Wilcoxon test. A Cox proportional hazards regres- sion model was used for multivariate analysis. Step-wise regres- sion techniques were used to build multivariate models using a significance level of 0.15 for the variable to remain in the model.
Also, covariates with no significance on univariate analysis were also included in the model if they were those that the authors intended to know the association with patient survival. All anal- yses were performed using SPSS v.19.0 (SPSS Inc., Chicago, IL, USA), and a P value < 0.05 was considered statistically signifi- cant.
Ethics statement
The study protocol was approved by the institutional review board of the Samsung Medical Center (IRB File No. 2011-07- 061). Informed consent was waived by the board.
RESULTS
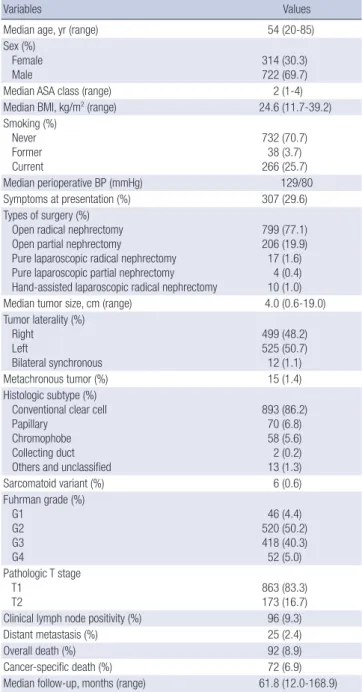
Baseline demographic data of the entire cohort are summarized in Table 1.
Body mass index
Of the 1,036 cohort in our study, 23 patients (2.2%) were catego-
Table 1. Baseline demographic data of the entire cohort (1994-2008; n = 1,036)
Variables Values
Median age, yr (range) 54 (20-85)
Sex (%) Female
Male 314 (30.3)
722 (69.7)
Median ASA class (range) 2 (1-4)
Median BMI, kg/m2 (range) 24.6 (11.7-39.2)
Smoking (%) Never Former Current
732 (70.7) 38 (3.7) 266 (25.7)
Median perioperative BP (mmHg) 129/80
Symptoms at presentation (%) 307 (29.6)
Types of surgery (%) Open radical nephrectomy Open partial nephrectomy
Pure laparoscopic radical nephrectomy Pure laparoscopic partial nephrectomy Hand-assisted laparoscopic radical nephrectomy
799 (77.1) 206 (19.9) 17 (1.6)
4 (0.4) 10 (1.0)
Median tumor size, cm (range) 4.0 (0.6-19.0)
Tumor laterality (%) Right
Left
Bilateral synchronous
499 (48.2) 525 (50.7) 12 (1.1)
Metachronous tumor (%) 15 (1.4)
Histologic subtype (%) Conventional clear cell Papillary
Chromophobe Collecting duct Others and unclassified
893 (86.2) 70 (6.8) 58 (5.6) 2 (0.2) 13 (1.3)
Sarcomatoid variant (%) 6 (0.6)
Fuhrman grade (%) G1
G2 G3 G4
46 (4.4) 520 (50.2) 418 (40.3) 52 (5.0) Pathologic T stage
T1 T2
863 (83.3) 173 (16.7) Clinical lymph node positivity (%) 96 (9.3)
Distant metastasis (%) 25 (2.4)
Overall death (%) 92 (8.9)
Cancer-specific death (%) 72 (6.9)
Median follow-up, months (range) 61.8 (12.0-168.9) ASA, American Society of Anesthesiologists; BMI, body mass index; BP, blood pressure.
rized as underweight, 288 (27.8%) as normal weight, 555 (53.6%) as overweight, and 170 (16.4%) as obese (Table 2). Significant differences were noted in age, sex, the American Society of An- esthesiologists (ASA) class, perioperative blood pressure, histo- ry of hypertension, type of surgery, and pathologic T stage.
As shown in the life table survival plots (Fig. 1A), the overall and cancer-specific survivals significantly decreased with being underweight compared to being normal, overweight, and obese (P = 0.001 for overall survival; P < 0.001 for cancer-specific sur- vival). The overall and cancer-specific survivals five years after surgery were 73% and 73% for underweight, 90% and 92% for normal weight, 92% and 94% for overweight, and 90% and 93%
for obese patients, respectively. There were no significant differ-
ences in overall and cancer-specific survival between the nor- mal and overweight, and overweight and obese groups.
Smoking
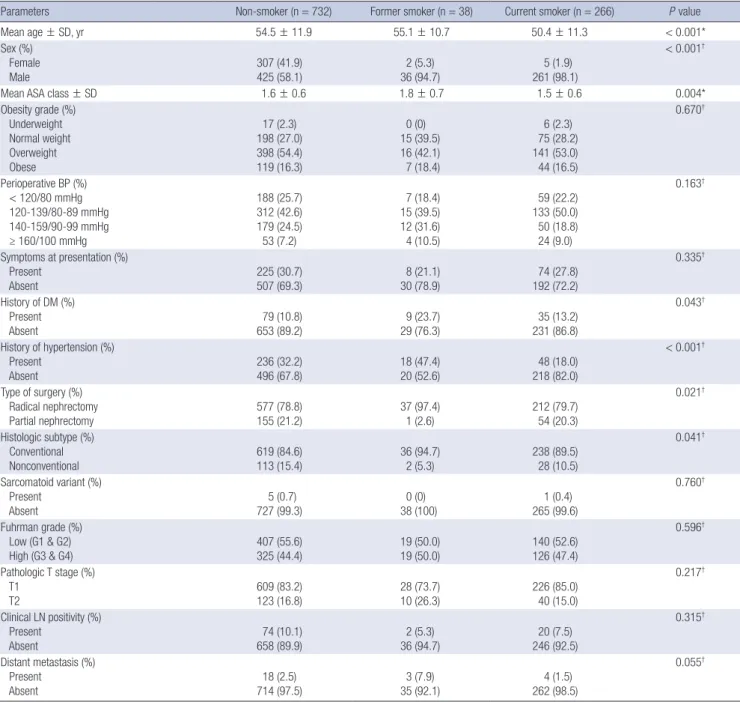
A total of 732 patients (70.7%) were categorized as non-smokers, 38 (3.6%) as former smokers, and 266 (25.7%) as current smok- ers (Table 3). Significant differences were noted in age, sex, ASA class, history of hypertension, type of surgery, and histologic sub- type. At survival analysis, the overall and cancer-specific surviv- als 5 yr after surgery were 90% and 92% for non-smokers, 87%
and 92% for former smokers, and 94% and 94% for current smokers, respectively. The life table survival plots did not reveal any significant differences in overall (P = 0.138) and cancer-spe-
Table 2. Comparison of clinicopathologic features among groups classified by obesity gradeParameters Underweight (n = 23) Normal weight (n = 288) Overweight (n = 555) Obese (n = 170) P value
Mean age ± SD, yr 56.7 ± 15.3 51.4 ± 12.2 54.4 ± 11.6 53.3 ± 11.2 0.003*
Sex (%) Female Male
10 (43.5) 13 (56.5)
111 (38.5) 177 (61.5)
142 (25.6) 413 (74.4)
51 (30.0) 119 (70.0)
0.001†
Mean ASA class ± SD 1.8 ± 0.6 1.5 ± 0.6 1.6 ± 0.6 1.7 ± 0.6 0.015*
Perioperative BP (%) < 120/80 mmHg 120-139/80-89 mmHg 140-159/90-99 mmHg ≥ 160/100 mmHg
8 (34.8) 10 (43.5) 2 (8.7) 3 (13.0)
97 (33.7) 127 (44.1) 51 (17.7) 13 (4.5)
122 (22.0) 252 (45.4) 130 (23.4) 51 (9.2)
27 (15.9) 71 (41.8) 58 (34.1) 14 (8.2)
< 0.001†
Smoking (%)
Ever (former & current) Never
6 (26.1) 17 (73.9)
90 (31.2) 198 (68.8)
157 (28.3) 398 (71.7)
51 (30.0) 119 (70.0)
0.812†
Symptoms at presentation (%) Present
Absent 11 (47.8)
12 (52.2) 94 (32.6)
194 (67.4) 153 (27.6)
402 (72.4) 49 (28.8)
121 (71.2)
0.107†
History of DM (%) Present
Absent 1 (4.3)
22 (95.7) 27 (9.4)
261 (90.6) 66 (11.9)
489 (88.1) 29 (17.1)
141 (82.9)
0.062†
History of hypertension (%) Present
Absent 4 (17.4)
19 (82.6) 52 (18.1)
236 (81.9) 174 (31.4)
381 (68.6) 72 (42.4)
98 (57.6)
< 0.001†
Type of surgery (%) Radical nephrectomy
Partial nephrectomy 22 (95.7)
1 (4.3) 239 (83.0)
49 (17.0) 439 (79.1)
116 (20.9) 126 (74.1)
44 (25.9)
0.030†
Histologic subtype (%) Conventional
Nonconventional 17 (73.9)
6 (26.1) 240 (83.3)
48 (16.7) 485 (87.4)
70 (12.6) 151 (88.8)
19 (11.2)
0.088†
Sarcomatoid variant (%) Present
Absent 0 (0)
23 (100) 2 (0.7)
286 (99.3) 3 (0.5)
552 (99.5) 1 (0.6)
169 (99.4)
0.975†
Fuhrman grade (%) Low (G1 & G2)
High (G3 & G4) 12 (52.2)
11 (47.8) 154 (53.5)
134 (46.5) 302 (54.4)
253 (45.6) 98 (57.6)
72 (42.4)
0.838†
Pathologic T stage (%) T1
T2 13 (56.5)
10 (43.5) 221 (76.7)
67 (23.3) 483 (87.0)
72 (13.0) 146 (85.9)
24 (14.1)
< 0.001†
Clinical LN positivity (%) Present
Absent 3 (13.0)
20 (87.0) 31 (10.8)
257 (89.2) 47 (8.5)
508 (91.5) 15 (8.8)
155 (91.2)
0.655†
Distant metastasis (%) Present
Absent 2 (8.7)
21 (91.3) 8 (2.8)
280 (97.2) 11 (2.0)
544 (98.0) 4 (2.4)
166 (97.6)
0.216†
*One-way ANOVA; †Chi-square and Fisher’s exact test. SD, standard deviation; ASA, American Society of Anesthesiologists; BP, blood pressure; DM, diabetes mellitus; LN, lymph node.
cific survivals (P = 0.475) among the three groups (Fig. 1B).
Blood pressure
A total of 254 patients (24.5%) were categorized as normal blood pressure (< 120/80 mmHg), 460 (44.4%) as prehypertension (120-139/80-89 mmHg), 241 (23.3%) as stage 1 hypertension (140-159/90-99 mmHg), and 81 (7.8%) as stage 2 hypertension
(≥ 160/100 mmHg). Age, sex, ASA class, obesity grade, history of diabetes mellitus, and history of hypertension differed among the four groups (Table 4). At survival analysis, the overall and cancer-specific survivals five years after surgery were 92% and 94% for normal blood pressure, 91% and 93% for prehyperten- sion, 91% and 93% for stage 1 hypertension, and 84% and 92%
for stage 2 hypertension, respectively. Life table survival plots
Fig. 1. Life table survival plots according to obesity grade (A), smoking status (B), and periperative blood pressure (C) with regard to the overall and cancer-specific survival in patients with surgically treated, low stage (pT1 and pT2) renal cell carcinoma.Overall survival Cancer-specific survival
Follow-up (months) Follow-up (months)
0 50 100 150 200 0 50 100 150 200
Overall: P = 0.010
Underweight vs Normal: P = 0.020
Normal vs Overweight: P = 0.165
Overweight vs Obese: P = 0.305
Overall: P < 0.001
Underweight vs Normal: P = 0.009
Normal vs Overweight: P = 0.055
Overweight vs Obese: P = 0.619
1.0
0.8
0.6
0.4
0.2
0.0
1.0
0.9
0.8
0.7
0.6
0.5
Obesity grade Underweight Normal Overweight Obese
A
Overall survival Cancer-specific survival
Follow-up (months) Follow-up (months)
0 50 100 150 200 0 50 100 150 200
1.0
0.8
0.6
0.4
0.2
0.0
1.0
0.9
0.8
0.7
0.6
P = 0.138 P = 0.475
Smoking Never Former Current
B
Overall survival Cancer-specific survival
Follow-up (months) Follow-up (months)
0 50 100 150 200 0 50 100 150 200
1.0
0.8
0.6
0.4
0.2
0.0
1.0 0.9 0.8 0.7 0.6 0.5 0.4
P = 0.162 P = 0.973
C Perioperative blood pressure (mmHg)
< 120/80 120-139/80-89 140-159/90-99
≥ 160/100
did not reveal any significant differences in overall (P = 0.162) and cancer-specific survivals (P = 0.973) among the four groups (Fig. 1C).
Multivariate analysis
Age, Fuhrman grade, and distant metastasis were common in- dependent predictors affecting both overall and cancer-specific mortalities (Tables 5, 6). Perioperative blood pressure (P = 0.022) was an independent predictor for overall mortality, whereas obesity grade (P = 0.033) and erythrocyte segmentation rate (P = 0.037) were independent predictors for cancer-specific
mortality. However, although not statistically significant, there was a strong trend for obesity grade to predict overall mortality (P = 0.086) and perioperative blood pressure to predict cancer- specific mortality (P = 0.082). Specifically, perioperative blood pressure of stage 2 hypertension degree (≥ 160/100 mmHg) was an independent predictor for overall mortality (HR, 2.642; 95%
CI, 1.221-5.720) compared to normal blood pressure, while be- ing underweight was an independent predictor for cancer-spe- cific mortality (HR, 4.320; 95% CI, 1.557-11.984) compared to normal weight. However, smoking status was found not to in- fluence overall and cancer-specific mortalities independently.
Table 3. Comparison of clinicopathologic features among groups classified by smoking status
Parameters Non-smoker (n = 732) Former smoker (n = 38) Current smoker (n = 266) P value
Mean age ± SD, yr 54.5 ± 11.9 55.1 ± 10.7 50.4 ± 11.3 < 0.001*
Sex (%) Female Male
307 (41.9) 425 (58.1)
2 (5.3) 36 (94.7)
5 (1.9) 261 (98.1)
< 0.001†
Mean ASA class ± SD 1.6 ± 0.6 1.8 ± 0.7 1.5 ± 0.6 0.004*
Obesity grade (%) Underweight Normal weight Overweight Obese
17 (2.3) 198 (27.0) 398 (54.4) 119 (16.3)
0 (0) 15 (39.5) 16 (42.1) 7 (18.4)
6 (2.3) 75 (28.2) 141 (53.0) 44 (16.5)
0.670†
Perioperative BP (%) < 120/80 mmHg 120-139/80-89 mmHg 140-159/90-99 mmHg ≥ 160/100 mmHg
188 (25.7) 312 (42.6) 179 (24.5) 53 (7.2)
7 (18.4) 15 (39.5) 12 (31.6) 4 (10.5)
59 (22.2) 133 (50.0) 50 (18.8) 24 (9.0)
0.163†
Symptoms at presentation (%) Present
Absent
225 (30.7) 507 (69.3)
8 (21.1) 30 (78.9)
74 (27.8) 192 (72.2)
0.335†
History of DM (%) Present
Absent 79 (10.8)
653 (89.2) 9 (23.7)
29 (76.3) 35 (13.2)
231 (86.8)
0.043†
History of hypertension (%) Present
Absent 236 (32.2)
496 (67.8) 18 (47.4)
20 (52.6) 48 (18.0)
218 (82.0)
< 0.001†
Type of surgery (%) Radical nephrectomy
Partial nephrectomy 577 (78.8)
155 (21.2) 37 (97.4)
1 (2.6) 212 (79.7)
54 (20.3)
0.021†
Histologic subtype (%) Conventional
Nonconventional 619 (84.6)
113 (15.4) 36 (94.7)
2 (5.3) 238 (89.5)
28 (10.5)
0.041†
Sarcomatoid variant (%) Present
Absent 5 (0.7)
727 (99.3) 0 (0)
38 (100) 1 (0.4)
265 (99.6)
0.760†
Fuhrman grade (%) Low (G1 & G2)
High (G3 & G4) 407 (55.6)
325 (44.4) 19 (50.0)
19 (50.0) 140 (52.6)
126 (47.4)
0.596†
Pathologic T stage (%) T1
T2 609 (83.2)
123 (16.8) 28 (73.7)
10 (26.3) 226 (85.0)
40 (15.0)
0.217†
Clinical LN positivity (%) Present
Absent 74 (10.1)
658 (89.9) 2 (5.3)
36 (94.7) 20 (7.5)
246 (92.5)
0.315†
Distant metastasis (%) Present
Absent 18 (2.5)
714 (97.5) 3 (7.9)
35 (92.1) 4 (1.5)
262 (98.5)
0.055†
*One-way ANOVA; †Chi-square and Fisher’s exact test. SD, standard deviation; ASA, American Society of Anesthesiologists; BP, blood pressure; DM, diabetes mellitus; LN, lymph node.
DISCUSSION
A number of recent studies have provided evidence indicating that being overweight and/or obese, as indicated by body mass index, are favorable prognostic factors in patients with RCC (4- 11). By a similar context, other studies have reported that being underweight is an unfavorable prognostic factor (19-21). Sever- al explanations for why being overweight and/or obese are as- sociated with a better prognosis, or why being underweight is associated with a worse prognosis have been suggested. Yu et al. (22), in their first report of obesity as a favorable prognostic factor in RCC, postulated that the increased amount of fat be- tween the kidney and the Gerota’s fascia in obese patients might
function as a barrier to further invasion of cancer cells. Hafer- kamp and associates (19) suggested cachexia as one reason for underweight patients having a poorer prognosis. They reported that up-regulated tissue catabolism and impaired anabolism, release of tumor-derived catabolic factors and inflammatory cytokines, and neuroendocrine dysfunction could possibly af- fect patient survival. This hypothesis was supported by a study by Kim et al. (23) who reported that cachexia-like symptoms in- dependently predicted a worse prognosis. Another possible ex- planation was suggested by Rasmuson and colleagues (24), who reported that serum insulin-like growth factor-1 was positively correlated with body mass index, and the increased insulin-like growth factor-1 in obese patients might be associated with in-
Table 4. Comparison of clinicopathologic features among groups classified by perioperative blood pressure (mmHg)Parameters < 120/80
(n = 254) 120-139/80-89
(n = 460) 140-159/90-99
(n = 241) ≥ 160/100
(n = 81) P value
Mean age ± SD, yr 51.4 ± 12.4 53.0 ± 11.9 55.4 ± 11.3 56.7 ± 9.5 < 0.001*
Sex (%) Female Male
99 (39.0)
155 (61.0) 117 (25.4)
343 (74.6) 75 (31.1)
166 (68.9) 23 (28.4)
58 (71.6)
0.002†
Mean ASA class ± SD 1.5 ± 0.6 1.5 ± 0.5 1.6 ± 0.6 1.8 ± 0.5 < 0.001*
Obesity grade (%) Underweight Normal weight Overweight Obese
8 (3.1) 97 (38.2) 122 (48.0) 27 (10.6)
10 (2.2) 127 (27.6) 252 (54.8) 71 (15.4)
2 (0.8) 51 (21.2) 130 (53.9) 58 (24.1)
3 (3.7) 13 (16.0) 51 (63.0) 14 (17.3)
< 0.001†
Smoking (%)
Ever (former & current) Never
66 (26.0)
188 (74.0) 148 (32.2)
312 (67.8) 62 (25.7)
179 (74.3) 28 (34.6)
53 (65.4)
0.125†
Symptoms at presentation (%) Present
Absent
68 (26.8)
186 (73.2) 129 (28.0)
331 (72.0) 80 (33.2)
161 (66.8) 30 (37.0)
51 (63.0)
0.161†
History of DM (%) Present Absent
22 (8.7) 232 (91.3)
50 (10.9) 410 (89.1)
41 (17.0) 200 (83.0)
10 (12.3) 71 (87.7)
0.029†
History of hypertension (%) Present
Absent
41 (16.1) 213 (83.9)
112 (24.3) 348 (75.7)
101 (41.9) 140 (58.1)
48 (59.3) 33 (40.7)
< 0.001†
Type of surgery (%) Radical nephrectomy Partial nephrectomy
199 (78.3)
55 (21.7)
358 (77.8) 102 (22.2)
201 (83.4) 40 (16.6)
68 (84.0) 13 (16.0)
0.237†
Histologic subtype (%) Conventional Nonconventional
216 (85.0)
38 (15.0)
400 (87.0) 60 (13.0)
207 (85.9) 34 (14.1)
70 (86.4) 11 (13.6)
0.912†
Sarcomatoid variant (%) Present
Absent
0 (0) 254 (100)
3 (0.7) 457 (99.3)
2 (0.8) 239 (99.2)
1 (1.2) 80 (98.8)
0.496†
Fuhrman grade (%) Low (G1 & G2) High (G3 & G4)
134 (52.8) 120 (47.2)
262 (57.0) 198 (43.0)
124 (51.5) 117 (48.5)
46 (56.8) 35 (43.2)
0.475†
Pathologic T stage (%) T1
T2
217 (85.4)
37 (14.6)
392 (85.2) 68 (14.8)
193 (80.1) 48 (19.9)
61 (75.3) 20 (24.7)
0.056†
Clinical LN positivity (%) Present
Absent
25 (9.8) 229 (90.2)
38 (8.3) 422 (91.7)
21 (8.7) 220 (91.3)
12 (14.8) 69 (85.2)
0.295†
Distant metastasis (%) Present
Absent
8 (3.1)
246 (96.9) 12 (2.6)
448 (97.4) 5 (2.1)
236 (97.9) 0 (0)
81 (100)
0.427†
*One-way ANOVA; †Chi-square and Fisher’s exact test. SD, standard deviation; ASA, American Society of Anesthesiologists; DM, diabetes mellitus; LN, lymph node.
creased survival. The association between body mass index and tumor characteristics can be another factor to consider, but is still uncertain. Parker et al. (6) reported that patients with a body mass index ≥ 25 kg/m
2had less aggressive tumors. Naya and associates (25) revealed that visceral adipose tissue, as assessed by computed tomography, in patients with stage 1 disease was significantly greater than that in patients with more advanced disease. In contrast, Schips and colleagues (26) could not affirm a significant correlation between body mass index and patho- logic T stage and tumor grading. In our study, we found a statis- tically significant trend that more tumors with pathologic T2
stage occurred than T1 stage as the obesity grade decreased (Table 2). This difference might be regarded as a biased phe- nomenon because one may think that the difference in patient survival was not affected by obesity grade but by pathologic T stage. But our multivariate analysis showed that obesity grade independently affected cancer-specific mortality after adjust- ment for pathologic T and clinical N and M stage (Table 6). Thus, it is likely that body mass index can affect patient survival inde- pendently, irrespective of the tumor stage.
As mentioned above, most of the current literatures have stat- ed that being overweight and/or obese are favorable prognostic
Table 5. Univariate and multivariate analysis of variables influencing overall mortalityVariables Univariate Multivariate
HR (95% CI) P value HR (95% CI) P value
Age 1.063 (1.043-1.083) < 0.001 1.049 (1.026-1.073) < 0.001
ASA class 1 2 3 4
1 2.077 (1.296-3.329) 3.694 (1.768-7.719) 0.000 (0.000-3.086)
0.002 - 0.002 0.001 0.969
1 1.177 (0.667-2.079) 1.163 (0.467-2.897) 0.002 (0.000-3.003)
0.956 - 0.574 0.745 0.974 Obesity grade
Normal Overweight Obese Underweight
1 0.816 (0.506-1.317) 0.950 (0.507-1.779) 2.964 (1.226-7.166)
0.033 - 0.405 0.873 0.016
1 1.130 (0.628-2.033) 1.632 (0.791-3.366) 3.250 (1.207-8.752)
0.086 - 0.684 0.185 0.020 Smoking
Never Former Current
1 1.210 (0.523-2.798) 0.610 (0.362-1.029)
0.141 - 0.655 0.064
1 0.657 (0.192-2.252) 1.005 (0.505-2.002)
0.795 - 0.504 0.989 Perioperative blood pressure
< 120/80 mmHg 120-139/80-89 mmHg 140-159/90-99 mmHg ≥ 160/100 mmHg
1 1.109 (0.625-1.971) 1.002 (0.520-1.929) 2.372 (1.219-4.615)
0.022 - 0.723 0.996 0.011
1 1.330 (0.695-2.543) 0.785 (0.371-1.660) 2.642 (1.221-5.720)
0.010 - 0.389 0.526 0.014 Alcohol intake
Never Former Current
1 1.075 (0.392-2.949) 0.407 (0.239-0.692)
0.004 - 0.888 0.001
1 1.178 (0.276-5.033) 0.569 (0.288-1.127)
0.240 - 0.825 0.106
History of diabetes mellitus 1.744 (1.040-2.923) 0.035 1.444 (0.703-2.969) 0.317
History of hypertension 1.320 (0.858-2.030) 0.207 0.751 (0.429-1.315) 0.317
Fasting blood glucose 1.006 (1.001-1.010) 0.007 1.002 (0.996-1.008) 0.501
Hemoglobin level 0.795 (0.720-0.878) < 0.001 0.931 (0.796-1.088) 0.366
Serum creatinine 1.238 (1.068-1.436) 0.005 1.176 (0.971-1.424) 0.097
Serum albumin 0.488 (0.351-0.679) < 0.001 1.136 (0.713-1.810) 0.591
Serum ALP 1.012 (1.008-1.016) < 0.001 1.004 (0.997-1.010) 0.248
ESR 1.022 (1.016-1.027) < 0.001 1.008 (0.999-1.017) 0.088
Symptoms at presentation 2.303 (1.523-3.483) < 0.001 1.200 (0.736-1.956) 0.464
Type of surgery Radical nephrectomy
Partial nephrectomy 1
0.325 (0.131-0.803)
0.015 -
0.015 1
0.507 (0.170-1.516)
0.224 - 0.224
Sarcomatoid variant 5.587 (1.366-22.855) 0.017 2.009 (0.437-9.232) 0.370
Fuhrman grade Low (G1 + G2)
High (G3 + G4) 1
2.528 (1.651-3.871)
< 0.001 -
< 0.001 1
1.831 (1.108-3.024)
0.018 - 0.018 Pathologic T stage
T1
T2 1
2.654 (1.734-4.064)
< 0.001 -
< 0.001 1
1.212 (0.701-2.095)
0.491 - 0.491
Clinical LN positivity 1.983 (1.121-3.507) 0.019 1.506 (0.534-2.087) 0.876
Distant metastasis 15.229 (8.713-26.617) < 0.001 10.537 (5.391-20.595) < 0.001
HR, hazard ratio; CI, confidence interval; ASA, American Society of Anesthesiologists; ALP, alkaline phosphatase; ESR, erythrocyte segmentation rate; LN, lymph node.
factors for cancer-specific survival, but not for overall survival (4, 6-11). Few studies have focused on the effect of being under- weight in the prognosis of patients with RCC. A study by Hafer- kamp and colleagues (19) concluded that being underweight worsened the prognosis by more than four times (HR, 4.27; 95%
CI, 1.47-12.4), which is very similar to our study (HR, 4.320; 95%
CI, 1.557-11.984). However, in our study, being underweight was the only statistically significant factor for cancer-specific surviv- al, while being overweight or obese showed no statistical signif- icance. Although unclear, the difference might have resulted from limiting the cohort to low stage (pT1 and pT2) diseases in our study, while most of other studies included the whole patho-
logic T stages.
There are few studies of the association between smoking and RCC survival. At the Memorial Sloan-Kettering Cancer Center, investigators reviewed 25,436 tumor registry records and report- ed that smokers had an overall lower rate of survival than non- smokers, with a significant association in several solid cancers, but not in renal cancer (27). Parker et al. (15) did not find an as- sociation between smoking status and RCC survival despite ad- justment for age and tumor stage. Other studies showed that smokers had significantly lower overall survival rates compared to non-smokers in univariate analyses, but failed to identify an association between smoking status and survival in multivari-
Table 6. Univariate and multivariate analysis of variables influencing cancer-specific mortalityVariables Univariate Multivariate
HR (95% CI) P value HR (95% CI) P value
Age 1.060 (1.038-1.082) < 0.001 1.043 (1.018-1.070) 0.001
ASA class 1 2 3 4
1 2.073 (1.224-3.511) 3.155 (1.328-7.499) 0.000 (0.000-2.065)
0.019 - 0.007 0.009 0.971
1 1.223 (0.642-2.329) 1.329 (0.476-3.711) 0.001 (0.000-6.375)
0.926 - 0.540 0.587 0.982 Obesity grade
Normal Overweight Obese Underweight
1 0.731 (0.430-1.241) 0.745 (0.356-1.559) 3.496 (1.427-8.567)
0.005 - 0.246 0.435 0.006
1 1.017 (0.522-1.979) 1.279 (0.555-2.944) 4.320 (1.557-11.984)
0.033 - 0.961 0.563 0.005 Smoking
Never Former Current
1 1.003 (0.362-2.780) 0.628 (0.353-1.117)
0.280 - 0.996 0.113
1 0.375 (0.089-1.583) 0.928 (0.433-1.991)
0.410 - 0.182 0.848 Perioperative blood pressure
< 120/80 mmHg 120-139/80-89 mmHg 140-159/90-99 mmHg ≥ 160/100 mmHg
1 1.211 (0.633-2.314) 1.090 (0.524-2.269) 2.015 (0.916-4.431)
0.298 - 0.563 0.817 0.081
1 1.445 (0.708-2.949) 0.848 (0.368-1.955) 2.394 (0.977-5.863)
0.082 - 0.312 0.699 0.056 Alcohol intake
Never Former Current
1 1.048 (0.327-3.357) 0.461 (0.260-0.818)
0.028 - 0.938 0.008
1 1.733 (0.325-9.227) 0.682 (0.323-1.441)
0.434 - 0.520 0.315
History of diabetes mellitus 1.834 (1.037-3.242) 0.037 1.461 (0.666-3.208) 0.345
History of hypertension 1.298 (0.799-2.111) 0.292 0.856 (0.449-1.634) 0.638
Fasting blood glucose 1.005 (1.000-1.010) 0.055 1.001 (0.995-1.007) 0.763
Hemoglobin level 0.809 (0.724-0.905) < 0.001 0.947 (0.791-1.134) 0.557
Serum albumin 0.543 (0.373-0.791) 0.001 1.335 (0.788-2.261) 0.283
Serum ALP 1.013 (1.009-1.017) < 0.001 1.005 (0.997-1.012) 0.227
ESR 1.024 (1.017-1.030) < 0.001 1.011 (1.001-1.021) 0.037
Symptoms at presentation 2.534 (1.587-4.044) < 0.001 1.244 (0.710-2.179) 0.446
Type of surgery Radical nephrectomy Partial nephrectomy
1 0.343 (0.125-0.945)
0.038 - 0.038
1 0.798 (0.276-2.309)
0.677 - 0.677 Fuhrman grade
Low (G1 + G2) High (G3 + G4)
1 2.710 (1.672-4.390)
< 0.001 -
< 0.001
1 1.916 (1.082-3.394)
0.026 - 0.026 Pathologic T stage
T1
T2 1
3.320 (2.079-5.301)
< 0.001 -
< 0.001 1
1.473 (0.798-2.720)
0.216 - 0.216
Clinical LN positivity 2.443 (1.339-4.459) 0.004 1.247 (0.601-2.589) 0.553
Distant metastasis 18.761 (10.174-34.598) < 0.001 10.991 (5.257-22.980) < 0.001
HR, hazard ratio; CI, confidence interval; ASA, American Society of Anesthesiologists; ALP, alkaline phosphatase; ESR, erythrocyte segmentation rate; LN, lymph node.
ate analysis (13, 14). We were similarly unable to find an associ- ation between smoking status and overall and cancer-specific survivals.
Studies of an association with blood pressure are also scarce.
In a 1993 cohort study authors found increased mortality due to RCC among hypertensive patients (28). Two more recent studies have reported contradictory conclusions; Parker and authors (15) reported a positive association between hyperten- sion and RCC-specific survival, whereas Grossman et al. (16) showed a negative association. Grove and associates (29), in a 20-yr prospective study of a cohort of 8,006 patients, found no association between blood pressure and RCC death. In our study, the life table survival plot did not show a significant asso- ciation between perioperative blood pressure levels and overall or cancer-specific survival. However, the multivariate analysis revealed that the perioperative blood pressure was an indepen- dent predictor for overall mortality with adjusting the past his- tory of hypertension as a covariate. Specifically, the periopera- tive blood pressure of a stage 2 hypertension degree (≥ 160/100 mmHg) was found to be an independent predictor for overall mortality.
We admit that our study had several limitations which should be discussed. It had a retrospective design and was performed at a single institution. There is the possibility of selection bias associated with referral patterns to a tertiary medical center.
The significant differences in basic demographic data such as age, sex, and ASA class between groups classified by the obesity grade, smoking status, or perioperative blood pressure levels could be the weakest point of our study. Although these demo- graphic variables were adjusted for in the multivariate analysis, these differences may still have affected our findings.
In conclusion, overall and cancer-specific survivals significant- ly decrease with being underweight in patients with low stage RCC. Perioperative blood pressure ≥ 160/100 mmHg and be- ing underweight are unfavorable independent predictors of overall and cancer-specific survival, respectively, while smok- ing status does not influence overall or cancer-specific survival.
ACKNOWLEDGMENTS
The authors have no conflicts of interest to disclose.
REFERENCES
1. Chow WH, Gridley G, Fraumeni JF Jr, Järvholm B. Obesity, hypertension, and the risk of kidney cancer in men. N Engl J Med 2000; 343: 1305-11.
2. Flaherty KT, Fuchs CS, Colditz GA, Stampfer MJ, Speizer FE, Willett WC, Curhan GC. A prospective study of body mass index, hypertension, and smoking and the risk of renal cell carcinoma (United States). Cancer Causes Control 2005; 16: 1099-106.
3. Setiawan VW, Stram DO, Nomura AM, Kolonel LN, Henderson BE. Rick
factors for renal cell cancer: the multiethnic cohort. Am J Epidemiol 2007;
166: 932-40.
4. Kamat AM, Shock RP, Naya Y, Rosser CJ, Slaton JW, Pisters LL. Prognos- tic value of body mass index in patients undergoing nephrectomy for lo- calized renal tumors. Urology 2004; 63: 46-50.
5. Schips L, Lipsky K, Zigeuner R, Gidaro S, Salfellner M, Rehak P, Pum- mer K, Hubmer G. Does overweight impact on the prognosis of patients with renal cell carcinoma? a single center experience of 683 patients. J Surg Oncol 2004; 88: 57-61.
6. Parker AS, Lohse CM, Cheville JC, Thiel DD, Leibovich BC, Blute ML.
Greater body mass index is associated with better pathologic features and improved outcome among patients treated surgically for clear cell renal cell carcinoma. Urology 2006; 68: 741-6.
7. Awakura Y, Nakamura E, Ito N, Yamasaki T, Kamba T, Kamoto T, Ogawa O. Influence of body mass index on prognosis of Japanese patients with renal cell carcinoma. Urology 2007; 70: 50-4.
8. Schrader AJ, Rustemeier J, Rustemeier JC, Timmesfeld N, Varga Z, Hegele A, Olbert PJ, Hofmann R. Overweight is associated with improved can- cer-specific survival in patients with organ-confined renal cell carcino- ma. J Cancer Res Clin Oncol 2009; 135: 1693-9.
9. Jeon HG, Jeong IG, Lee JH, Lee CJ, Kwak C, Kim HH, Lee SE, Lee E.
Prognostic value of body mass index in Korean patients with renal cell carcinoma. J Urol 2010; 183: 448-54.
10. Waalkes S, Merseburger AS, Kramer MW, Herrmann TR, Wegener G, Rustemeier J, Hoffman R, Schrader M, Kuczyk MA, Schrader AJ. Obesity is associated with improved survival in patients with organ-confined clear cell kidney cancer. Cancer Causes Control 2010; 21: 1905-10.
11. Rogde AJ, Gudbrandsdottir G, Hjelle KM, Sand KE, Bostad L, Beisland C. Obesity is associated with an improved cancer-specific survival, but an increased rate of postoperative complications after surgery for renal cell carcinoma. Scand J Urol Nephrol 2012; 46: 348-57.
12. Sweeney C, Farrow DC. Differential survival related to smoking among patients with renal cell carcinoma. Epidemiology 2000; 11: 344-6.
13. Oh WK, Manola J, Renshaw AA, Brodkin D, Loughlin KR, Richie JP, Shapiro CL, Kantoff PW. Smoking and alcohol use may be risk factors for poorer outcome in patients with clear cell renal carcinoma. Urology 2000; 55: 31-5.
14. Parker A, Lohse C, Cheville J, Leibovich B, Igel T, Blute M. Evaluation of the association of current cigarette smoking and outcome for patients with clear cell renal cell carcinoma. Int J Urol 2008; 15: 304-8.
15. Parker A, Freeman LB, Cantor K, Lynch C. Self-report of smoking, obesi- ty and hypertension history and survival among a cohort of Iowa renal cell carcinoma cases. Ann Epidemiol 2000; 10: 467-8.
16. Grossman E, Messerli FH, Boyko V, Goldbourt U. Is there an association between hypertension and cancer mortality? Am J Med 2002; 112: 479-86.
17. WHO Expert Consultation. Appropriate body-mass index for Asian pop- ulations and its implications for policy and intervention strategies. Lan- cet 2004; 363: 157-63.
18. Chobanian AV, Bakris GL, Black HR, Cushman WC, Green LA, Izzo JL Jr, Jones DW, Materson BJ, Oparil S, Wright JT Jr, et al. The seventh re- port of the Joint National Committee on prevention, detection, evalua- tion, and treatment of high blood pressure: the JNC 7 report. JAMA 2003;
289: 2560-72.
19. Haferkamp A, Pritsch M, Bedke J, Wagener N, Pfitzenmaier J, Buse S, Hohenfellner M. The influence of body mass index on the long-term sur-
vival of patients with renal cell carcinoma after tumour nephrectomy.
BJU Int 2008; 101: 1243-6.
20. Morgan TM, Tang D, Stratton KL, Barocas DA, Anderson CB, Gregg JR, Chang SS, Cookson MS, Herrell SD, Smith JA Jr, et al. Preoperative nu- tritional status is an important predictor of survival in patients undergo- ing surgery for renal cell carcinoma. Eur Urol 2011; 59: 923-8.
21. Chang JS, Park YH, Ku JH, Kwak C, Kim HH. Predicting factors for death from other causes in patients with localized renal cell carcinoma. Kore- an J Urol 2012; 53: 18-22.
22. Yu ML, Asal NR, Geyer JR. Later recurrence and longer survival among obese patients with renal cell carcinoma. Cancer 1991; 68: 1648-55.
23. Kim HL, Han KR, Zisman A, Figlin RA, Belldegrun AS. Cachexia-like symptoms predict a worse prognosis in localized t1 renal cell carcinoma.
J Urol 2004; 171: 1810-3.
24. Rasmuson T, Grankvist K, Jacobsen J, Olsson T, Ljungberg B. Serum in- sulin-like growth factor-1 is an independent predictor of prognosis in patients with renal cell carcinoma. Acta Oncol 2004; 43: 744-8.
25. Naya Y, Zenbutsu S, Araki K, Nakamura K, Kobayashi M, Kamijima S, Imamoto T, Nihei N, Suzuki H, Ichikawa T, et al. Influence of visceral obesity on oncologic outcome in patients with renal cell carcinoma. Urol Int 2010; 85: 30-6.
26. Schips L, Zigeuner R, Lipsky K, Quehenberger F, Salfellner M, Winkler S, Pummer K, Hubmer G. Do patients with a higher body mass index have a greater risk of advanced-stage renal cell carcinoma? Urology 2003; 62:
437-41.
27. Yu GP, Ostroff JS, Zhang ZF, Tang J, Schantz SP. Smoking history and cancer patient survival: a hospital cancer registry study. Cancer Detect Prev 1997; 21: 497-509.
28. Fletcher AE, Beevers DG, Bulpitt CJ, Coles EC, Dollery CT, Ledingham JG, Palmer AJ, Petrie JC, Webster J. Cancer mortality and atenolol treat- ment. BMJ 1993; 306: 622-3.
29. Grove JS, Nomura A, Severson RK, Stemmermann GN. The association of blood pressure with cancer incidence in a prospective study. Am J Epi- demiol 1991; 134: 942-7.