Introduction
Generally, many orchard fields are located in shallow soils on sloping hill in Korea. The management of the orchard soil cover is vital to the over-all orchard health and productivity. The area under the tree row can not be properly mowed, and would become a thick tangle of annual and perennial weeds if left to grow. The preferred orchard floor management system uses herbicides to maintain a wide vegetation-free strip in the tree row with a ground cover between tree rows (Huang, 1998, 2002;
Mitchem, 2009). However, the removal of weed by herbicide may accelerate the soil erosion in the orchard area while the mowed grass cover provide a permanent soil cover to prevent soil erosion, and provide a firmer
surface for farm machinery.
Soil erosion by water occurs when bare-sloped soil surface is exposed to rainfall, and the rainfall intensity exceeds the rate of soil intake, or infiltration rate. Soil erosion, a physical process requiring energy, can generally occur in two stages: 1) detachment of soil particles by raindrop impact, splash, or flowing water; and 2) transport of detached particles by splash or flowing water (Kim et al., 2003). Erosion is influenced from a variety of factors such as rainfall distribution, soil type, land use, and so forth. (Kim et al., 2004). These factors are presented in various types by time and space (Fu et al., 2000).
Runoff-prone soils, such as those in the region of orchard, have been shown to be vulnerable to soil erosion by surface runoff during the summer time (Poesen and Lavee, 1994; Shui et al., 1989, 2004). Soils that have reduced infiltration can become saturated at the surface during rainfall. Saturation decreases soil strength,
Effects of Rainfall Events on Soil in Orchard Field under Herbicide Treatment.
2. Characteristics of Runoff and Soil Erosion
Doug-Young Chung
1, Mi-Suk Park, Kyu-Seung Lee, and Jin-Ho Lee
21
Department of Bioenvironmental Chemistry College of Agriculture and Life Science Chungnam National Univ. Daejeon Korea
2
Department of Bioenvironmental Chemistry, College of Agricultural and Life Sciences, Chonbuk National University, Jeonju 561-756, Korea
Changes in runoff and soil erosion at slightly hilly erosive plots with pear trees over a three-year period were monitored under two distinct types of weed treatment by herbides : (1) pre-emergence herbicide with glyphosate; (2) post-emergence herbicide with paraquat. The numbers of rainfall events from June to Nov for three years of experimental periods were approximately 50 times in the plots having 5.5%to 10.2%slope at an altitude of 125 m. The steady-state infiltration rate was generally increased in the bare plot from which all weeds were removed while it was decreased in the herbicide treated plots and control. The runoffs from the control plot during the experimental periods were always less than those from plots of the herbicide-treated and the bare. The runoff under the same rainfall intensity was decreased in the order of bare, glyphosate, paraquat, and control. This results indicated that the removal time of weed by the different types of herbicides might influenced the runoff rate. For the first two years of the experimental periods, loss of fine fraction was much greater than that of coarse fraction while soil loss was correlated neither with total rainfall nor amount of runoff. The soil erosion rate under the same rainfall intensity was increased in the order of control, glyphosate, paraquat, and bare plot. However, there were not much differences in the soil loss for all plots under a relatively lower rainfall intensity less than 30 mm day
-1, resulting in rainfall intensity was important factor on soil erosion.
Key words: Infiltration, Runoff, Soil erosion, Orchard, Herbicide
Received : January 5. 2010 Accepted : February 11. 2010
*Corresponding author : Phone: +82428216739
E-mail: [email protected]
increases detachment of particles, and enhances the erosion potential. Soils that have reduced infiltration result in accelerated soil erosion from fields. Cover crops may increase infiltration by eliminating surface crust due to raindrop impact on the soil, by increasing macro- porosity through root channeling, and by enhancing biological activity (Gomez, et al., 2001)
Seasonal losses of soil in the orchard area as impacted by rainfall event along with weed management practices are not well quantified. Therefore, it need to provide an understanding of the process and pathways for soil losses from the orchard areas throughout field studies at a range of seasonal rainfall scales. Also simulation models can extend observed data to provide the potential soil loss for off site losses over a broad range of scenarios. The main objectives of this investigation were to assess and to link soil losses at the orchard field under sporadic and periodic runoff during the rainy season, typically of the orchard field soils under different vegetation conditions by herbicide treatments. From this investigation, we expect to determine which processes are involved in soil loss by runoff and to quantify influence of these processes for the different surface coverage and practices on total loads.
Material and methods
The investigation site was established on orchard field located in runoff-prone soils as shown in Chung (2010).
To measure the daily precipitation during a rainy day we installed four digital rainfall gauges attached to weather station (Rainwise Weather Stations PORTLOG USA) at each treatment plot. The experimental plots were as shown in Table 1.
Measurements of infiltration We measured the steady-state infiltration rate using a double ring infiltrometer for the plots at the investigation sites of pear orchard area over the periods from June, 2006 to May, 2008. Based on the ASTM D3385-94, the infiltration as the amount of water penetrated the soil surface per unit time was determinated by double-ring infiltrometer until the infiltration was stabilized.
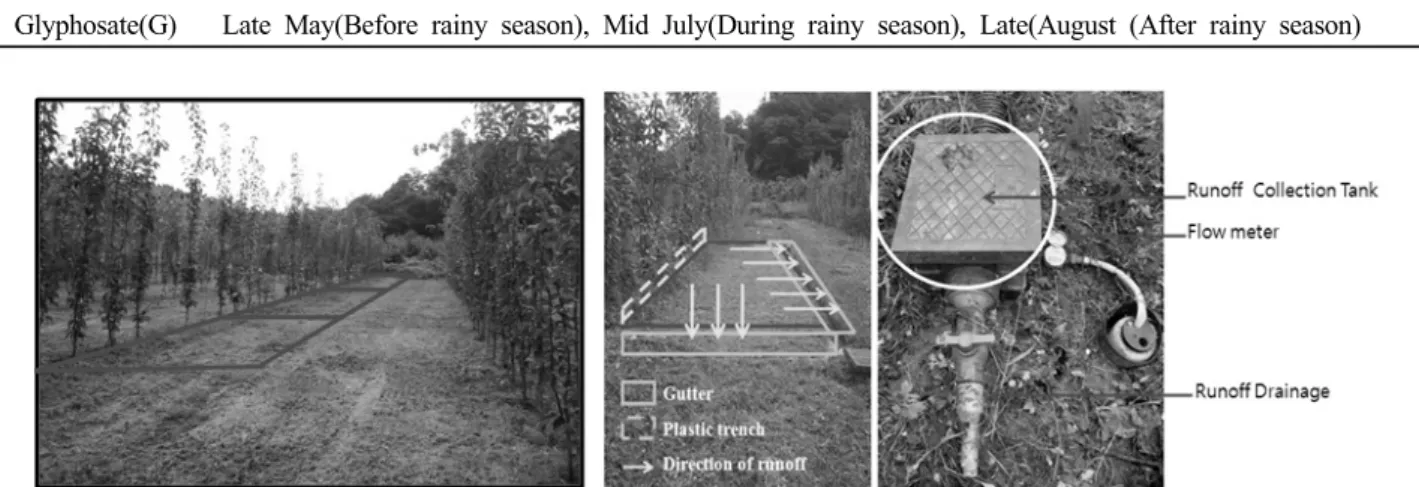
Measurements of Runoff and Erosion For a 10-m downslope with about 5% slope and 2.5-m-wide plot, the pear trees in its left side were aligned in the slope direction. We established runoff trench system to investigate the runoff. Runoff discharge flown into the collection system through trough at the bottom corner of each trench for each plot was continuously measured by means of ventri-flow meter which was installed at the end of the trench for every rainfall event from middle of May to end of October for three years (Fig. 1).
Runoff collected by the collection system was throughly mixed and sampled to measure the concentration of sediment in the runoff for each rainfall
Table 1. Types of herbicide and their treatment methods and periods for the experimental plots.
Treatment Treatment Method and remarks
Control(C) Natural vegetation with no herbicide throughout experimental period
Bare(B) Glyphosate and Selective herbicides were applied to removal all weeds before the rainy season.
Paraquat(P) Three applications when weeds grew to 30 cm tall on following three tems;.
Glyphosate(G) Late May(Before rainy season), Mid July(During rainy season), Late(August (After rainy season)
Fig. 1. Pictures of runfoff collection system established at the orchard area located on Banghungro Gongjoo.
event. And the collected runoff was completely removed after collection of runoff sample every time. To measure the amount of soil erosion 50 ml of runoff in 100 ml glass beaker was dried for at least 72 hours until there was no water remained and each measurement was replicated three times. Soil loss associated with each sampling period was calculated as:
Soil loss = Sediment concentration x Runoff volume
Results and discussion
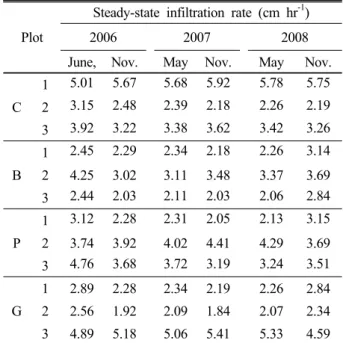
The time taken to attain steady-state infiltration rate varied from 35 min to 1 hour 40 min depending on the plots which had different bulk densities and stone contents. The first measured steady-state infiltration rate in May of 2006 before the establishment of plot varied from approximately 2.5 cm hr
-1to 5 cm hr
-1.
The daily rainfall intensity greater than the infiltration rate in a given condition can causes runoff and erosion. As shown in Table 1, we found that the steady state infiltration rate ranged from 2.44 cm hr
-1to 5.01 cm hr
-1for the first measurement before treatment in May of 2006 and from 2.06 cm hr
-1to 5.78 cm hr
-1after two years from the treatment in may of 2008. Therefore, the daily rainfall intensity that caused any runoff or erosion could be dependent on the steady state infiltration rate in a given plot. The steady-state infiltration rate was generally increased in the bare plot from which all weeds were removed but it was decreased in the herbicide treated plots and control where all weeds were controlled by herbicide or grew throughout investigation period. The biomass returned to the each plot as organic matter was greater in the control plot than those of plots treated with glyphosate or paraquat because the weeds in the herbicide treated plot were controlled twice during the growing period. Also the changes in infiltration rate between May and November for each year was much greater than that between November and May of next year. From these results, it was assumed that the infiltration rate was influenced by addition of organic matter and the amount of soil loss depending the vegetation cover for each plot.
On the other hand, for six investigations the overall changes in infiltration rate times during two and half years showed that there was increase in infiltration rate for the bare plot (B-1, 2, 3) but there were broadly decreases in infiltration rate for the control (C-1, 2, 3) and the herbicide
treated plots (G-1, 2, 3; P-1, 2, 3).
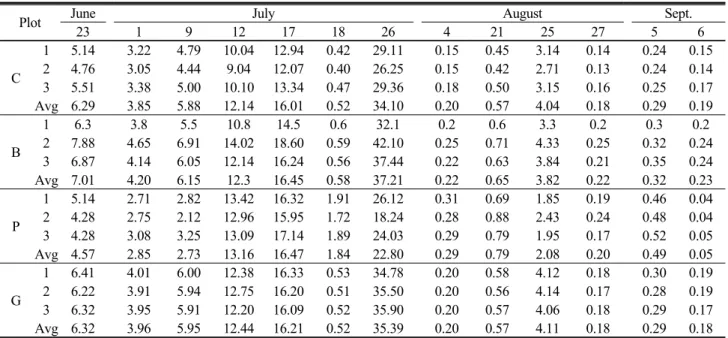
The results of surface runoff from the experimental plots showed that the runoff patterns were influenced by the different seasonal rainfall distributions and intensity classes between 2006 and 2008 (Table 2, 3, 4). The runoff from plots generally occurred when the rainfall intensity was greater than the steady-state rainfall rate resulting in a temporally high rainfall intensity such as storm and it was much greater than the steady-state infiltration rate (Fig. 2).
Table 2. Changes of steady-state infiltration rate measur- ed with a double ring infiltrometer for the plots with different weed treatments at the pear orchard area from 2006 to 2008.
Plot
Steady-state infiltration rate (cm hr
-1)
2006 2007 2008
June, Nov. May Nov. May Nov.
C
1 5.01 5.67 5.68 5.92 5.78 5.75 2 3.15 2.48 2.39 2.18 2.26 2.19 3 3.92 3.22 3.38 3.62 3.42 3.26 B
1 2.45 2.29 2.34 2.18 2.26 3.14 2 4.25 3.02 3.11 3.48 3.37 3.69 3 2.44 2.03 2.11 2.03 2.06 2.84 P
1 3.12 2.28 2.31 2.05 2.13 3.15 2 3.74 3.92 4.02 4.41 4.29 3.69 3 4.76 3.68 3.72 3.19 3.24 3.51 G
1 2.89 2.28 2.34 2.19 2.26 2.84 2 2.56 1.92 2.09 1.84 2.07 2.34 3 4.89 5.18 5.06 5.41 5.33 4.59
Surface runoff from the experimental plots generally
decreased in all rainfall intensity classes when the rainfall
intensity was greater than that of the steady-state rainfall
rate of the plot itself for three years while there were little
runoff for the daily rainfall intensity less than infiltration
rate in a given plot. For the control plot, the runoff was
always less than for the herbicide-treated plots and the
bare plot. The amount of runoff for the same daily rainfall
intensity was increased in the order of control, glyphosate,
paraquat, and bare. And the decrease in the amount of
runoff for the control plot as the investigation period
increased might be influenced by gradual stabilization of
the soil structure due to addition of organic matter returned
as residue with the growth of weed which was not
removed from the field. Compared with the runoff of the
bare plot, the lower runoff from the control and
herbicide-treated plots was due to restricting surface
disturbances by the addition of organic matter from weed residue. Compared the runoff in the control with those in herbicide-treated plots, the amount of weed grown and returned to the soil as organic matter was greater in the control plot, resulting in higher water holding capacity and less surface disturbances in soils.
On the other hand, it was not easy to compare characteristics of runoffs among the treatments in 2006 with those of 2007 and 2008 due to time of rainfall event depending on the different weed canopy in a given plot although the rainfall intensity patterns were similar to
those of the first year. However, we found that runoffs in the bare plot for the second and third year were slightly greater than that of the first year while there were slight decrease in runoff for the control and herbicide-treated plots. From these results, we could assume that the weeds grown or controlled in the plot caused reduction of runoff.
Soil loss Soil erosion associated with the soil itself, the topography, the vegetative cover and the climate, is often considered to be affected by the shear strength of surface soil, as well as by the impact of raindrops and Table 3. Amount of runoff corresponding to the daily precipitation on the plots with different weed treatments at the
pear orchard area in 2006. (Unit : m
310a
-1)
Plot June July August Sept.
23 1 9 12 17 18 26 4 21 25 27 5 6
C
1 5.14 3.22 4.79 10.04 12.94 0.42 29.11 0.15 0.45 3.14 0.14 0.24 0.15 2 4.76 3.05 4.44 9.04 12.07 0.40 26.25 0.15 0.42 2.71 0.13 0.24 0.14 3 5.51 3.38 5.00 10.10 13.34 0.47 29.36 0.18 0.50 3.15 0.16 0.25 0.17 Avg 6.29 3.85 5.88 12.14 16.01 0.52 34.10 0.20 0.57 4.04 0.18 0.29 0.19 B
1 6.3 3.8 5.5 10.8 14.5 0.6 32.1 0.2 0.6 3.3 0.2 0.3 0.2
2 7.88 4.65 6.91 14.02 18.60 0.59 42.10 0.25 0.71 4.33 0.25 0.32 0.24 3 6.87 4.14 6.05 12.14 16.24 0.56 37.44 0.22 0.63 3.84 0.21 0.35 0.24 Avg 7.01 4.20 6.15 12.3 16.45 0.58 37.21 0.22 0.65 3.82 0.22 0.32 0.23 P
1 5.14 2.71 2.82 13.42 16.32 1.91 26.12 0.31 0.69 1.85 0.19 0.46 0.04 2 4.28 2.75 2.12 12.96 15.95 1.72 18.24 0.28 0.88 2.43 0.24 0.48 0.04 3 4.28 3.08 3.25 13.09 17.14 1.89 24.03 0.29 0.79 1.95 0.17 0.52 0.05 Avg 4.57 2.85 2.73 13.16 16.47 1.84 22.80 0.29 0.79 2.08 0.20 0.49 0.05 G
1 6.41 4.01 6.00 12.38 16.33 0.53 34.78 0.20 0.58 4.12 0.18 0.30 0.19 2 6.22 3.91 5.94 12.75 16.20 0.51 35.50 0.20 0.56 4.14 0.17 0.28 0.19 3 6.32 3.95 5.91 12.20 16.09 0.52 35.90 0.20 0.57 4.06 0.18 0.29 0.17 Avg 6.32 3.96 5.95 12.44 16.21 0.52 35.39 0.20 0.57 4.11 0.18 0.29 0.18
Table 4. Amount of runoff corresponding to the daily precipitation on the plots with different weed treatments at the
pear orchard area in 2007. (Unit : m
310a
-1)
Plot June July August Sept.
21 1 9 10 19 24 5 7 8 10 14 28 29 5 6
C
1 3.16 27.10 8.41 5.13 47.97 5.94 55.35 1.24 7.95 0.99 2.89 0.54 2.86 32.40 30.50 2 2.59 22.60 6.90 4.21 40.20 4.87 47.60 1.02 6.52 0.81 2.11 0.44 2.35 26.50 26.40 3 3.41 30.40 9.25 5.54 52.60 6.41 59.78 1.34 8.95 1.07 3.12 0.58 3.09 37.10 33.60 Avg 3.05 26.70 8.19 4.96 46.92 5.74 54.24 1.20 7.80 0.96 2.70 0.52 2.77 32.00 30.17 B
1 3.85 32.40 10.89 6.26 58.5 7.24 67.5 1.51 9.69 1.21 3.52 0.66 3.49 36.70 35.80 2 4.81 41.10 13.61 7.83 74.10 9.05 82.30 1.89 12.60 1.51 4.40 0.83 4.36 46.10 45.40 3 4.20 35.32 12.01 6.96 64.20 7.69 74.50 1.65 10.56 1.32 3.84 0.72 3.80 40.50 36.50 Avg 4.29 36.27 12.17 7.0 65.60 7.99 74.77 1.68 10.95 1.35 3.92 0.73 3.89 41.10 39.23 P
1 4.42 39.40 12.83 7.19 68.40 8.32 79.61 1.74 11.14 1.39 4.05 0.76 4.01 48.40 43.57 2 4.38 40.10 12.70 7.12 67.72 8.24 80.40 1.72 12.40 1.38 4.00 0.75 3.97 47.92 44.60 3 4.56 42.50 14.10 7.41 71.40 8.57 84.80 1.79 11.90 1.43 4.17 0.78 4.13 52.10 48.70 Avg 4.45 40.67 13.21 7.24 69.17 8.38 81.60 1.75 11.81 1.40 4.07 0.76 4.04 49.47 45.62 G
1 3.57 32.10 9.50 5.80 54.21 6.71 62.55 1.40 8.98 1.12 3.26 0.61 3.23 38.40 34.47
2 4.17 36.50 12.10 6.79 62.50 7.85 75.10 1.64 10.51 1.31 3.82 0.72 3.78 43.60 41.10
3 4.63 39.60 13.43 7.53 70.60 8.71 84.10 1.82 12.40 1.46 4.24 0.79 4.20 49.10 48.40
Avg 4.12 36.07 11.68 6.71 62.44 7.76 73.92 1.62 10.63 1.30 3.77 0.71 3.74 43.70 41.32
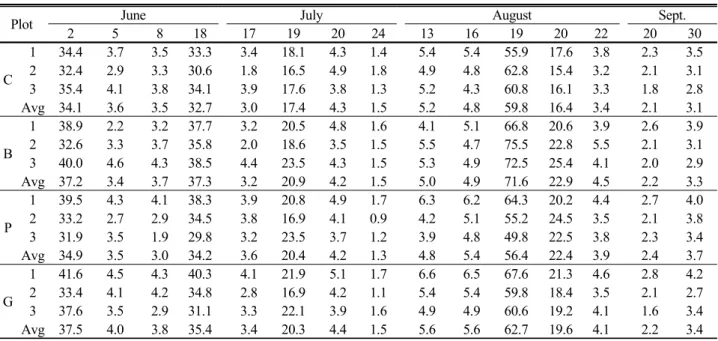
overland flow of water. For three years of experiment, a loss of fine fraction was much greater than a loss of coarse fraction while soil loss was not closely correlated either with total rainfall or with runoff. The soil erosion rate under the same rainfall intensity was increased in the order of control, glyphosate, paraquat, and bare plot. On July 19 and August 5 of 2007 when the erosion was the highest, soil loss were directly related to the rainfall intensity and weed control method performed on the plots (Table 5, 6, 7). The bare plot, with unprotected soil surface due to the removal of weeds well before the onset of rainy season, resulted in severe soil erosion. For low rainfall intensity less than 30 mm day
-1, there were no much differences in
the soil loss for the plots regardless of weed treatment methods, establishing the rainfall intensity as an important factor on soil erosion. However, the soil erosion was generally increased with increasing runoff, indicating that rainfall intensity and runoff were possibly responsible for the high soil erosion from all plots during the periods fo investigation.
Summary The steady-state infiltration rate measured on the plots was generally increased in the bare plot where all weeds were removed however it was decreased in the herbicide treated plots and control where all weeds were controlled by herbicide as the investigation period increased. From these results, we assumed that the infiltration rate was influenced by addition of organic matter and the amount of soil loss for each plot. The results of runoff from the experimental plots showed that the runoff patterns were influenced by the different seasonal rainfall distributions and intensity classes. For the control plot with a vegetation cover during a rainy period, the runoff was always less than for the herbicide-treated plot and bare plot from where the weeds were removed partially or completely. The runoff under the same daily rainfall intensity was increased in the order of control, glyphosate, paraquat, and bare. The runoff occurred when rainfall intensity was less than the steady-state infiltration rate, caused by the temporally high rainfall intensity in a short time such as storm which was much greater than the steady-state rainfall rate. During the first two years after
P lot
B : Bare Soil, C:Control, G :G lyphosate, P:Paraquat B-1 B-2 B-3 C-1 C-2 C-3 G-1 G-2 G -3 P-1 P-2 P-3
Infiltration rate (cmhr)
-2 -1 0 1
June 2006 - Nov. 2006 Nov. 2006 - M ay 2007
M ay 2007 - Nov. 2007 Nov. 2007 - M ay 2008
Net change bwt June 2006 - M ay 2008
Fig. 2. Net changes of infiltration rate measured before and after the rainy season at the investigation plots from June of 2006 to May of 2008. Above zero means increase in infiltration rate.
Table 5. Amount of runoff corresponding to the daily precipitation on the plots with different weed treatments at the
pear orchard area in 2007. (Unit : m
310a
-1)
Plot June July August Sept.
2 5 8 18 17 19 20 24 13 16 19 20 22 20 30
C
1 34.4 3.7 3.5 33.3 3.4 18.1 4.3 1.4 5.4 5.4 55.9 17.6 3.8 2.3 3.5
2 32.4 2.9 3.3 30.6 1.8 16.5 4.9 1.8 4.9 4.8 62.8 15.4 3.2 2.1 3.1
3 35.4 4.1 3.8 34.1 3.9 17.6 3.8 1.3 5.2 4.3 60.8 16.1 3.3 1.8 2.8
Avg 34.1 3.6 3.5 32.7 3.0 17.4 4.3 1.5 5.2 4.8 59.8 16.4 3.4 2.1 3.1
B
1 38.9 2.2 3.2 37.7 3.2 20.5 4.8 1.6 4.1 5.1 66.8 20.6 3.9 2.6 3.9
2 32.6 3.3 3.7 35.8 2.0 18.6 3.5 1.5 5.5 4.7 75.5 22.8 5.5 2.1 3.1
3 40.0 4.6 4.3 38.5 4.4 23.5 4.3 1.5 5.3 4.9 72.5 25.4 4.1 2.0 2.9
Avg 37.2 3.4 3.7 37.3 3.2 20.9 4.2 1.5 5.0 4.9 71.6 22.9 4.5 2.2 3.3
P
1 39.5 4.3 4.1 38.3 3.9 20.8 4.9 1.7 6.3 6.2 64.3 20.2 4.4 2.7 4.0
2 33.2 2.7 2.9 34.5 3.8 16.9 4.1 0.9 4.2 5.1 55.2 24.5 3.5 2.1 3.8
3 31.9 3.5 1.9 29.8 3.2 23.5 3.7 1.2 3.9 4.8 49.8 22.5 3.8 2.3 3.4
Avg 34.9 3.5 3.0 34.2 3.6 20.4 4.2 1.3 4.8 5.4 56.4 22.4 3.9 2.4 3.7
G
1 41.6 4.5 4.3 40.3 4.1 21.9 5.1 1.7 6.6 6.5 67.6 21.3 4.6 2.8 4.2
2 33.4 4.1 4.2 34.8 2.8 16.9 4.2 1.1 5.4 5.4 59.8 18.4 3.5 2.1 2.7
3 37.6 3.5 2.9 31.1 3.3 22.1 3.9 1.6 4.9 4.9 60.6 19.2 4.1 1.6 3.4
Avg 37.5 4.0 3.8 35.4 3.4 20.3 4.4 1.5 5.6 5.6 62.7 19.6 4.1 2.2 3.4
treatments, fine fraction loss was much greater than coarse fraction loss while soil loss was not closely correlated either with total rainfall or with runoff. The soil erosion rate under the same rainfall intensity was increased in the order of control, glyphosate, paraquat, and bare plot. For relatively low rainfall intensity less than 30 mm day
-1, there were not much differences in the soil loss for the plots whether treated or untreated, resulting in rainfall intensity was important factor on soil
erosion. Thus, we could concluded that the herbicide treatment to control the weeds in the field was effective in controlling soil erosion due to surface protection from rainfall by addition of organic matter whether it was alive or decayed.
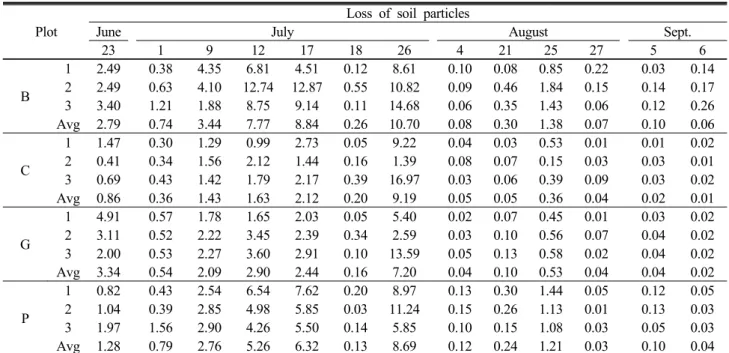
Table 6. Amount of soil loss corresponding to the daily precipitation on the plots with different weed treatments at the
pear orchard area in 2006. (Unit : kg 10a
-1)
Plot
Loss of soil particles
June July August Sept.
23 1 9 12 17 18 26 4 21 25 27 5 6
B
1 2.49 0.38 4.35 6.81 4.51 0.12 8.61 0.10 0.08 0.85 0.22 0.03 0.14 2 2.49 0.63 4.10 12.74 12.87 0.55 10.82 0.09 0.46 1.84 0.15 0.14 0.17 3 3.40 1.21 1.88 8.75 9.14 0.11 14.68 0.06 0.35 1.43 0.06 0.12 0.26 Avg 2.79 0.74 3.44 7.77 8.84 0.26 10.70 0.08 0.30 1.38 0.07 0.10 0.06 C
1 1.47 0.30 1.29 0.99 2.73 0.05 9.22 0.04 0.03 0.53 0.01 0.01 0.02 2 0.41 0.34 1.56 2.12 1.44 0.16 1.39 0.08 0.07 0.15 0.03 0.03 0.01 3 0.69 0.43 1.42 1.79 2.17 0.39 16.97 0.03 0.06 0.39 0.09 0.03 0.02 Avg 0.86 0.36 1.43 1.63 2.12 0.20 9.19 0.05 0.05 0.36 0.04 0.02 0.01 G
1 4.91 0.57 1.78 1.65 2.03 0.05 5.40 0.02 0.07 0.45 0.01 0.03 0.02 2 3.11 0.52 2.22 3.45 2.39 0.34 2.59 0.03 0.10 0.56 0.07 0.04 0.02 3 2.00 0.53 2.27 3.60 2.91 0.10 13.59 0.05 0.13 0.58 0.02 0.04 0.02 Avg 3.34 0.54 2.09 2.90 2.44 0.16 7.20 0.04 0.10 0.53 0.04 0.04 0.02 P
1 0.82 0.43 2.54 6.54 7.62 0.20 8.97 0.13 0.30 1.44 0.05 0.12 0.05 2 1.04 0.39 2.85 4.98 5.85 0.03 11.24 0.15 0.26 1.13 0.01 0.13 0.03 3 1.97 1.56 2.90 4.26 5.50 0.14 5.85 0.10 0.15 1.08 0.03 0.05 0.03 Avg 1.28 0.79 2.76 5.26 6.32 0.13 8.69 0.12 0.24 1.21 0.03 0.10 0.04 Table 7. Amount of soil loss corresponding to the daily precipitation on the plots with different weed treatments at the
pear orchard area in 2007. (Unit : kg 10a
-1)
Plot
Loss of soil particles
June July August Sept.
21 1 9 10 19 24 5 7 8 10 14 28 29 5 6
B
1 0.45 29.06 5.49 1.23 47.03 1.83 48.20 0.19 2.28 0.49 0.51 0.09 0.36 15.56 11.67 2 1.17 31.03 6.34 2.97 65.28 2.15 55.80 0.14 3.52 0.54 0.99 0.08 0.50 18.26 18.98 3 1.59 17.80 7.57 2.60 48.47 1.86 45.00 0.15 3.18 0.37 0.58 0.07 0.52 19.52 13.29 Avg 1.05 26.08 6.49 2.22 53.33 1.95 49.72 0.12 2.98 0.22 0.68 0.02 0.53 17.84 14.48 C
1 0.34 6.83 5.20 0.50 15.73 1.15 22.91 0.03 1.29 0.04 0.21 0.01 0.19 6.97 5.55 2 0.59 5.70 0.74 0.82 15.12 0.82 22.94 0.06 0.83 0.04 0.13 0.01 0.11 5.01 5.99 3 0.71 15.32 1.17 1.09 18.52 0.88 27.20 0.06 1.04 0.07 0.23 0.01 0.18 7.64 5.21 Avg 0.55 8.97 2.32 0.81 16.52 0.96 24.41 0.05 1.05 0.05 0.19 0.00 0.16 6.50 5.67 G
1 0.41 16.18 8.87 1.17 24.50 1.46 30.83 0.08 1.48 0.11 0.29 0.01 0.26 8.49 7.17 2 1.01 32.30 7.28 1.86 25.56 1.70 32.07 0.13 1.82 0.15 0.37 0.01 0.26 10.51 8.92 3 1.22 14.97 3.38 2.17 35.51 1.64 34.99 0.15 2.33 0.16 0.36 0.01 0.38 10.75 10.45 Avg 0.86 21.24 6.96 1.71 28.39 1.61 32.89 0.12 1.86 0.14 0.34 0.01 0.30 9.92 8.84 P
1 1.11 40.86 3.23 2.03 31.12 1.46 30.09 0.43 1.82 0.13 0.36 0.02 0.31 10.07 11.50
2 0.52 23.74 3.15 1.74 27.63 1.87 50.65 0.47 2.79 0.18 0.32 0.01 0.39 11.45 9.37
3 1.00 41.95 8.35 1.86 27.56 2.05 21.37 0.20 2.39 0.18 0.28 0.01 0.25 11.41 9.64
Avg 0.87 35.46 4.53 1.88 28.78 1.79 34.27 0.37 2.32 0.17 0.32 0.01 0.32 10.98 10.22
References
Chung, D.Y., P.J. Kim, and M.S. Park. 2010. Effects of Rainfall Events on Soil in Orchard Field under Herbicide Treatment.
1. Changes in soil physical and chemical properties.
Submitted to KSSSF in 2010.
Fu, B. L. Chen, K. Ma, H. Zhou, and J. Wang. 2000. References and further reading may be available for this article. To view references and further reading you must purchase this article.
CATENA Volume 39.1. Pages 69-78.
Gomez, J. A., J. V. Giraldez, and E. Fereres. 2001. Analysis of Infiltration and Runoff in an Olive Orchard under No-Till.
Soil Sci. Soc. Am. J. 65:291 -299. –
Huang, Q. 1998. Study on the erosion of different ecological types of red soil in hilly land. Acta Agriculturae Jiangxi.
10(3):7-12.
Huang, Q. T. Peng. and K. Wang 2002. Study on resources protection of water and soil and development technology in harmony in the hillside field. Chinese Journal of Eco- agriculture,10(3):98-101.
Kim, J. H., K. T. Kim, and G. B. Yeon. 2003. Analysis of Soil Erosion Hazard zone using GIS. Journal of Korea Association of Geographic Information Studies. Vol. 6.2. pp.22-32.
Kim, K. T., J. H. Kim, J. S. Park, and Y. S. Choi. 2004. Analysis of soil erosion hazard zone in Farmland.
http://proceedings.esri.com/library/userconf/proc05/papers/pa p1834.pdf.
Mitchem, W. E. 2009. Weed management consideration for peach orchards http://www.ent.uga.edu/peach/peachhbk/pdf/
weedmanagement.pdf.
Poesen, J., and H. Lavee. 1994. Rock fragments in topsoils:
significance and processes. CATENA 23, 1-28. doi:
10.1016/0341-8162(94)90050-7.
Sauer, T. J., and S. D. Logsdon. 2002. Hydraulic and physical properties of stony soils in a small watershed. Soil Science Society of America Journal 66, 1947-1956.
Shui, J. G, B. Liao, and Au C Jeff. 1989. Effects of different uses of red soil slopes on soil and water loss. Journal of Soil and Water Conservation 3(1):84-90.
Shui, J. G. B. Liao, A C. Jeff, Q. C. Zhou, and Jean L. Allard.
2004. Effects of different native vegetation management measures on red soil erosion in hilly orchards. ISCO 2004-13th International Soil Conservation Organisation Conference, Brisbane, July 2004.
Table 8. Amount of soil loss corresponding to the daily precipitation on the plots with different weed treatments at the
pear orchard area in 2008. (Unit : kg 10a
-1)
Plot
Loss of soil particles
June July August Sept.
2 5 8 18 17 19 20 24 13 16 19 20 22 20 30
C
1 0.36 0.44 4.74 1.98 16.56 0.16 66.25 0.11 0.01 0.48 0.05 0.01 0.01 0.01 0.01 2 0.31 0.64 3.32 3.13 63.28 0.09 45.94 0.09 0.04 1.01 0.07 0.05 0.01 0.05 0.04 3 0.59 0.76 2.39 2.5 39.17 0.08 85.45 0.01 0.03 1.01 0.00 0.04 0.01 0.04 0.03 Avg 0.42 0.61 3.48 2.54 39.67 0.11 65.88 0.07 0.03 0.83 0.04 0.03 0.01 0.03 0.03 B
1 0.23 0.63 2.14 0.52 15.94 0.10 72.5 0.03 0.00 0.33 0.03 0.01 0.00 0.01 0.00 2 0.15 0.46 3.21 0.8 14.04 0.15 23.13 0.05 0.01 0.13 0.05 0.01 0.00 0.01 0.01 3 0.13 0.37 2.09 0.54 7.73 0.11 105.9 0.12 0.01 0.29 0.00 0.01 0.00 0.01 0.01 Avg 0.17 0.49 2.48 0.62 12.57 0.12 67.18 0.07 0.01 0.25 0.03 0.01 0.00 0.01 0.01 P
1 0.66 0.35 1.18 0.56 11.20 0.14 33.78 0.10 0.01 0.13 0.11 0.01 0.00 0.01 0.01 2 0.39 0.71 1.57 1.15 10.33 0.23 17.12 0.08 0.02 0.26 0.13 0.03 0.00 0.03 0.02 3 0.29 0.45 3.33 1.83 17.04 0.15 65.17 0.08 0.03 0.23 0.00 0.03 0.00 0.03 0.03 Avg 0.45 0.50 2.03 1.18 12.86 0.17 38.69 0.09 0.02 0.21 0.08 0.02 0.00 0.02 0.02 G
1 0.21 0.37 3.12 1.94 25.29 0.12 62.03 0.09 0.03 0.88 0.07 0.03 0.00 0.03 0.03
2 0.15 0.30 3.29 1.62 40.66 0.08 78.68 0.14 0.03 0.84 0.05 0.03 0.00 0.03 0.03
3 0.42 1.34 4.7 1.69 37.88 0.09 66.97 0.08 0.02 0.86 0.03 0.02 0.00 0.02 0.02
Avg 0.26 0.67 3.70 1.75 34.61 0.10 69.23 0.10 0.03 0.86 0.05 0.03 0.00 0.03 0.03
제초제 처리 과수원 포장에서 강우 사상의 효과. 2. 유거와 토양침식의 변화