1. Introduction
1)In the last 1990s, water quality improvement projects were actively performed for the Geumho River as part of the government controlled project to supply fresh water. As a result, water quality was improved to BOD 3.6 mg/L in 2014 in which the quality of water corresponding to Class III environmental standards has been greatly improved
(NEWSWIRE, 2015). In addition, local governments installed buffer storage facilities for the readjustment of sewage and water pollution from industrial complexes and continued to make efforts to improve water quality by creating ecological streams and expanding sewage treatment facilities (Yang and Bae, 2012). As a result, the water quality in Geumho River has improved significantly, resulting in the highest water quality improvement rate among the
Received 11 October, 2018; Revised 23 October, 2018;
Accepted 23 October, 2018
*Corresponding author: Kyung hyun Kim, National Institute of Environmental Research, Yeongsan River Environment Research Center, Geryeong 40438, Korea
Phone : +82-62-970-3959 E-mail : [email protected]
ⓒ The Korean Environmental Sciences Society. All rights reserved.
This is an Open-Access article distributed under the terms of the Creative Commons Attribution Non-Commercial License (http://
creativecommons.org/licenses/by-nc/3.0) which permits unrestricted non-commercial use, distribution, and reproduction in any medium, provided the original work is properly cited.
ORIGINAL ARTICLE
An Analysis of Long-term Changes in Water Quality of Geumho River using Statistical Techniques
KangYoung Jung, Sohyun Cho, Donwoo Ha, Taewoo Kang, Yeong Jae Lee, KunYeun Han
1), Kyunghyun Kim
*Yeongsan River Environment Research Center, National Institute of Environmental Research, Goryeong 40438, Korea
1)School of Architecture, Civil, Environmental and Energy Engineering, Kyungpook National University, Daegu 41566, Korea
Abstract
In this study, water quality data of eight main sites in the Geumho River watershed were collected and analyzed for long-term changes in water quality over the period from 2005 to 2015. The results showed that BOD concentration was gradually improved by the Total Maximum Daily Load (TMDL), stages 1 and 2. Recently, a tendency of increasing BOD concentration was observed in the downstream section of the river. The concentration of COD was analyzed to be contaminated throughout the water system regardless of the water quality improvement project, and the TN concentration tended to increase in the midstream of the river from 2013. The TP concentration has clearly decreased from 2012 after the second stage of TMDL. For the statistical analysis of PCA ordination, monthly water qualities (pH, DO, Electrical Conductivity (EC), Water Temperature (WT), BOD, COD, TN, TP, TOC, and SS) and flow rate data for 5 years from 2012 to 2016 were used. Seasonally the Geumho River showed an increase in the TN concentration at point sources during the dry season (December to February). TP showed the effect of non-point sources in the summer, because rainfall has caused a rise in flow rate in the upstream. Besides, the origin of pollution source was changed from non-point sources with BOD, COD, and TOC.
Key words : Regional/seasonal Kendall test, Geumho river, PCA ordination statistical analysis
contaminated stream in the nation. However, Geumho River is still the main cause of the rise in water pollution of Nakdong River and is also still one of the most important rivers in terms of water quality management of the Nakdong River watershed (Jung, 2018). Meanwhile, efforts to improve water quality need to be made more scientific and systematic as development pressure continues to rise in the Geumho River watershed (Lee, 2013; Yun, 2014;
Kim, 2016). The role and importance of Geumho River in the Nakdong River watershed remains unchanged in the present day, and we are still making a lot of effort to maintain improved water quality.
However, detailed researches and investigations for changing the water quality of Geumho River according to efforts to improve the river are still not complete.
In this study, 11 years of water quality data were collected from 2005 to 2015 at eight main sites of the Geumho River watershed to analyse the trend of long-term water quality changes. The improvement effects of the water quality improvement project and the variation characteristics were evaluated using the Seasonal Kendall test for each site of the main stream of Geumho River, and the locally weighted scatter plot smoother (LOWESS) method was used to analyze the change during the period in order to compensate for the shortcomings of the Seasonal Kendall test with linear trends as the underlying assumption and to identify changing trends within a specific period of time. In addition, a regional trend (Regional Kendall test) analysis that evaluates a whole trend through combining trend tests for each site was performed, and specific trends in the water quality of the main stream of Geumho River were expressed in detail through temporal and spatial graphs during the period. Moreover, a main component analysis PCA ordination statistical method was used to analyze the temporal and spatial characteristics centered on Geumho River in order to
help the water quality management of Geumho River in the future by providing clear analysis of the current water condition.
2. Materials and methods 2.1. Target watersheds
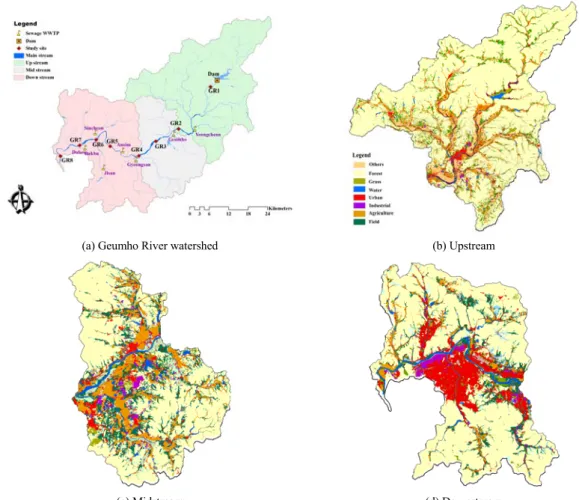
The target watershed of the Geumho River flows westward through Yeongcheon city after entering from Yeongcheon Dam, located in the upstream, and passes Gyeongsan city and Daegu Metropolitan city.
Then, it makes a smooth circuit to the north with
slow flows and joins the main stream of the Nakdong
River at Jukgok-ri, Dasa-myeon, Dalseong-gun. The
administrative district consists of Daegu Metropolitan
city, a large urban area with a large population of
2,500,000, and Gyeongsan city, North Gyeongsang
Province, Yeongcheon city, Pohang city, and
Chilgok-gun where many industrial complexes are
located (Jung, 2018). There are about 20 tributary
streams such as Nam stream, Sin stream, Palgeo
stream, and Dalseo stream in the Geumho River
watershed. It is the second largest of the tributaries of
Nakdong River, with a total length of 118 km and an
area of 2,092.3 km
2covering about 9% of the entire
the Nakdong River area of about 23,326.3 km
2, and
represents a shape factor of 1.32 with a smooth slop
in the main stream and a steep tributary stream line
(Choi, 2002; Hwang and Jeong, 2002; Jung et al.,
2012(a)). The annual average rainfall in the Geumho
River watershed is 1,056.6 mm, about 253.4 mm less
than the national average of 1,310.0 mm. Due to the
geographical influence of the Nakdong River inland
area, rainfall is less than that of other areas. The flow
rate shows severe differences between the flood and
the dry periods and that leads to flooding caused by
heavy rain during the flood period, and the water
quality during the dry period, April-December, is
worsening due to the lack of water for river
maintenance on Geumho River (Choi, 2004).
The water quality and flow data were collected from the Water Environmental Information System of the Ministry of Environment (WEIS, 2018) for a total of eight stations including five national water monitoring networks of the main Geumho River and three water pollution monitoring stations of the total water pollution load management network. Fig. 1 illustrates the subject sites in detail.
2.2. Status of land use
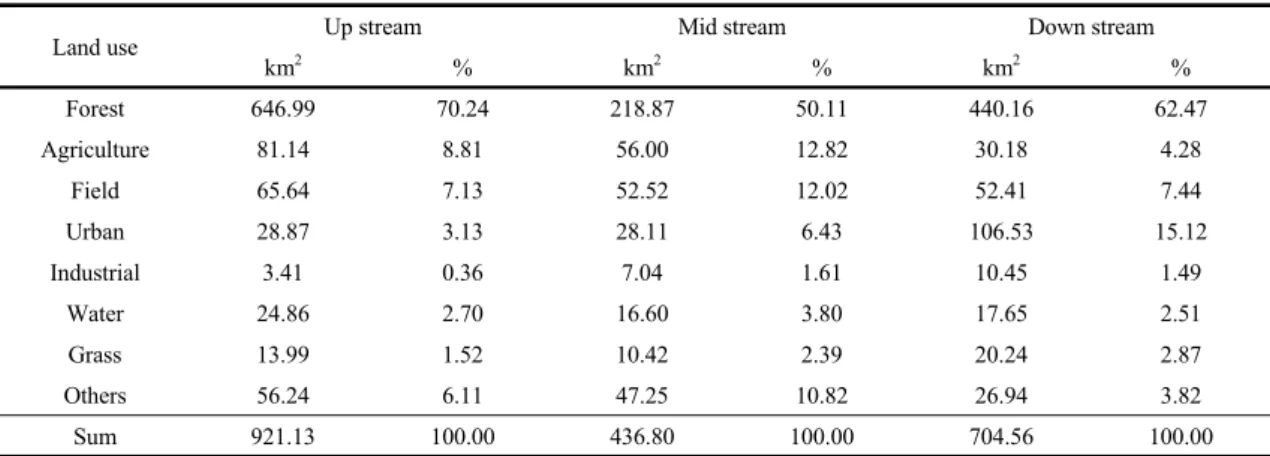
The water quality of a stream shows differences depending on land uses, such as urban, industrial, agricultural, forest, and grasslands, because stream water quality may be affected by the land use patterns. Land use types are directly related to human activities and govern environmental pollution.
Therefore, to properly manage water quality in watersheds, it is necessary to identify the effects of spatial water quality and the characteristics of land uses in relation to topographic conditions, land cover, and distribution of pollutants. In this study, the land
use status was analyzed with the Level-2 land use data provided by the Ministry of Environment to identify the land use status of Geumho River. The land use classification was implemented as eight different types such as Forest, Agriculture, Field, Urban, Industrial, Water, Grass, and Others and was mapped using the buffering function of Arc GIS 9.3.
Fig. 2 shows the map. Residential areas, commercial
areas, transport areas, and public facilities areas were
integrated into Urban, and facility plantation,
orchards, and other farmlands were also integrated
into Field. The upper reaches of the Geumho River
watershed are the largest areas of the forest (Forest),
and the midstream area of the watershed is the
highest percentage of rice paddies (Agriculture) and
fields (Field) by 24.84% excluding the forest. The
area and area ratio were calculated based on the
division of the entire Geumho River watershed as
upstream, midstream, and downstream (Table 1). The
total area of the Geumho River watershed is 2,062.49
km
2, and the upper reaches of the Geumho River
Fig. 1. Study area and monitoring sites in the Geumho River watershed.watershed are 921.13 km
2, where forests account for the largest amount of land. The midstream area of the Geumho River is 436.80 km
2, it shows the highest percentage of rice paddies (Agriculture) and fields (Field) by 24.84% except for the forest. Urban areas (Urban) are similar to the upper reaches, but the area of the industrial complex is twice as large as that of midstream areas and the number of businesses that have moved in there is twice as large. More than 70%
of the farmland in the entire watershed is located in the midstream area of Geumho River, and agriculture is developed in the midstream area of Geumho River (Daegu regional environmental agency, 2005). The
downstream area of Geumho River is 704.56 km
2, urban areas account for 15.12% as shown on the map, and covers 40.29% of the total area except the forest.
In the downstream area, four industrial complexes are located such as the Industrial Complex 3, the Geomdan Industrial Complex, the Dyeing Industrial Complex, and the Western Daegu Industrial Complex, which cover 10.45 km
2and are the same as the complexes located in the downstream and midstream areas of Geumho River.
Recently, GIS analysis tools are largely used for the spatial analysis of environmental pollutants such as non-point sources based on the cadastral
(a) Geumho River watershed (b) Upstream
(c) Midstream (d) Downstream
Fig. 2. Classification of the Geumho River watershed.
information according to usage for watersheds or business areas by using the information of the land use caused by these land use conditions (Jung et al., 2012(b); Park et al., 2014; Jung et al., 2015).
Barringer et al. (1990) suggested that using GIS mapping to analyze the space in a watershed is a simple and effective way to explain the relationship between land use and water quality.
2.3. Statistical analysis methods 2.3.1. Water quality trend analysis
The Regional Kendall test (Helsel and Frans, 2006) and the Seasonal Kendall test (Hirech and Slack, 1984) were applied to quantitatively analyze changes in the water quality of the main stream of Geumho River. The Regional Kendall test is a method used to identify changes in spatial water quality across subject points. This method provides full scale test statistics to verify whether a consistent trend is evident across the region, and it is possible to determine if there is a consistent regional trend in environment variables. The Seasonal Kendall test is an extended version of the Mann-Kendall test for testing linear trends by calculating the sum of Kendall's S statistics based on monthly and seasonal data. In this study, data were divided monthly, and the monthly average was calculated for the water
quality data with an interval of eight days in order to apply the Seasonal Kendall test method. In addition, the magnitude of the change was analyzed through obtaining the Seasonal Kendall slope statistic (Seasonal Kendall slope estimator). If p-value>0.05 for a significant level (α=0.05) in both 95%
confidence intervals, the null hypothesis (HO) that there is no trend will be accepted. If p-value<0.05, however, the null hypothesis is to be rejected and the alternative hypothesis (HI) will be accepted (Kim, 2001). After calculating the statistics of S and Z-value, the p-value was obtained to determine trends by testing its significance. Then, the LOWESS analysis was applied to identify the characteristics of the variation in water quality over the period of interest for each point for supplementing the reduction of the monotony of linear trend analysis using a curve trend method. The LOWESS analysis is a simple but suitable tool for fitting smoothing curves for real data, and it is useful to fit data with a regression model without assumptions about the primary or secondary regression model (Jacoby, 2000). Based on Cleveland (1993), the LOWESS analysis is an easy to calculate and easy to use statistical method and has been largely used as a long-term water quality trend analysis tool (Kim and Park 2004; Lee and Park 2008; Kim et al., 2014; Jung
Land use Up stream Mid stream Down stream
km2 % km2 % km2 %
Forest 646.99 70.24 218.87 50.11 440.16 62.47
Agriculture 81.14 8.81 56.00 12.82 30.18 4.28
Field 65.64 7.13 52.52 12.02 52.41 7.44
Urban 28.87 3.13 28.11 6.43 106.53 15.12
Industrial 3.41 0.36 7.04 1.61 10.45 1.49
Water 24.86 2.70 16.60 3.80 17.65 2.51
Grass 13.99 1.52 10.42 2.39 20.24 2.87
Others 56.24 6.11 47.25 10.82 26.94 3.82
Sum 921.13 100.00 436.80 100.00 704.56 100.00
Table 1. Upstream, midstream, and downstream land use types of the Geumho River watershed
et al., 2016).
2.3.2. PCA ordination statistical analysis The PCA ordination statistical technique is applicable to interpreting and evaluating water quality factors for the observation points of streams with complex water quality properties by combining two or more environmental variables and the characteristics of the observation sites. Recently, JM Dabrowski and LP de Klerk et al.(2013) applied the PCA ordination method for assessing the water quality effects of various land uses in the upstream area of Mozambique Olifants River in South Africa.
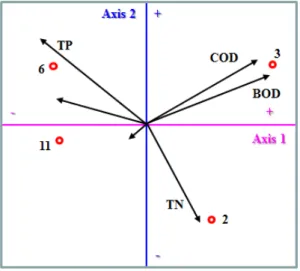
Fig. 3. PCA ordination analysis biplot.
In the PCA ordination method, two axes (axis1, axis2) describe the temporal and spatial distribution characteristics of most water quality variables in all monitoring points. The biplot shown in Fig. 3 represents that the horizontal axis is axis1, the vertical axis is axis2, and the direction of the arrow (the water variable) means the direction of the maximum change of the variable. The longer the arrow, the greater the impact on the site characteristics, and each arrow can be extended in all directions through its central origin. Therefore, the vertical projection point or corresponding month (red
circle) beyond the end or the end of the arrow is strongly correlated positively with the environmental variable represented by the arrow and is affected by the environmental variable. The sites with projections near their origin are less affected by the variables in question.
3. Results and discussion
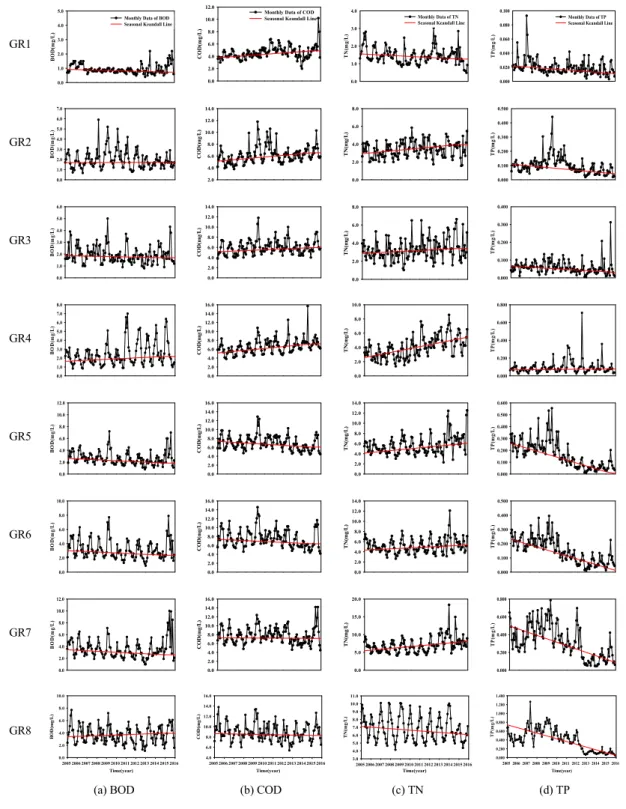
3.1. Analysis of water quality change trends It is necessary to accumulate long-term observations for analyzing and assessing the trend of long-term water quality changes in streams using statistical methods. Hirsch and Slack(1984) proposed reliable and accurate trend analysis using data values of at least 10 years for reliable and accurate trend analysis. In the analysis process, first, the regional Kendall test was used to identify the change trends for all eight points of the main stream of Geumho River; second, the trend of change for each of the eight points was analyzed using the Seasonal Kendall test. Also, the LOWESS analysis was implemented for each point to identify the characteristics of the variation in water quality over the period of interest.
3.1.1. Regional Kendall test
For four items of BOD, COD, TN, and TP, excluding TOC due to insufficient long-term observational data, the monthly data for 11 years were collected from 2005 to 2015, and the long-term variation in water concentrations was investigated.
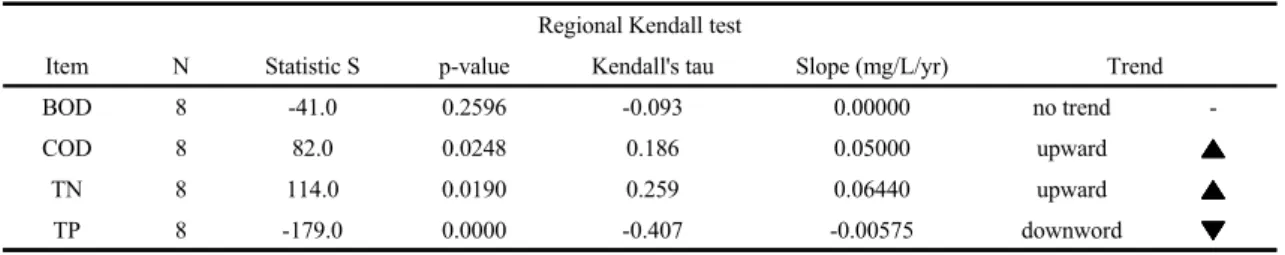
The level of trends was investigated using the Kendall slope estimator, and the slope is a calculation of the Kendall slope statistic, which is the level of the change (Kim, 2014). The Regional Kendall test result according to water quality terms is presented in Table 2 and is specified by upward, downword, and no trends.
The Regional Kendall test result for BOD showed
that the BOD concentration for the entire Geumho
River represented a constant trend of "maintain"
without any variations in the slope (Kendall slope statistic) with 0.00000 mg/L/yr by accepting the null hypothesis (HO) in which there exists no trend with S statistic of -41 and p-value of 0.2596. In the case of the COD concentration, it showed a very significant trend of "increase" across the watershed by accepting the alternative hypothesis (HI) that rejects the null hypothesis (HO) and there exists a trend with S statistic of 82.0 and p-value of 0.0248 based on the Regional Kendall test result. Here, the trend of increase was clearly presented with a slope of 0.05000 mg/L/yr. The TN concentration showed a significant trend of "increase" with S statistics of 114 and p-value of 0.0190 as a result of the Regional Kendall test analysis in which the slope showed a trend of increase as 0.06440 mg/L/yr. The TP concentration presented a significant trend of
"decrease", i.e., "improvment" with S statics of -179 and p-value of 0.0000 as a significant level (a) of less than 0.05 based on the Regional Kendall test analysis. In addition, the Kendall slope statistic showed a clear "decrease" as -0.00575 mg/L/yr.
These results are considered to be the effect of water quality improvement according to the implementation of the total water pollution load management system.
3.1.2. Seasonal Kendall test
The results of a long-term change trend analysis on the water quality data of eight main sites the Geumho River watershed are presented in Fig. 4 and Table 3 by item. In the case of the BOD concentration, the
"decrease" trend was significant at the GR5 point as the p-value significant level (a) 0.05 among the eight main sites of the Gemho River watershed. On the other hand, at the GR4 point only, the S statistic was 36 and the p-value showed a significant level (a) 0.05 with a significant trend of "increase". The GR4 point was the only increase in the Geumho B-section among the main Geumho River reaches, which is consistent with the preceding study (Park et al., 2013;
Jung et al., 2016). Other points showed no tends. In the case of the COD concentration, The points of GR1, GR2, GR3, and GR4 located upstream of the Geumho River watershed showed a significant trend of "increase". However, the only of the eight main sites indicated a significant trend of "decrease" in the GR5 point, while the GR6, GR7, and GR8 points located at the downstream showed no increase or decrease trend. In particular, in the COD concentration, it showed a significant trend of
"increase" centered on the upstream area. The TN concentration represented a trend of "increase" in the points of GR3, GR4, GR5, and GR7, and there was no point with a trend of "decrease". Except for them, there were no trends of increase or decrease in other branches. In the case of the TP concentration, the points of GR1, GR2, GR3, GR5, GR6, GR7, and GR8 showed a very significant trend of "decrease"
with p-value of 0.0092 0.0003. The GR4 point did not show any trends of increase or decrease, and no point was found to show a trend of "increase". For the TP concentration, the trends of "decrease" were
Regional Kendall test
Item N Statistic S p-value Kendall's tau Slope (mg/L/yr) Trend
BOD 8 -41.0 0.2596 -0.093 0.00000 no trend -
COD 8 82.0 0.0248 0.186 0.05000 upward
TN 8 114.0 0.0190 0.259 0.06440 upward
TP 8 -179.0 0.0000 -0.407 -0.00575 downword
Note : p-value 0.05 statistically significant trends
Table 2. Regional Kendall tests results for the Geumho River watershed
GR1
BOD(mg/L)
0.0 1.0 2.0 3.0 4.0 5.0
Monthly Data of BOD Seasonal Keandall Line
COD(mg/L)
0.0 2.0 4.0 6.0 8.0 10.0
12.0 Monthly Data of COD
Seasonal Keandall Line
TN(mg/L)
0.0 1.0 2.0 3.0 4.0
Monthly Data of TN Seasonal Keandall Line
TP(mg/L)
0.000 0.020 0.040 0.060 0.080 0.100
Monthly Data of TP Seasonal Keandall Line
GR2
BOD(mg/L)
0.0 1.0 2.0 3.0 4.0 5.0 6.0 7.0
COD(mg/L)
2.0 4.0 6.0 8.0 10.0 12.0 14.0
TN(mg/L)
0.0 2.0 4.0 6.0 8.0
TP(mg/L)
0.000 0.100 0.200 0.300 0.400 0.500
GR3
BOD(mg/L)
0.0 1.0 2.0 3.0 4.0 5.0 6.0
COD(mg/L)
0.0 2.0 4.0 6.0 8.0 10.0 12.0 14.0
TN(mg/L)
0.0 2.0 4.0 6.0 8.0
TP(mg/L)
0.000 0.100 0.200 0.300 0.400
GR4
BOD(mg/L)
0.0 1.0 2.0 3.0 4.0 5.0 6.0 7.0 8.0
COD(mg/L)
0.0 2.0 4.0 6.0 8.0 10.0 12.0 14.0 16.0
TN(mg/L)
0.0 2.0 4.0 6.0 8.0 10.0
TP(mg/L)
0.000 0.200 0.400 0.600 0.800
GR5
BOD(mg/L)
0.0 2.0 4.0 6.0 8.0 10.0 12.0
COD(mg/L)
0.0 2.0 4.0 6.0 8.0 10.0 12.0 14.0 16.0
TN(mg/L)
0.0 2.0 4.0 6.0 8.0 10.0 12.0 14.0
TP(mg/L)
0.000 0.100 0.200 0.300 0.400 0.500 0.600
GR6
BOD(mg/L)
0.0 2.0 4.0 6.0 8.0 10.0
COD(mg/L)
0.0 2.0 4.0 6.0 8.0 10.0 12.0 14.0 16.0
TN(mg/L)
0.0 2.0 4.0 6.0 8.0 10.0 12.0 14.0
TP(mg/L)
0.000 0.100 0.200 0.300 0.400 0.500
GR7
BOD(mg/L)
0.0 2.0 4.0 6.0 8.0 10.0 12.0
COD(mg/L)
0.0 2.0 4.0 6.0 8.0 10.0 12.0 14.0 16.0
TN(mg/L)
0.0 5.0 10.0 15.0 20.0
TP(mg/L)
0.000 0.200 0.400 0.600 0.800
GR8
Time(year) 2005 2006 2007 2008 2009 2010 2011 2012 2013 2014 2015 2016
BOD(mg/L)
0.0 2.0 4.0 6.0 8.0 10.0
Time(year) 2005 2006 2007 2008 2009 2010 2011 2012 2013 2014 2015 2016
COD(mg/L)
4.0 6.0 8.0 10.0 12.0 14.0 16.0
Time(year) 2005 2006 2007 2008 2009 2010 2011 2012 2013 2014 2015 2016
TN(mg/L)
3.0 4.0 5.0 6.0 7.0 8.0 9.0 10.0 11.0
Time(year) 2005 2006 2007 2008 2009 2010 2011 2012 2013 2014 2015 2016
TP(mg/L)
0.000 0.200 0.400 0.600 0.800 1.000 1.200 1.400
(a) BOD (b) COD (c) TN (d) TP
Fig. 4. Trend graphs of the water quality for each site in Geumho River.
Monitoring site
Seasonal Kendall trend
BOD COD TN TP
Slope
(mg/L/yr) p-value Trend Slope
(mg/L/yr) p-value Trend Slope
(mg/L/yr) p-value Trend Slope
(mg/L/yr) p-value Trend GR1 -0.01937 0.0617 no trend 0.1118 0.0472 upward -0.02922 0.1372 no trend -0.00100 0.0092 downword GR2 0.00313 0.8680 no trend 0.1419 0.0006 upward 0.10310 0.1372 no trend -0.00614 0.0179 downword GR3 -0.01833 0.5787 no trend 0.08167 0.0502 upward 0.05562 0.0240 upward -0.00316 0.0058 downword GR4 0.05500 0.0533 upward 0.2050 0.0002 upward 0.26250 0.0050 upward 0.00087 0.5814 no trend GR5 -0.08000 -0.0540 downword -0.1292 0.0313 downword 0.17680 0.0179 upward -0.02394 0.0002 downword GR6 -0.06667 -0.1360 no trend -0.1000 0.1360 no trend 0.09142 0.0879 no trend -0.01981 0.0001 downword GR7 -0.08542 -0.0768 no trend -0.01250 0.9122 no trend 0.24310 0.0029 upward -0.03740 0.0070 downword GR8 0.05556 0.3210 no trend -0.03452 0.3210 no trend -0.09462 0.1372 no trend -0.06284 0.0003 downword Note : p-value 0.05 statistically significant trends
Table 3. Seasonal Kendall tests results BOD, COD, TN, and TP
Time(year)
2005 2006 2007 2008 2009 2010 2011 2012 2013 2014 2015 2016
BOD(mg/L)
0.0 1.0 2.0 3.0 4.0 5.0 6.0 7.0 8.0
Monthly Data of BOD Seasonal Keandall Line LOWESS Line
Time(year)
2005 2006 2007 2008 2009 2010 2011 2012 2013 2014 2015 2016
BOD(mg/L)
0.0 2.0 4.0 6.0 8.0 10.0
(a) BOD GR4 (Geumho river 2A) (b) BOD GR8 (Geumho river 6)
Time(year)
2005 2006 2007 2008 2009 2010 2011 2012 2013 2014 2015 2016
COD(mg/L)
2.0 4.0 6.0 8.0 10.0 12.0 14.0
Time(year)
2005 2006 2007 2008 2009 2010 2011 2012 2013 2014 2015 2016
COD(mg/L)
4.0 6.0 8.0 10.0 12.0 14.0 16.0
(c) COD GR2 (Geumho river 1A) (d) COD GR8 (Geumho river 6)
Fig. 5. Results of the trend analysis of BOD, COD concentrations in the main stream of Geumho River (example).
considerable compared to other items, and the overall Geumho River watershed, excluding the GR4 point that did not show the trend of increase or decrease, showed a clear tend of "decrease".
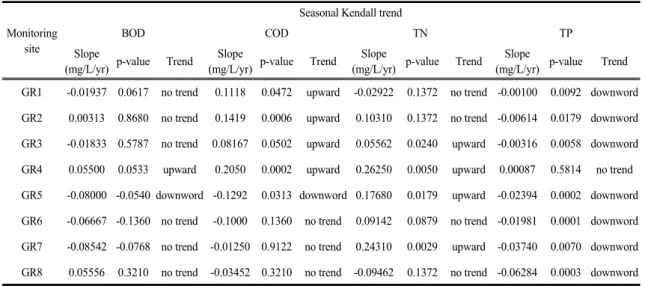
3.1.3. LOWESS analysis
The LOWESS analysis was implemented to identify the specific water quality change characteristics for each point of interest. In the results of the analysis, it shows that changes in water quality are identified during the target period and the points in which the variation in the water quality of BOD and COD is presented in Fig. 5, and of TN and TP is presented in Fig. 6. Also, the characteristics of specific changes were analyzed for the points presented as examples.
The BOD concentration at the GR4 point represented a trend of "increase" in the Seasonal Kendall test results, but the LOWESS analysis showed a tend of "decrease" after "increase" in 2010.
The GR8 (Geumho River 6) point showed a trend of
"maintain" without increasing or decreasing trends in the Seasonal Kendall test results, but the LOWESS analysis showed a trend of decrease to 2011 and a trend of increase again from 2012. As a result of the LOWESS analysis at the remaining sites, the BOD concentration was continuously reduced, but recently showed a trend of increase from late 2013. The GR8 (Gumho River 6) point is a Geumho C unit watershed and is a point of the national water quality network and that shows the most polluted load due to its location, which is the lower reach of Geumho River.
Time(year)
2005 2006 2007 2008 2009 2010 2011 2012 2013 2014 2015 2016
TN(mg/L)
0.000 2.000 4.000 6.000 8.000 10.000
Time(year)
2005 2006 2007 2008 2009 2010 2011 2012 2013 2014 2015 2016
TN(mg/L)
0.000 2.000 4.000 6.000 8.000 10.000 12.000 14.000 16.000 18.000 20.000
(e) TN GR4 (Geumho river 2A) (f) TN GR7 (Geumho river 5)
Time(year)
2005 2006 2007 2008 2009 2010 2011 2012 2013 2014 2015 2016
TP(mg/L)
0.000 0.100 0.200 0.300 0.400 0.500
Time(year)
2005 2006 2007 2008 2009 2010 2011 2012 2013 2014 2015 2016
TP(mg/L)
0.000 0.100 0.200 0.300 0.400 0.500
(g) TP GR4 (Geumho river 2A) (h) TP GR6 (Geumho river 4)
Fig. 6. Results of the trend analysis of TN, TP concentrations in the main stream of Geumho River (example).
The GR8 point has been maintained below the target quality within the period of implementation of the total pollution control system based on the assessment of the quality according to the current regulations for the past five years and evaluation of achievement compared to the target quality value of 4.0 mg/L determined in the second stage. However, the LOWESS analysis results indicate a trend of increase since 2012. The COD concentration of the GR2 (Geumho river 1A) point, which is the upstream area of Gemho River, showed a continuous
"increase" in the LOWESS analysis results, as shown in Seasonal Kendall test. The GR8 point represented a state of "maintain" in the results of the Seasonal Kendall test in Gemho River, but the LOWESS analysis showed a trend of "increase" again in 2013.
According to the LOWESS analysis of the COD concentration in Gemho River, the upstream area that showed a trend of "increase" represented an increase in the concentration continuously, and the downstream areas where the slope is expressed as (-) have also been analyzed as a trend of increase again since 2013.
In the case of the TN concentration, although the results of the Seasonal Kendall test at the GR4 (Geumho Driver 2A) point showed a trend of
"increase", the LOWESS analysis represented a steady increase from 2008 to 2012 and showed a trend of maintain again. Although the GR7 point also showed a trend of "increase", the LOWESS analysis showed a trend of maintain since 2013. As the TP concentration showed a significant trend of
"decrease" in the Regional Kendall test, the LOWESS analysis also showed a trend of "decrease"
steadily from the time the TP was selected and implemented as the total control item at the entire points of Geumho River as well as the GR6 point shown in Fig. 6. The TP concentration at the GR4 point, which is the only point of increase or decrease, showed steadily a trend of "decrease" as of 2012 based on the LOWESS analysis.
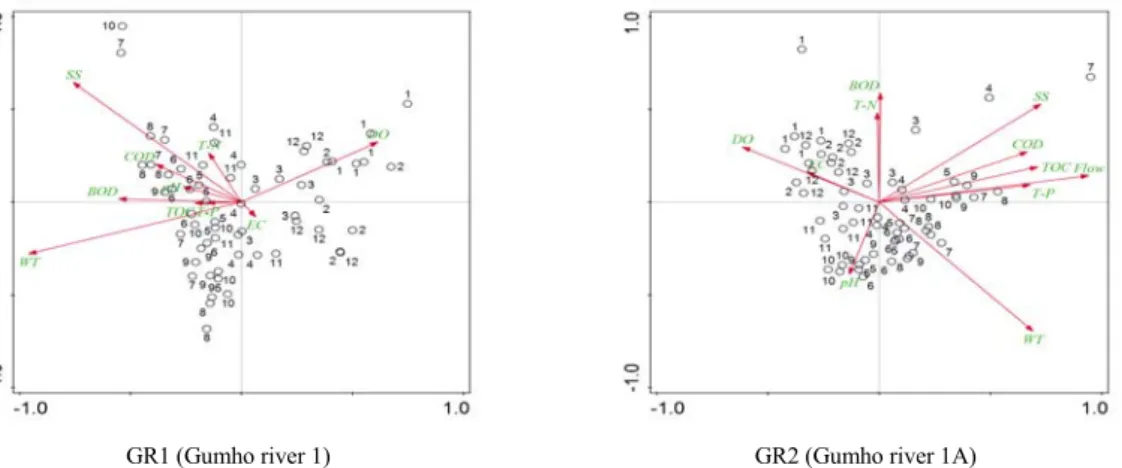
3.1.4. PCA ordination statistical analysis Geumho River is greatly influenced by the distribution of pollutants and watershed characteristics, and rainfall increases the possibility of serious pollution. Also, the water quality characteristics represent a very diverse pattern for each stream and point due to the combination of the water quality in non-rainfall and the seasonal characteristics. For implementing the PCA ordination statistical analysis, monthly water quality data (pH, DO, EC, WT, BOD,
GR1 (Gumho river 1) GR2 (Gumho river 1A)
Fig. 7. PCA ordination of water quality variables (arrow) and months (black point) at each point of Geumho River (Continued).
GR3 (Gumho river 2) GR4 (Gumho river 2A)
GR5 (Gumho river 3) GR6 (Gumho river 4)
GR7 (Gumho river 5) GR8 (Gumho river 6)
Fig. 8. PCA ordination of water quality variables (arrow) and months (black point) at each point of the Geumho River.
COD, TN, TP, TOC, and SS) for five years from 2012 to 2015 have been collected and used. First, the land use situation and major changes in water quality according to external factors are introduced based on the previous analysis of the land use status and trend results of the main points (GR1 GR8) of the upstream, midstream, and downstream in Geumho River.
In the PCA ordination, the two main axes account for most of the total variation across all data sets, and most of the first two axes (axis1, axis2) are in common, clearly showing the temporal and spatial distribution characteristics of the water quality variables in all survey sites (Fig. 7, Fig. 8). Table 4 shows the PCA ordination results for the water quality parameters analyzed in the major points of Geumho River. Table 4. Descriptions of the water quality parameters by the PCA ordination analysis of the Geumho River Considering the results, two PCA axes (axis1, axis2) in the GR1 point account for 82.9% of the total variation (axis 1: 66.6%, axis2:
16.3%). The most important parameters in the axis1 are WT (-0.960), DO (0.615), BOD (-0.555), and SS (-0.760), but there is no apparent correlation of environmental factors in the axis2. As this point is
located in the most upstream with the largest forest area in Geumho River, the environmental factors of the SS are clearly observed due to the impact of rainfall in July and August. Choi et al., (2009) reported that the outflow of non-point sources in forest areas, differences in water quality other than SS was insignificant in a study on the characteristics.
In the GR2 point, the most close parameters in the axis1 are DO (-0.615), COD (0.666), TOC (0.713), SS (0.727), TP (0.680), and flow rate (0.942), and the major parameters in the axis2 are WT (0.695), BOD (0.588), and TN(0.483). At this point, the TP, which is a source of organic pollutants and nutrients such as COD and TOC, was identified as a major environmental factor along with the SS. In particular, these environmental factors appear to be heavily influenced by physical and hydrologic factors as they appear to be a strong causal relationship with flow rates in July and August. Therefore, it can be interpreted that the non-point source acts as the main source of pollution. In the GR3 point, the PCA axis1 and axis2 describe 79.4% of the total variation (axis1:
49.6%, axis2: 29.8%). The most important parameters in the axis1 are WT (0.714), DO (-0.737), BOD (0.438), EC (-0.566), COD (0.675), SS (0.856),
GR1 GR2 GR3 GR4 GR5 GR6 GR7 GR8
Axis1 Axis2 Axis1 Axis2 Axis1 Axis2 Axis1 Axis2 Axis1 Axis2 Axis1 Axis2 Axis1 Axis2 Axis1 Axis2 WT -0.960 -0.277 0.690 -0.695 0.714 -0.678 0.723 -0.563 -0.239 -0.388 -0.842 -0.526 -0.754 -0.634 0.810 0.006 DO 0.615 0.324 -0.615 0.297 -0.737 0.076 -0.737 0.386 -0.677 0.495 0.630 0.491 0.662 0.367 -0.664 0.218 pH -0.264 0.081 -0.135 -0.387 0.042 -0.507 -0.242 -0.180 -0.490 0.049 -0.153 0.096 -0.373 0.286 0.175 0.443 EC 0.064 -0.078 -0.325 0.161 -0.566 -0.057 -0.754 0.128 0.278 0.045 0.535 0.341 0.692 0.302 -0.705 0.483 BOD -0.555 0.016 0.004 0.588 0.438 0.373 0.030 0.835 0.915 0.388 -0.476 0.322 -0.512 0.415 0.510 0.563 COD -0.387 0.203 0.666 0.271 0.675 0.055 0.657 0.486 -0.514 0.607 -0.636 0.409 -0.663 0.397 0.442 0.630 TOC -0.211 -0.008 0.713 0.189 0.147 -0.496 0.492 0.532 0.342 0.343 -0.260 0.011 -0.273 0.184 0.321 0.789 SS -0.760 0.646 0.727 0.529 0.856 0.509 0.906 0.282 -0.092 -0.326 -0.865 0.489 -0.929 0.307 0.786 0.509 T-N -0.148 0.265 -0.010 0.483 -0.080 0.432 -0.334 0.596 0.705 -0.653 0.489 0.293 0.587 -0.043 -0.772 0.109 T-P -0.156 -0.007 0.680 0.092 0.709 0.315 0.533 0.458 -0.730 0.228 -0.666 0.262 -0.343 0.455 0.149 0.465
Flow - - 0.942 0.142 - - 0.949 0.045 - - - 0.750 -0.602
Table 4. Descriptions of the water quality parameters by the PCA ordination analysis of the Geumho River
and TP(0.709), and shows a high correlation with pH (-0.507), TOC (-0.500), and TN (0.432) has verified.
The major correlation parameters in the GR 4 point are WT (0.723), DO (-0.737), EC (-0.754), COD (0.657), SS (0.906), TP (0.533), and flow rate(0.949), and the major parameters in the axis2 are BOD (0.835), TOC (0.532), and TN (0.596). Also, COD and TP are also considered as important environment parameters in this point, and this point shows the same trend as the GR2 point with a high correlation together with high flows in July and August. The parameters of BOD and TN become major environment parameters during the dry season, January-March. This is likely to be the result of point sources such as sewage treatment plants. In the GR5 point, the PCA axis1 and axis2 represent 76.3% of the total vaiation (axis1: 56.2%, axis2: 20.1%). The highly correlated parameters in the axis1 are DO (-0.677), BOD (-0.490), SS (0.915), WT (0.705), and EC(-0.730), and the major parameters in the axis2 are TN (0.607) and TP (0.343). In the GR6 point, the PCA axis1 and axis2 shows 80.9% of the total variation (axis1: 59.4%, axis2: 21.5%). The highly correlated parameters in the axis1 are WT (-0.842), DO (0.630), EC (0.535), BOD (-0.476), COD (-0.636), SS (-0.865), TN (0.489), and TP (-0.666), and there are no significant water quality parameters in the axis2. An interest point at this point is that environmental parameters such as BOD, COD, SS, TN, and TP are emerged as key parameters. Although the timing of each item's impact varies, increases in the concentration caused by point and non-point sources are occurring at the same time. In the GR7 point, the PCA axis1 and axis2 describe 75.1% of the total vaiation (axis1: 57.3%, axis2: 17.8%). The highly correlated parameters in the axis1 are WT (-0.754), DO (0.662), EC (0.692), BOD (-0.512), COD (-0.663), SS (-0.929), and TN(0.587), and the major parameter in the axis2 is TP (0.455).
In the GR8 point, the PCA axis1 and axis2
represent 78.2% of the total variation (axis1: 54.9%, axis2: 23.3%). The highly correlated parameters in the axis1 and axis2 are WT (0.810), DO (-0.664), EC (-0.705), SS (0.786), TN (-0.772), and flow rate (0.750) and pH (0.443), BOD (0.563), COD (0.630), TOC (0.789), and TP (0.465) respectively. These results show the water quality of the Gemho River watershed in terms of temporal and spatial characteristics according to seasons and specific points depending on the land use characteristics around it. The upstream area is being affected by non-point sources (TPs) in the downstream where the flow rate increases by rainfall. This means that in the upstream areas of the surrounding watershed, where the arable land is heavily distributed compared to the downstream areas, and the increase in nutrients is caused by the run off of the land during the flood period. Changes in rainfall patterns allow a significant impact on changes in water quality in streams and the introduction of nutrients during the flood season (summer season) where rainfall accelerates eutrophication. Moreover, the surrounding land use characteristics are a different factor that causes changes in the temporal and spatial water quality in given watersheds, which is more different from the downstream area. The watersheds surrounding the mid- and downstream areas of the Geumho River watershed are formed by large urban and industrial zones, and pollutants originating from these regions can continue to affect the water quality of Geumho River throughout the year. The PCA ordination shows that TN, which originated from point sources, is increasing due to the relatively lack of rainfall during the dry season (January-February).
Except for the GR6 point, the non-point source
(TP) acts as a direct factor in water quality
simultaneously during the flood period (June-August),
in addition to the point source (TN). It is considered
that this phenomenon is to be a combination of the
residential and industrial sources in the surrounding
areas and the land-related sources from the upstream.
In summarizing the results of the PCA ordination statistics, the main environmental parameters in Geumho River are the order of COD>TOC>TP>TN>
BOD, whose origins are largely affected by non-point sources. Here, the point and non-point sources affect the water quality at the same time, and these environmental parameters are thought to be affecting the main stream in the point and non-point sources.
Geumho River is the most important tributary to the water quality of the Nakdong River. In particular, TN and TP, which are originated from the Geumho River watershed as a temporal and spatial manner, are major limiting factors that determine the growth and primary productivity of photosynthesis such as plant plankton in freshwater ecosystems. At the same time, they also act as a major source of pollution in the watershed. Fig. 8 represents an analysis of the variation in pollution by year of water quality parameters at the GR8 (Geumho river 6) point at the end of the Geumho River watershed.
As shown in the biplot results, TN is still affecting the period of the dry season (November-February) in 2016 compared to 2007 and becomes a strong source
at this point. On the other hand, TP represents that patterns of the origin of pollution were changed due to non-point sources in 2016 if it was under the influence of point source as of 2007. It can be interpreted as meaning that the pollution load at the point has decreased as a result of reduction of TP loads. In addition, it is also important to note that the arrows in the same direction, along with the SS and TP, are extended in the same direction and the arrows are passing between June and July. In case of TOC and COD, if the effects were small in 2007, it can be interpreted that the main source is acting as a major pollutant source at this point in 2016 and its origin is coming from a non-point source. In the case of BOD, its impact was more highlighted in 2016 compared to 2007. This is also consistent with the previous trend analysis and results from XYZ triplet content map graphs. In view of these results, the effect on the point source has been reduced due to a reduction in the BOD load on the point source. However, it can be seen that changes in the pattern of the sources show that BOD loads are occurring at the point source and the concentration is also higher than in 2007.
Previously, in the results of the PCA ordination of the
Fig. 9. PCA ordination analysis for the comparison of 2007 and 2016 data, XYZ triplet temporal-spatial contour map,BOD at the GR8 (Geumho River 6) point.