23(1); 25~37; January 2014 http://dx.doi.org/10.5322/JESI.2014.23.1.25
ORIGINAL ARTICLEOn the Characteristics of the Precipitation Patterns in Korea Due to Climate Change
Park Jong-Kil, Seong Ihn-Cheol
1), Kim Baek-Jo
2), Jung Woo-Sik
3)*, Lu Riyu
4)Department of Environmental Engineering, Atmospheric Environment Information Research Center, Inje University, Gimhae 621-749, Korea
1)
Forecast Policy Planning Division, Korea Meteorological Administration, Seoul 156-720, Korea
2)
Policy Research Lab.,National Institute of Meteorological Research, Korea Meteorological Administration, Seoul 156-720, Korea
3)
Department of Atmospheric Environment Information Engineering, Graduate school/
Atmospheric Environment Information Research Center, Inje University, Gimhae 621-749, Korea
4)
Institute of Atmospheric Physics, Chinese Academy of Sciences, Beijing 100029, CHINA
Abstract
In the present study, we analyzed precipitation patterns and diurnal variation trends of hourly precipitation intensity due to climate change. To that end, we used the hourly precipitation data obtained from 26 weather stations around South Korea, especially Busan, from 1970 to 2009.
The results showed that the hourly precipitation was concentrated on a specific time of day. In particular, the results showed the so-called “morning shift” phenomenon, which is an increase in the frequency and intensity of hourly precipitation during the morning. The morning shift phenomenon was even more pronounced when a higher level of hourly precipitation intensity occurred throughout the day. Furthermore, in many regions of Korea, including Busan, this morning shift phenomenon became more prevalent as climate change progressed.
Key words : Precipitation pattern, Hourly precipitation intensity, Climate change, Morning shift, Disaster prevention
1. Introduction
1)From 1912 to 2008, the average temperature in six South Korean metropolitan areas—Seoul, Incheon, Gangneung, Daegu, Mokpo, and Busan—has increased by 1.7 ℃, which is higher than the global average temperature increase (0.74 ± 0.03 ℃). In addition, the annual total precipitation increased about 19% during that period, compared to that in the 1910s (NIMR,
2009a). Park et al. (2005) reported that short periods of local heavy rain frequently occurred in the summer and precipitation intensity increased, resulting in an increasing trend in massive weather disasters and damage due to climate change.
In a previous study on precipitation change due to climate change, NIMR (2006) found an overall increase in precipitation on the Korean Peninsula from 1912 to 2005. In particular, the author noted a
Received 23 December, 2013; Revised 16 January, 2014;
Accepted 17 January, 2014
*Corresponding author : Jung Woo-Sik, Department of Atmospheric Environment Information Engineering, Graduate school/ Atmospheric Environment Information Research Center, Inje University, Gimhae 621-749, Korea
Phone: +82-55-320-3932 E-mail: [email protected]
ⓒ The Korean Environmental Sciences Society. All rights reserved.
This is an Open-Access article distributed under the terms of the Creative Commons Attribution Non-Commercial License (http://
creativecommons.org/licenses/by-nc/3.0) which permits unrestricted non-commercial use, distribution, and reproduction in any medium, provided the original work is properly cited.
significant increase in precipitation since the 1980s.
Regarding the change in precipitation intensity, NIMR (2009b) analyzed the average precipitation pattern in 14 weather stations around South Korea since the 1950s, showing that yearly precipitation increased even while the number of days with precipitation decreased. Hence, an increase in precipitation intensity occurred. A few studies on the characteristics of precipitation pattern change due to Korea's shift to a subtropical climate have also been conducted. Kim (2007) found that as subtropical climate change has progressed on the Korean Peninsula, precipitation in August increased considerably there, and many convective local heavy rainfalls have occurred during July and August. In addition, regarding the daily variation in precipitation, Kim (2007) determined that much precipitation occurred at early dawn and in the morning due to the subtropical climate change in Korea.
Recently, a number of studies have also been conducted on precipitation patterns and climate-based changes in precipitation intensity in specific South Korean regions. For example, precipitation in the Busan region, which has become increasingly subtropical over the last century, has increased 13.5 mm every 10 years (from 1905 to 2008), while the number of days with precipitation decreased by 2.1 days, resulting in an increasing rate of precipitation intensity by 0.3 mm/day (NIMR, 2009b).
Park et al. (2013) reported that annual total precipitation in most regions of South Korea, including Busan, has increased slightly from 1970 to 2009, while hourly precipitation intensity (28.2%) has increased significantly compared to increase of daily precipitation intensity (5.0%). They also found that frequency and precipitation of less than 5 mm/h has decreased whereas those over 10 mm/h, in particular, over 30 mm/h, have increased significantly, revealing that the more the hourly precipitation increased, the more frequency of the precipitation increased.
Recent severe rainstorms, with torrential rains causing massive damage in Busan on July 7 and 16, 2009, and in Seoul during September 2010 and July 2011, set record levels of precipitation falling in a short duration. Thus, it should note that precipitation intensity based on the level of hourly precipitation is a major factor in weather disasters, as opposed to changes in precipitation intensity based on the number of days with precipitation.
Accordingly, the Korea Meteorological Administration (KMA) has recently changed the criteria for a heavy rain warning and a special report announcement from a 24 hour basis to 12 or 6 hour basis (KMA, 2011).
This change reflects the emphasis on severe rainstorms with short durations because these storms have caused most of the recent weather disasters in Korea.
Therefore, it is very important to know the level of hourly precipitation and duration.
Studies on the daily variation in precipitation were conducted by many researchers; Ramage (1950) showed that the maximum summertime (May to August) precipitation frequency and intensity in East Asia occurred during early dawn and morning. Ha (1997) analyzed the daily precipitation change in South Korea and classified the change according to the time of day in which maximum precipitation, intensity, and hourly frequency occurred. In Ha’s study, the west and south coast of Korea experienced maximum precipitation in the morning, while part of the east coast and the inlands experienced maximum precipitation in the afternoon. However, these two studies were only successful in classifying the average value within the fixed period, as they analyzed the daily variation in precipitation but did not analyze the daily variation in precipitation pattern due to climate change. Thus, no information was provided in these studies regarding changes in patterns to occur in the future.
Therefore, in the present study, we examined the
daily variation in precipitation patterns in South Korea,
especially Busan, and the changes in precipitation patterns according to different times of day, thereby determining the correlation of the precipitation pattern change with climate change. Furthermore, in the present study, we examined how the daily variation pattern in precipitation relates to the recent severe rainstorms, thereby providing foundational data to minimize damage due to future severe rainstorms.
2. Data and Methods
2.1. Data
The data used in this study to analyze the changing trends in daily precipitation patterns due to climate change in South Korea, including Busan, was obtained via 26 weather stations where long-term observations have occurred since the 1970s, building on the analysis of Park et al. (2013). Specifically, the period of the data observed was from 1970 to 2009.
It was important to secure valid data before analysis.
Thus, we applied the statistical method used in Larsen (1973) and Park et al. (2008), which posited that at least two-thirds of the observable data in a dataset should be available if the results are to have statistical significance. In the present study, data was used for analysis only when more than two-thirds of observable daily data was available (less than 8 hour missing in 24 hours of observation data). Accordingly, a monthly average was only calculated when the daily average was available for more than two-thirds of any given month.
For yearly analysis, data from each November to the following March was excluded because more than one-third of observable hourly precipitation data was missing. Further, because observable data from the Jeongeup, Imsil, and Buan weather stations was less than one-third of the total information from these stations in 1970–1972, these three years were excluded from the analysis (Park et al., 2013).
2.2. Analysis method
The frequently used terms for analysis in the present study are defined as follows (Park et al., 2013):
· Hourly precipitation (P(h), mm) refers to precipitation measured at each weather station for one hour.
· Frequency of precipitation hours ( F(h)) refers to a count of more than 0.1 mm of hourly precipitation (the number of cases where precipitation was more than 0.1 mm/h).
· Hourly precipitation intensity PI(h), mm/h) refers to a value that divides a sum of P(h) for a given period by the F(h), as indicated in Equation (1):
PI(h) = ∑P(h) ÷ F(h) (1)
Using trend lines and slopes obtained from all the analysis data, the change trends were compared and analyzed. That is, using the time-based data summed per year, trend lines of precipitation, frequency, and increase or decrease of intensity per precipitation level and precipitation intensity were produced, as were slopes for each of these values.
3. Results and Discussion
3.1. Daily variation of hourly precipitation
Fig. 1 shows the analysis results of daily variation in Busan’s P(h) during the study period to examine the changes in precipitation patterns on the Korean Peninsula due to climate change. As shown in Fig. 1, the maximum peak precipitation (MPP), which represents the maximum value of P(h) in a specific duration within a day, was in the morning.
To find the detailed characteristics of the MPP in the morning, the intensity of P(h) was divided into 6 different levels to display daily variance (Fig. 1). Fig.
1 showed that when P(h) was less than 10 mm,
relatively uniform distribution occurred throughout
the day, whereas when PI(h) increases such as 10
mm/h and 30 mm/h, precipitation concentrated in the
daily total precipitation (DTP) : 51,397mm
morning
hour 01 02 03 04 05 06 07 08 09 10 11 12 subtotal
precipitation
(P) (mm) 1863 2047 2238 2555 2640 2577 2700 2745 2499 2359 2378 2496 29096 ratio
(P/DTP) 4% 4% 4% 5% 5% 5% 5% 5% 5% 5% 5% 5% 57%
afternoon
hour 13 14 15 16 17 18 19 20 21 22 23 24 subtotal
precipitation
(P) (mm) 2335 2051 1986 1747 1689 1692 1858 1773 1870 1771 1656 1874 22302 ratio
(P/DTP) 5% 4% 4% 3% 3% 3% 4% 3% 4% 3% 3% 4% 43%
Table 1. Comparison of the ratio and amount of hourly precipitation in Busan during period from 1970 to 2009
morning.
To determine the characteristics of variance for P(h), which concentrated in the morning, a ratio of P(h) and daily total precipitation (DTP) from 1970 to 2009 was applied, as shown in Table 1. Table 1 revealed that some differences occurred in P(h) per each hour, but a ratio of P(h) to DTP was within 3 to 5%, which was not sufficient to explain the MPP.
However, when comparing the total amount of precipitation in the morning (1 a.m. to 12 p.m.) and in the afternoon (13 p.m. to 24 p.m.), it showed that the morning had a somewhat higher proportion of DTP than in the afternoon: 57% of DTP in the morning and 43% in the afternoon. This difference explains why precipitation was concentrated in the morning, as shown in Fig. 1. Such a phenomenon is defined as the “morning shift” in the present study.
The independent sample t-test on the precipitation phenomenon (see Table 2) occurring in the morning and afternoon showed its significant probability as 0.000, rejecting the null hypothesis that average precipitation was the same in the morning and afternoon. Thus, we accepted the morning shift phenomenon as significant, with significance level of 0.01.
Fig. 1. Diurnal variation of hourly precipitation in 6 levels of precipitation intensity in Busan during period from 1970 to 2009.
Mean
(mm) Standard Error
(mm) t
morning 60.62 1.46
7.909**
(equal variance) afternoon 46.48 1.02
** : significance at level 0.01
Table 2. Result from independent sample t-test on the amount of precipitation between the morning and afternoon in Busan during 1970-2009
Fig. 2. Diurnal variation of hourly precipitation of each level at (a) 1970s(1970~1979), (b) 1980s(1980~1989), (c) 1990s(1990~1999), and (d) 2000s(2000~2009) in Busan, Korea.
To determine if the morning shift precipitation pattern shown in Busan was a general type due to city-specific characteristics or a special type due to climate change, daily variance of P(h) at each of the 6 different levels on the basis of 10-year units was compared and analyzed, as shown in Fig. 2.
Fig. 2 shows that every 10 years, daily variance patterns of P(h) have differed significantly according to PI(h). During the 1970s, precipitation of less than 10 mm/h was shown uniformly without a big difference over the hours, while precipitation over 10 mm/h had its maximum value at morning and afternoon respectively, showing no clear morning shift phenomenon as well as no significant difference of precipitation between morning and afternoon. Therefore, it cannot be
concluded that morning shift deepened according to precipitation intensity during the 1970s. During the 1980s, when the PI(h) was less than 10 mm/h, the morning shift phenomenon did not occur. However, the PI(h) which is over 10 mm/h was decreased in the late afternoon and increased in the morning compared to the 1970s.
In the 1990s, clear morning shift was revealed, showing high intensity of hourly precipitation in the morning, which was deepened in the 2000s. For hourly precipitation of less than 5 mm/h, no significant change in daily precipitation pattern was found.
Regarding precipitation over 10 mm/h, morning shift
was shown a little in the 1990s while it was not
clearly shown in the 2000s. Overall, the morning
hourly total precipitation of 10 mm/h or more : 18,698 mm
morning
hour 01 02 03 04 05 06 07 08 09 10 11 12 subtotal
hourly precipitation
(mm)
638 736 809 1087 1154 1002 1126 1104 933 909 1012 1128 11,638
ratio(%) 3 4 4 6 6 5 6 6 5 5 5 6 62
afternoon
hour 13 14 15 16 17 18 19 20 21 22 23 12 subtotal
hourly precipitation
(mm)
918 739 659 466 396 429 587 505 612 574 474 701 7,060
ratio(%) 5 4 4 2 2 2 3 3 3 3 3 4 38
Table 3. Comparison of the ratio and amount of hourly precipitation of 10mm or more in Busan during period from 1970 to 2009
hourly total precipitation of 30mm/h or more : 4071 mm
morning
hour 01 02 03 04 05 06 07 08 09 10 11 12 subtotal
hourly precipitation
(mm)
210 66.5 145 246 350 135 324 417 226 311 209 192 2831
ratio (%) 5 2 4 6 9 3 8 10 6 8 5 5 70
afternoon
hour 13 14 15 16 17 18 19 20 21 22 23 12 subtotal
hourly precipitation
(mm)
140 148 75 32.1 32.5 70.9 163 151 139 107 0 180 1240
ratio (%) 3 4 2 1 1 2 4 4 3 3 0 4 30
Table 4. Comparison of the ratio and amount of hourly precipitation of 30 mm or more in Busan during period from 1970 to 2009
shift phenomenon was not clearly revealed over 5 to 10 mm/h precipitation. However, for precipitation over 10 mm/h morning shift was well displayed, which was deepened as approached to the 2000s. Thus, a clear morning shift phenomenon developed in Busan from the 1980s to the 2000s, which had a high PI(h) of P(h) in the morning due to climate change.
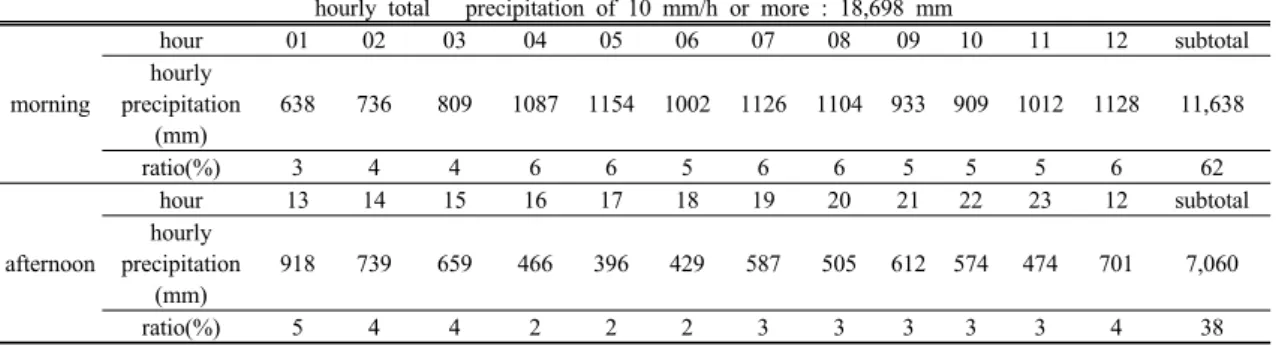
It was precipitation intensity over 10 mm/h when morning shift was found in the Busan region. Thus, we examined precipitation over 10 mm/h for the last 40 years. Table 3 shows P(h) per each hour and a ratio (%) of it to the hourly total precipitation from 1970 to 2009 using an integer unit. As shown on this table, the morning accounted for 62% of hourly total precipitation, which was 14% higher than that in the afternoon (48%), revealing that the higher the PI(h) was, the more precipitation was concentrated in the
morning. It also showed that precipitation was more concentrated in a time range of 04-05 KST (Korea standard time) and 07-08 KST, 12 KST, which was somewhat different from the DTP in Table 1.
Similarly, Table 4 shows a comparison of the ratio and amount of a P(h) of 30 mm or more, which revealed that precipitation in the morning accounted for 70% of the hourly total precipitation, indicating that the higher the PI(h) was, the more likely the morning shift phenomenon was to occur. As per that timeframe, severe rainstorms over 350 mm appeared at 05, 08 KST, while precipitation over 300 mm appeared at 05, 07-08, 10 KST, showing that precipitation was concentrated at 07-08 KST in the morning, as well as during the morning shift phenomenon.
Therefore, the daily variance pattern of precipitation
in Busan showed that the morning shift phenomenon
clearly occurred, and its trend increased with an increase in the PI(h). Moreover, because the P(h) was concentrated between 07-08 KST, weather disaster prevention authorities must take this fact into consideration. In particular, this time range is considered to be neglected for disaster prevention. Thus, more effort is needed during these hours to minimize the damage due to severe rainstorms.
3.2. Monthly variation of hourly precipitation As discussed in the previous section, the morning shift phenomenon in Busan appeared more frequently due to climate change, as the PI(h) was higher. It was expected to have clearer morning shift as approached to the summer season because the morning shift phenomenon appeared with climate change and higher hourly precipitation intensity. Thus, our study compared the daily variance patterns on a monthly basis from 1970 to 2009, which is shown in Fig. 3.
Fig. 3 shows that the daily variance of P(h) and the morning shift phenomenon were not clearly evident in April, May, and October. However, for the summer months of June to August, the morning shift phenomenon was evident. In particular, July and August, which are prone to more severe rainstorms, clearly presented the morning shift phenomenon. Moreover, in September, which has the characteristics of a summer month, the morning shift phenomenon occurred.
Therefore, the characteristics of daily variance in P(h), organized on a monthly basis, presented a clearer patterns in morning shift phenomena during the summer season, which had more severe rainstorms.
This, in turn, was due to the effects of climate change in Busan.
3.3. Annual variation of hourly precipitation The morning shift phenomenon of P(h) in Busan was more evident near and during the summer season and when the PI(h) was higher. Because P(h) was concentrated over the last few decades during 7:00 a.m. and 8:00 a.m., KST, we examined the P(h)
patterns in detail, looking for variations from 1970 to 2009. For example, to calculate the hourly total precipitation at 01 KST, all observed values of P(h) measured at that time during any given year were added together. Fig. 4 shows all the results for the recent 40 years.
As shown in Fig. 4, the annual variance of P(h) depended on the hours under study. That is, yearly variance of P(h) from 01 KST to 12 KST showed an increasing trend generally except for 03 KST, while a decreasing trend occurred from 13 KST to 24 KST, except at 13 KST, 14 KST and 20 KST. Generally, we estimated that P(h) increased in the morning and decreased in the afternoon, but this result is not conclusive in this study.
Precipitation phenomena can be classified into continuous rain (maintained for more than 60 minutes, due to the development and movement of the precipitation system), and intermittent rain, which stops within 60 minutes (Sumner, 1988). Thus, we also took spatial/temporal continuity into consideration.
Figs. 5 and 6 show timeframes of 3 and 12 hours of cumulative precipitation variation to minimize bias that may occur between the times.
As shown in Figs. 5 and 6, the morning timeframe revealed a significant increase, while the afternoon timeframe displayed a significant decrease. Thus, P(h) in Busan had a distinctive trend to increase in the morning, while having a distinctive trend to decrease in the afternoon, due to climate change.
Furthermore, to test the statistical significance of variations in precipitation during the morning and afternoon, an independent sample t-test was conducted with regard to the 3 and 12 hours of cumulative P(h).
The results showed that its significance probability
was 0.000, which indicated that the distinctively
increasing trend of precipitation in the morning
compared to that in the afternoon was statistically
meaningful, with significance level at 1% (refer to
Table 5).
April
Hour
4 8 12 16 20 24
Precipitation(mm)
0 100 200 300 400 500 600 700 800
900 May
Hour
4 8 12 16 20 24
Precipitation(mm)
0 100 200 300 400 500 600 700 800 900
June
Hour
4 8 12 16 20 24
Precipitation(mm)
0 100 200 300 400 500 600 700 800
900 July
Hour
4 8 12 16 20 24
Precipitation(mm)
0 100 200 300 400 500 600 700 800 900
August
Hour
4 8 12 16 20 24
Precipitation(mm)
0 100 200 300 400 500 600 700 800
900 September
Hour
4 8 12 16 20 24
Precipitation(mm)
0 100 200 300 400 500 600 700 800 900
October
Hour
4 8 12 16 20 24
Precipitation(mm)
0 100 200 300 400 500 600 700 800 900
Fig. 3. Diurnal variation of hourly precipitation of each month in Busan during period from 1970 to 2009.
0 1 h r
Y e a r
1 9 7 0 1 9 7 5 1 9 8 0 1 9 8 5 1 9 9 0 1 9 9 5 2 0 0 0 2 0 0 5
Precipitation(mm)
0 5 0 1 0 0 1 5 0 2 0 0
0 2 h r
Y e a r
1 9 7 0 1 9 7 5 1 9 8 0 1 9 8 5 1 9 9 0 1 9 9 5 2 0 0 0 2 0 0 5
Precipitation(mm)
0 5 0 1 0 0 1 5 0 2 0 0
0 3 h r
Y e a r
1 9 7 0 1 9 7 5 1 9 8 0 1 9 8 5 1 9 9 0 1 9 9 5 2 0 0 0 2 0 0 5
Precipitation(mm)
0 5 0 1 0 0 1 5 0 2 0 0
0 4 h r
Y e a r
1 9 7 0 1 9 7 5 1 9 8 0 1 9 8 5 1 9 9 0 1 9 9 5 2 0 0 0 2 0 0 5
Precipitation(mm)
0 5 0 1 0 0 1 5 0 2 0 0
0 5 h r
Y e a r
1 9 7 0 1 9 7 5 1 9 8 0 1 9 8 5 1 9 9 0 1 9 9 5 2 0 0 0 2 0 0 5
Precipitation(mm)
0 5 0 1 0 0 1 5 0 2 0 0
0 6 h r
Y e a r
1 9 7 0 1 9 7 5 1 9 8 0 1 9 8 5 1 9 9 0 1 9 9 5 2 0 0 0 2 0 0 5
Precipitation(mm)
0 5 0 1 0 0 1 5 0 2 0 0
0 7 h r
Y e a r
1 9 7 0 1 9 7 5 1 9 8 0 1 9 8 5 1 9 9 0 1 9 9 5 2 0 0 0 2 0 0 5
Precipitation(mm)
0 5 0 1 0 0 1 5 0 2 0 0
0 8 h r
Y e a r
1 9 7 0 1 9 7 5 1 9 8 0 1 9 8 5 1 9 9 0 1 9 9 5 2 0 0 0 2 0 0 5
Precipitation(mm)
0 5 0 1 0 0 1 5 0 2 0 0
0 9 h r
Y e a r
1 9 7 0 1 9 7 5 1 9 8 0 1 9 8 5 1 9 9 0 1 9 9 5 2 0 0 0 2 0 0 5
Precipitation(mm)
0 5 0 1 0 0 1 5 0 2 0 0
1 0 h r
Y e a r
1 9 7 0 1 9 7 5 1 9 8 0 1 9 8 5 1 9 9 0 1 9 9 5 2 0 0 0 2 0 0 5
Precipitation(mm)
0 5 0 1 0 0 1 5 0 2 0 0
1 1 h r
Y e a r
1 9 7 0 1 9 7 5 1 9 8 0 1 9 8 5 1 9 9 0 1 9 9 5 2 0 0 0 2 0 0 5
Precipitation(mm)
0 5 0 1 0 0 1 5 0 2 0 0
1 2 h r
Y e a r
1 9 7 0 1 9 7 5 1 9 8 0 1 9 8 5 1 9 9 0 1 9 9 5 2 0 0 0 2 0 0 5
Precipitation(mm)
0 5 0 1 0 0 1 5 0 2 0 0
1 3 h r
Y e a r
1 9 7 0 1 9 7 5 1 9 8 0 1 9 8 5 1 9 9 0 1 9 9 5 2 0 0 0 2 0 0 5
Precipitation(mm)
0 5 0 1 0 0 1 5 0 2 0 0
1 4 h r
Y e a r
1 9 7 0 1 9 7 5 1 9 8 0 1 9 8 5 1 9 9 0 1 9 9 5 2 0 0 0 2 0 0 5
Precipitation(mm)
0 5 0 1 0 0 1 5 0 2 0 0
1 5 h r
Y e a r
1 9 7 0 1 9 7 5 1 9 8 0 1 9 8 5 1 9 9 0 1 9 9 5 2 0 0 0 2 0 0 5
Precipitation(mm)
0 5 0 1 0 0 1 5 0 2 0 0
1 6 h r
Y e a r
1 9 7 0 1 9 7 5 1 9 8 0 1 9 8 5 1 9 9 0 1 9 9 5 2 0 0 0 2 0 0 5
Precipitation(mm)
0 5 0 1 0 0 1 5 0 2 0 0
1 7 h r
Y e a r
1 9 7 0 1 9 7 5 1 9 8 0 1 9 8 5 1 9 9 0 1 9 9 5 2 0 0 0 2 0 0 5
Precipitation(mm)
0 5 0 1 0 0 1 5 0 2 0 0
1 8 h r
Y e a r
1 9 7 0 1 9 7 5 1 9 8 0 1 9 8 5 1 9 9 0 1 9 9 5 2 0 0 0 2 0 0 5
Precipitation(mm)
0 5 0 1 0 0 1 5 0 2 0 0
1 9 h r
Y e a r
1 9 7 0 1 9 7 5 1 9 8 0 1 9 8 5 1 9 9 0 1 9 9 5 2 0 0 0 2 0 0 5
Precipitation(mm)
0 5 0 1 0 0 1 5 0 2 0 0
2 0 h r
Y e a r
1 9 7 0 1 9 7 5 1 9 8 0 1 9 8 5 1 9 9 0 1 9 9 5 2 0 0 0 2 0 0 5
Precipitation(mm)
0 5 0 1 0 0 1 5 0 2 0 0
2 1 h r
Y e a r
1 9 7 0 1 9 7 5 1 9 8 0 1 9 8 5 1 9 9 0 1 9 9 5 2 0 0 0 2 0 0 5
Precipitation(mm)
0 5 0 1 0 0 1 5 0 2 0 0
2 2 h r
Y e a r
1 9 7 0 1 9 7 5 1 9 8 0 1 9 8 5 1 9 9 0 1 9 9 5 2 0 0 0 2 0 0 5
Precipitation(mm)
0 5 0 1 0 0 1 5 0 2 0 0
2 3 h r
Y e a r
1 9 7 0 1 9 7 5 1 9 8 0 1 9 8 5 1 9 9 0 1 9 9 5 2 0 0 0 2 0 0 5
Precipitation(mm)
0 5 0 1 0 0 1 5 0 2 0 0
2 4 h r
Y e a r
1 9 7 0 1 9 7 5 1 9 8 0 1 9 8 5 1 9 9 0 1 9 9 5 2 0 0 0 2 0 0 5
Precipitation(mm)
0 5 0 1 0 0 1 5 0 2 0 0
Fig. 4. Time series of hourly precipitation variation in Busan during period from 1970 to 2009.
1~3hr
Year
1970 1975 1980 1985 1990 1995 2000 2005
Precipitation(mm)
0 100 200 300 400
500 4~6hr
Year
1970 1975 1980 1985 1990 1995 2000 2005
Precipitation(mm)
0 100 200 300 400 500
7~9hr
Year
1970 1975 1980 1985 1990 1995 2000 2005
Precipitation(mm)
0 100 200 300 400
500 10~12hr
Year
1970 1975 1980 1985 1990 1995 2000 2005
Precipitation(mm)
0 100 200 300 400 500
13~15hr
Year
1970 1975 1980 1985 1990 1995 2000 2005
Precipitation(mm)
0 100 200 300 400
500 16~18hr
Year
1970 1975 1980 1985 1990 1995 2000 2005
Precipitation(mm)
0 100 200 300 400 500
19~21hr
Year
1970 1975 1980 1985 1990 1995 2000 2005
Precipitation(mm)
0 100 200 300 400
500 22~24hr
Year
1970 1975 1980 1985 1990 1995 2000 2005
Precipitation(mm)
0 50 100 150 200 250 300
Fig. 5. Time series of 3 hour cumulative precipitation variation in Busan during period from 1970 to 2009.
time Mean (mm) SE (mm) t 3 hour cumulative
precipitation
morning 181.85 6.92 5.170**
(equal variance)
afternoon 139.38 4.41
12 hour cumulative precipitation
morning 727.40 44.87 3.273**
(equal variance)
afternoon 557.53 26.08
Table 5. Result from independent sample t-test on the comparison of variation of hourly precipitation every 3 hours and 12 hours in Busan during period from 1970 to 2009
Precipitation variation of A.M. and P.M. (1970~2009)
Year
1970 1975 1980 1985 1990 1995 2000 2005 0
200 400 600 800 1000 1200 1400 1600
A.M.
Trend line (A.M.) P.M.
Trend line (P.M.)
Fig. 6. Time series of 12 hour cumulative precipitation in Busan during period from 1970 to 2009.
Therefore, the daily variance of precipitation pattern in Busan showed a clear and continuous increase in precipitation and the frequency of the morning shift phenomenon from 1970 to 2009, while precipitation in the afternoon decreased in that timeframe. In summary, the morning shift phenomenon has occurred more frequently due to climate change.
3.4. Variance of precipitation pattern per weather station
According to previous studies (Park et al., 2013;
Seong, 2012) on the amount of precipitation, precipitation frequency, and precipitation intensity on the Korean Peninsula, the DTP in South Korea has increased in general from 1970 to 2009. The frequency of high levels of precipitation intensity has also increased, suggesting that climate change has affected the Korean Peninsula. We also discovered
this result when applying it to the specific context of Busan, showing that the P(h) in the morning increased continuously over that period, while continuously decreasing in the afternoon. This clearly indicates an increase in the morning shift phenomenon due to climate change.
Thus, we attempted to determine how this phenomenon affected the entire area in South Korea. Table 6 shows the ratio of a morning precipitation to DTP, the slopes of morning and afternoon precipitation trend lines, and the ratio of the slope between these trend lines at 26 weather stations in Korea, including Busan.
As shown in the table, morning precipitation constituted 50–58% of the DTP in the 26 weather stations from 1970 to 2009. Both the average and median values of the morning precipitation were 54%
of the DTP, indicating that most weather stations in the Korean Peninsula had a precipitation pattern where P(h) was concentrated in the morning rather than in the afternoon.
Furthermore, we developed a ratio of the P(h)
trend line slope between the morning and afternoon
(SM/SA) in the 26 weather stations in South Korea,
which indicated a proportional increase in morning
precipitation to afternoon precipitation. This also
showed that 14 of the 26 stations exceeded a ratio of
1.0, and the average and median values were 1.82
and 1.1, revealing that most regions in South Korea
experienced the morning shift phenomenon.
Items Sites
Ratio of precip.
in the morning (%)
Slope of trend curve of precip.
in the morning (SM)
Slope of trend curve of precip.
in the afternoon (SA)
Ratio of slope b/w in a.m. & in pm.
(SM/SA)
Buan 56 2.53 0.78 3.2
Busan 57 4.39 2.22 2.0
Cheongju 54 1.24 2.19 0.6
Chuncheon 54 3.22 2.4 1.3
Chupungnyeong 50 2.39 1.43 1.7
Daegu 52 0.56 1.87 0.3
Daejeon 52 3.41 1.26 2.7
Gangneung 50 2.9 5.0 0.6
Gwangju 53 0.86 1.94 0.4
Imsil 53 1.25 2.24 0.6
Incheon 57 1.51 4.05 0.4
Jeju 57 2.03 1.13 1.8
Jeongeup 52 2.1 1.52 1.4
Jeonju 52 1.56 2.03 0.8
Jinju 54 1.03 0.14 7.4
Mokpo 56 0.61 2.33 0.3
Pohang 53 2.2 2.59 0.8
Seogwipo 55 4.35 0.44 9.9
Seosan 58 0.99 2.42 0.4
Seoul 55 2.7 5.54 0.5
Sokcho 52 3.45 3.27 1.1
Suwon 54 1.14 2.94 0.4
Tongyeong 57 3.9 1.1 3.5
Ulneungdo 53 6.45 5.64 1.1
Ulsan 54 1.78 1.18 1.5
Yeosu 56 2.1 0.78 2.7
Average 54 2.33 2.25 1.82
Median 54 2.1 2.11 1.1
Table 6. The ratio of a morning precipitation to daily total precipitation and the gradient of morning and afternoon precipitation trend and their ratio at 26 weather station in Korea (1970-2009)