Task-specific Noise Exposure Assessment of Firefighters
Taesun Kang
†Department of Health and Safety Engineering, Semyung University
ABSTRACT
Objectives: The main purpose of this study was to assess firefighters’ daily personal noise exposure and explore noise levels related to specific tasks and their contributions to total noise exposure using 24-hour full-shift noise exposure measurements with task-based data.
Methods: Noise exposure was assessed for eight firefighters (two rescuers, two drivers, and four suppressors) using time-activity diaries. We collected a total of 24 full-shift personal noise sample sets (three samples per a firefighter). The 24-hour shift-adjusted daily personal noise exposure level (Lep,d), eight weekly personal noise exposures (Leq,w), and 40 task-specific Leq values (Leq activity) were calculated via the ISO/NIOSH method.
Results: The firefighter noise-sample datasets showed that most firefighters are exposed to noise levels above EU recommended levels at a low-action value. The highest noise exposure was for rescuers, followed by drivers and suppressors. Noise measurements with time-at-task information revealed that 82.3% of noise exposure occurred when checking equipment and responding to fire or emergency calls.
Conclusions: The results indicate that firefighters are at risk of noise-induced hearing loss. Therefore, efforts at noise-control are necessary for their protection. This task-specific noise exposure assessment also shows that protective measures should be focused on certain tasks, such as checking and testing equipment.
Key words: Firefighter, noise exposure, task-specific
I. Introduction
Firefighters are usually exposed to short-term, intermittent, and high-intensity noise, unlike the continuous noise levels to which workers in manu- facturing and other workplaces are exposed. Noise- induced hearing loss (NIHL) is among the most underestimated health problems affecting firefight- ers. Previous research has shown that the firefight- ers’ hearing threshold levels decline faster during their careers compared with general population.
1-6)Collecting noise-exposure data in firefighters’
workplaces is apparently difficult and dangerous because of the unpredictable locations and the dan- gerous and rapidly changing environment. Therefore
many previous studies used short period noise mea- surements for noisy work activities, full-shift mea- surements have rarely been carried out, and those that have been conducted were limited in North America and in South Korea. Researches by the National Institute for Occupational Safety and Health (NIOSH) revealed that although firefighters were only intermittently exposed to peak noise lev- els during emergency responses, when noise expo- sure levels were calculated by time-weighting over working shifts, they were lower than recommended occupational exposure limit.
7-9)However, further research on firefighters’ noise exposure has been minimal.
Contrary to expectations, recent studies reported
†Corresponding author: Department of Health and Safety Engineering, Semyung University, 65 Semyung-Ro, Jecheon, Chungbuk, 27136, Korea, Tel: 82-43-649-1692, E-mail: [email protected]
Received: 22 September 2019, Revised: 18 October 2019, Accepted: 28 October 2019 원 저 Original articles
that shift-adjusted noise exposure levels are signifi- cantly higher than those measured previously by the NIOSH, which rarely exceeded 85 dBA.
10,11)These studies showed that some tasks were related to noise levels high enough to produce a risk of NIHL from chronic exposure, although some studies that predicted 24-h exposures reported substantial impre- cision.
11)Studies exploring noise exposure among firefight- ers in Asia are scarce.
12,13)Particularly, measure- ments of noise exposure level with time and task information are needed because firefighters are exposed to intermittently high noise levels, and weekly noise exposure samplings are recommended for occupations where noise exposure varies highly daily.
14,15)Therefore, the purpose of this study was to eval- uate firefighters’ daily personal noise exposure and investigate the noise levels associated with specific tasks and their contributions to total noise exposure, using 24-hr full-shift noise-exposure assessments with task-based information.
II. Materials and Methods
1. Task-based noise exposure measurement Personal noise samples were collected in 2 depart- ments in September 2010 and September 2011.
Firefighter jobs are commonly classified as suppres- sor, rescuer, driver, paramedic, and supervisory.
Their main duties of 5 jobs are, respectively, to extinguish fire, rescue people, drive fire trucks, con- duct first aid, and perform supervision. Four fire- fighters from each department comprising 2 suppressors, 1 rescuer, and 1 driver, totaling to 8 firefighters, were included in this study. Two of the four sup- pressors were investigators, who generally have more than 10 years of experience as a suppressor.
Paramedic firefighters were excluded because the dosimeter set hindered their work, which may inter- fere with obtaining the noise samples. Sampling was conducted for three duty cycles (24 hr) per sub-
ject. A total of 24 samples were collected; 6 from two rescuers, 6 from two drivers, and 12 from 4 suppressors, including 2 investigators. Firefighters wore data-logging noise dosimeters (model 706 RC;
Larson Davis, UT, USA) thrice (24-hr shift) over a week (alternating 24-hr shifts are the most common schedule for field personnel). The sampling period started from September 2010 to September 2011.
Basic data used in this study were 1-min sound pressure levels (1-min L
eq) (dB) recorded using the standard suggested in the ISO/NIOSH: 3-dB exchange rate and “A” frequency weighting. During the measurement, the firefighters were required to complete a time-activity diary (TAD), where they recorded their area and activities. Data including the above information were downloaded to software program (Blaze; Larson Davis, Provo, UT, USA) and exported to Excel 2007 (Microsoft, Redmond, WA,USA) to calculate the noise exposure level descriptor. Full-shift noise exposure levels were expressed with L
ep,dshift-adjusted daily personal noise exposure level. The L
ep,dis normalized to 8 hours, also known as Lex, 8 hr in ISO/NIOSH, which can be calculated with the following Equa- tion (1):
15,16), (1)
where T
eis the effective duration in hours (approx- imately 24 hours in this study), and T
0is the stan- dard duration (8 hour). The weekly personal noise exposure, L
ep,w, for a firefighter was calculated with Eq. (1) for a week long working hour (maximum 72 hrs). Thus, 8 L
ep,wwith 24 L
ep,dwere collected.
Activity information from TAD was categorized into five major activities, namely, call, checking, fire officework, waiting, and others. The TADs were checked every day. In task based occupational noise exposure studies, TAD has generally shown agree- ment with researcher observation.
17)Approximately 1,456 measurements, taken every minute for a 24 hr-shift, were recorded via real-time monitoring. To
Lep d, =Leq T, e 10log Te T0 ---
⎝ ⎠⎛ ⎞ +
produce the noise levels of the specific tasks, the information data of the TAD and their correspond- ing 1-min L
eqdata were combined for each fire- fighter, and task-specific L
eq(L
eq activity) for each firefighter were determined using Eq. (2) as follows:
, (2)
In this equation, n
ijis the number of minutes that a firefighter i perform activity j, and L
eq ijkis the sound pressure level (SPL) recorded for firefighter i do activity j during a 1-min noise interval k. The activity-specific L
eqs were aggregated to calculate the mean L
eqfor each firefighter’s activity.
The effect of total noise exposure levels in each activity was calculated according to sound exposure (SE; pa
2hr), which can be expressed with Equation (3) as follows:
18), (3) In this equation, T is the time of specific activity in hours, and i and j are similar to Eq. (1).
2. Data analysis
Descriptive statistics were used to demonstrate the results of the firefighters’ noise exposure levels and characteristics (time spent during specific activity).
Data were estimated for normality. The noise levels (L
ep,d, L
ep,w) were normally distributed according to the Shapiro-Wilk test (p>0.05), so arithmetic means and standard deviations were used to describe the
variation and central tendency of each main role.
The same statistics were used to describe noise exposure level (L
eq activity, SE
activity) and time spent in each activity for a consecutive 3-day shift per sub- ject, although it cannot be tested for normality because of the small sample size (2 subjects per main roles). ANOVA test was performed to com- pare L
ep,damong the main roles of the firefighters.
Student’s t-test was adopted to compare L
ep,dbetween two stations, and paired t-test by pairing noise level data at each main role was conducted to control the dependency of the main role. The paired t-test was also used to evaluate the differ- ences between averages of L
ep,dand L
ep,wof each firefighter. SAS version 9.3 (SAS Institute Inc, NC, USA) was used for all statistical analyses. The methods of personal noise sampling are illustrated in more detail elsewhere.
19)III. Results
1. Firefighters’ noise exposure level
Noise data were collected for eight firefighters in three roles (rescuers, drivers, and suppressors). The average age and years of service for the eight fire- fighters were approximately 39 years and 11.5 years, respectively. We sampled total of 24 valid full-shift personal noise sample (three samples per subject). Each firefighter’s daily noise exposure level, “L
ep,d”, was calculated with Eq. (1), and a summary of the findings is showed in Table 1. As shown in Table 1, the total noise exposure level
LeqActivityij 10log101nij
--- 10Leqijk⁄10
k 1∑=
=
Pa p
hr Pa T
p
SE ref
T Leq ref ij
ij Activityij
µ 20 ,
10 )
( 10 2
,
Activity= 2 × =
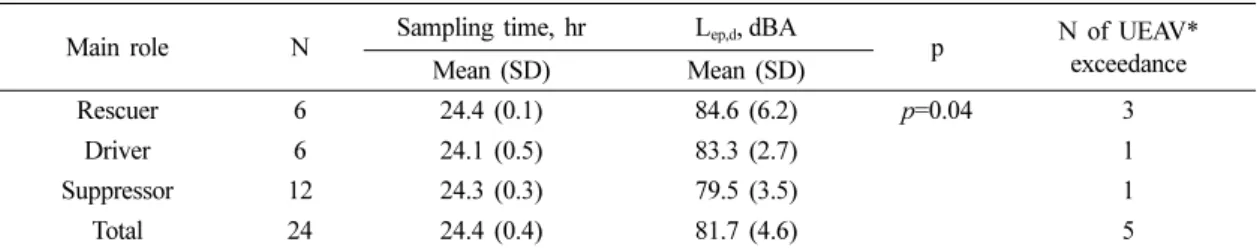
Table 1. Daily firefighters’ personal noise exposure level (dBA) according to their main role
Main role N Sampling time, hr Lep,d,dBA
p N of UEAV*
exceedance
Mean (SD) Mean (SD)
Rescuer 6 24.4 (0.1) 84.6 (6.2) p=0.04 3
Driver 6 24.1 (0.5) 83.3 (2.7) 1
Suppressor 12 24.3 (0.3) 79.5 (3.5) 1
Total 24 24.4 (0.4) 81.7 (4.6) 5
*UEAV, Upper limit of exposure action value (Lep,d=85 dBA) in The Control of Noise at Work Regulations UK 2005; SD, standard deviation
was 81.7 dBA, ranging from 70.6 to 94.8 dBA. The highest noise exposure level was for the rescuer (84.6 dBA), and the next was for the driver (83.3 dBA), followed by suppressor (79.5 dBA). One-way ANOVA showed a significant difference in noise exposure levels among the firefighters (p=0.04). By contrast, no significant difference in noise exposure levels was noted among fire departments as ana- lyzed with the t-test and paired t-test (p=0.87, p=
0.88). Of the 24 samples, five (20.8%) showed lev- els of noise exposure greater than L
ep,d=85 dBA, which is the upper limit of exposure action value (UEAV) in the UK and is the same for South Korea. Three of the six (50%) datasets from rescu- ers revealed values above the UEAV.
2. Task-specific noise exposure of firefighters Table 2 showed detailed information on the fire- fighters’ weekly activities and personal noise-expo- sure levels. In total, recordings were produced for 35,148 min (101.7%) of 34,560 min of work for eight firefighters (3 days of 24-h shift per fire- fighter). With dosimetry, noise levels (35,148 1 min- L
eq), 8 L
ep,w, and 40 task-specific L
eqvalues (L
eq,activity
) for five categories of tasks from the eight subjects were calculated.
The L
ep,wranged from 78.7 to 91.3 dBA, with a mean of 82.4 dBA (standard deviation, SD=4.2).
The arithmetic mean of L
ep,wwas higher than that of L
ep,d(81.7 dBA; p=0.025), and the variability of L
ep,wwas lower than that of L
ep,d(SD=4.6). The rescuer was exposed to the highest arithmetic mean level of weekly noise (85.5 dBA), which was fol- lowed by the driver (83.8 dBA) and the next was suppressor (80.2 dBA). When suppressors were clas- sified into two groups according to activity, namely, normal investigator and suppressor, investigators were exposed to lower noise (79.3 vs. 81.2 dBA).
The five main activities of firefighters took place in the dispatched field or at the station. They spent the biggest percentage of time in the fire station (88.8%) doing tasks like waiting (44.1%), working
in the fire office (31.8%), checking fire equipment (5.3%), and others (7.6%). The firefighters’ time spent on call was significantly smaller than time spent at the fire station (11.2%), but the mean L
eqfor response to emergency call (84.1 dBA) was higher than that in the fire station (73.3 dBA). The average contribution of SE on calls to total SE was comparably similar to that for the ratio of time at the fire station because SE is a function of L
eqand time spent as presented in Equation (3). The highest overall average L
eqwas monitored in checking equipment (86 dBA), followed by performing call- ing regarding an emergency (84.1 dBA), other activ- ities including dining and exercising (74.5 dBA), working in the fire office (69.6 dBA), and waiting in the break room (63.3 dBA; p<0.001). In terms of SE considering L
eq activityand exposure time, the mean contribution of the activity of responding to calls was the largest (45.6%), followed by checking equipment (36.7%). And working in the fire office, other activities and waiting in the break room con- tribute small portion of the total SE (7.5, 5.1, 5.0%, respectively). Checking equipment occupied the largest portion of SE (45.6%), though it has the small portion of time spent (5.3%), and the SE of being on emergency call to total SE was 45.6%
during a comparably short period (11.2%). Checking
equipment and response to calls occupied most of
the SE (82.3%). Waiting in the fire station break
room, in the main at night, account for the largest
portion of time (44.1%), but the SE was small
(5.7%). During periods between emergency call
responses mainly in the daytime, the time spent
working in the fire office occupied 31.8% of
weekly working hours, but the average ratio of SE
to overall exposure was 7.5%. Rescuers had the
highest noise exposure during checking of equip-
ment, including pneumatic chisels, powered saws
and hydraulic spreaders, which was more than half
of their overall noise exposure (SE), though com-
prising only approximately 2% out of their total
work time. Rescuers spent more time on emergency
Table 2. Weekly firefighters’ personal noise exposure with task-specific level Main role of firefighterN TotalCallFire station CheckingWorking in officeWaitingOthers TimeNoiseTimeNoiseTimeNoiseTimeNoiseTimeNoiseTimeNoise Mean of Hours (SD)
Mean Of Lep,w*, dBA (SD)
Mean of % total time (SD)
Mean of Leq, dBA (SD)
Mean of % total SE (SD)
Mean of % total time (SD)
Mean of Leq, dBA (SD)
Mean of % total SE (SD)
Mean of % total time (SD)
Mean of Leq, dBA (SD)
Mean of % total SE (SD)
Mean of % total time (SD)
Mean of Leq, dBA (SD)
Mean of % total SE (SD)
Mean of % total time (SD)
Mean of Leq, dBA (SD)
Mean of % total SE (SD) Rescuer274.2 (2.5)85.5 (8.1)22.1 (12.8)82.2 (4.7)42.8 (45.6)3.5 (2.1)91.4 (16.2)52.1 (51.5)34.4 (16.9)67.1 (2.2)1.6 (1.2)33.3 (2.0)62.0 (1.4)1.0 (1.3)6.6 (3.9)73.7 (2.5)2.4 (3.0) Driver273.2 (0.8)83.8 (2.1)7.0 (4.4)88.3 (1.4)53.9 (7.7)11.6 (8.5)84.8 (6.3)37.9 (5.7)25.1 (7.7)69.9 (3.0)3.3 (1.6)44.8 (9.3)64.1 (1.0)1.7 (1.4)11.5 (5.7)73.3 (2.3)3.1 (1.7) Suppressor273.2 (0.3)81.2 (2.1)9.0 (3.3)81.0 (2.0)26.0 (9.4)3.9 (1.2)87.1 (1.4)45.5 (7.7)19.9 (4.3)71.9 (4.0)7.7 (4.7)59.2 (10.1)65.2 (7.7)12.8 (17.0)8.0 (1.3)76.1 (1.5)8.1 (4.9) Investigator272.4 (1.5)79.3 (0.9)6.9 (5.7)84.8 (3.4)60.0 (2.4)2.3 (0.5)80.5 (2.5)11.4 (7.8)47.6 (3.6)69.9 (2.6)17.6 (8.1)38.9 (14.4)62.9 (4.6)4.6 (5.3)4.3 (4.6)76.0 (1.5)6.5 (7.4) Overall873.2 (1.3)82.4 (4.2)11.2 (8.8)84.1 (3.8)45.6 (22.6)
5.3 (5.2)86.0 (7.9)36.7 (25.9)31.8 (13.4)69.6 (3.0)7.5 (7.6)44.1 (12.8)63.3 (3.5)5.0 (8.4)7.6 (4.2)74.5 (2.4)5.1 (4.4) 88.8† (8.8)73.3† (2.5)54.4† (22.7) N, number of firefighters who participated in noise sampling; SE, sound exposure (Pa2hr) *Weekly personal noise exposure with logarithmic averaging of 3 Lep,d of a firefighter. †Total noise exposure while in the station including checking equipment, staying in the office, waiting, and others (e.g., cafeteria)
J Environ Health Sci 2019; 45(6): 569-576 http://www.kseh.org/
responses than drivers and suppressors because emergency calls for rescues were much more fre- quent than calls for fires.
20)Drivers were exposed to a mean L
eqof 88.3 dBA on response to calls and driving, which was 53.9% of their total SE, despite that this activity consumed only approxi- mately 7% of their total work time. Drivers spent more time to check equipment compared with fire- fighters with any other role because it took more time checking the vehicles than checking any other equipment.
IV. Discussion
The results of this study demonstrates that most firefighters were exposed to noise level above EU recommended level of a low-action value, L
ep,d=80 dBA, which means that they are at risk of devel- oping NIHL and indicates the need for noise-control efforts. Noise measurements were connected to time-at-task information to express noise exposure, which reported that 82.3% of SE occurred when checking equipment and responding to emergency or fire calls.
The average shift-adjusted daily firefighter’s noise exposure level in this study was similar to that reported by Kirkham et al. (2011), who studied Canadian firefighters (L
ep,d=81.7±4.6 vs. 82.9±4.4 dBA). They reported that firefighters’ noise expo- sure levels did not vary considerably according to job title, but were significantly different in supervi- sory compared with non-supervisory firefighters. We sampled only non-supervisory firefighters, and dif- ferent to Kirkham et al.
10), we found that noise exposure levels differed significantly according to job title. Kirkham et al. proposed that control should focus on the activities to check hand tools or SCBA for short term, which was scientifically reconfirmed by the analysis of task-specific noise exposure levels in our study.
Full-shift firefighter’s noise exposure assessment
by task-specific was first begun by Neitzel et al. to develop task-based approach for firefighting opera- tions. They measured noise levels and time spent per each task in a 24-h shift. Their measurements were similar to ours in the ways of time spent (call time: station time=9.8%: 90.2% vs. 11.2%: 88.8%), but showed slight differences in noise doses for task (call: station=67%: 33% vs. 45.6%: 54.4%). In this study, the highest proportion of noise exposure (SE) was during checking equipment at the station.
Meanwhile, the average 24-h firefighter’s noise exposure level (L
eq 24r=84.5±2.4) was considerably higher in Neitzel et al.’s study (2012)
11)than in ours (L
eq 24hr=77.0±4.6); all (5/5) of their results were higher than the NIOSH REL criteria (L
eq 24hr=80.25) compared to 21% (5/24) in our results. It is spec- ulated that US fire truck dispatch noise is greater than ours, and further research is needed. Our results indicate how effective noise control can be implemented in the field. For example, as an inter- vention, if rescuers were provided with ear plug and they used them for even approximately 50 min during checking equipment, over 50% of the noise dose (SE) would be avoided. Previous studies have documented similar results,
10)but the current study provides the first quantitative data with SE. Full- shift noise exposure assessments with task-based information are hard to conduct but can provide valuable information for controlling noise, particu- larly in jobs characterized by high variability and intermittency, such as firefighting.
This exposure assessment study has some limita-
tions. The main thing is the small sample size,
which restricts the generalizability of the results. In
future studies, the sample size needs to be larger
and paramedics and supervisory firefighters should
be included. The exposure data reported in this
paper were obtained from a few fire departments in
the Seoul area. Thus, the findings may not be appli-
cable to other fire departments in different regions
of South Korea.
V. Conclusions
The results of our study showed that firefighters are at a risk of NIHL, and thus, interventions are needed. This task-specific noise exposure character- ization also indicated that control measures should be made to reduce noise exposure occurring when firefighters are checking equipment and responding to emergency calls.
Acknowledgment
This research was supported by the Basic Science Research Program through the National Research Foundation of Korea funded by the Ministry of Education, Science and Technology (No. 2011- 0002926). We appreciate the assistance of the Fire Science Research Center of Seoul Metropolitan Fire Service Academy.
References
1. Reischl U, Bair HS, Reischl P. Fire fighter noise exposure. American Industrial Hygiene Association Journal. 1979; 40(6): 482-489.
2. Reischl U, Thrift GH, Reischl P. Occupation related fire fighter hearing loss. American Industrial Hygiene Association Journal. 1981; 42(9): 656-662.
3. Kales SN, Freyman RL, Hill JM, Polyhronopoulos GN, Aldrich JM, Christiani DC. Firefighters’ hear- ing: a comparison with population databases from the International Standards Organization. Journal of Occupational and Environmental Medicine. 2001;
43(7): 650-656.
4. Hong O, Samo DG. Hazardous decibels: hearing health of firefighters. AAOHN journal: official jour- nal of the American Association of Occupational Health Nurses. 2007; 55(8): 313.
5. Ide CW. Hearing losses in wholetime firefighters occurring early in their careers. Occup Med. 2011;
61(7): 509-511.
6. Kang TS, Hong OS, Kim KS, Yoon CS. Hearing among male firefighters: a comparison with hear- ing data from screened and unscreened male popu- lation. Journal of Exposure Science and Environmental Epidemiology. 2015; 25(1): 106.
7. Tubbs R. Health hazard evaluation: Memphis Fire Department, Memphis, Tennessee. 1990 Contract No.: 86-138.
8. Tubbs R. Evaluating risk of noise induced hearing loss for firefighters in a metropolitan area (Publica- tion No. 88-0290-2460). Cincinnati, Ohio: National Institute for Occupational Safety and Health, 1994 Contract No.: 88-0290-2460.
9. Tubbs R. Evaluating Risk of Noise Induced Hear- ing Loss for Fire Fighters (Publication No. 89- 0026-2495). Cincinnati, Ohio: National Institute for Occupational Safety and Health; 1995.
10. Kirkham TL, Koehoorn MW, Davies H, Demers PA. Characterization of Noise and Carbon Monox- ide Exposures among Professional Firefighters in British Columbia. Annals of Occupational Hygiene.
2011; 55(7): 764-774.
11. Neitzel RL, Hong O, Quinlan P, Hulea R. Pilot task-based assessment of noise levels among fire- fighters. International Journal of Industrial Ergo- nomics. 2013; 43(6): 479-486.
12. Chung I, Chu IM, Cullen MR. Hearing effects from intermittent and continuous noise exposure in a study of Korean factory workers and firefighters.
BMC Public Health. 2012; 12(1): 87.
13. Lim-kyu L, Tae Sun K, Seung Hon H, Jung In K, Young Suk Y, Chung Sik Y. Noise Exposure according to the Time Activity Pattern and Duties of Firefighters. Korean Journal of Environmental Health. 2011; 37(2): 94-101.
14. European Union. Directive 2003/10/EC of the Euro- pean Parliament and of the Council of 6 February 2003 on the minimum health and safety require- ments regarding the exposure of workers to the risks arising from physical agents (noise). Official Journal of the European Union L42, 15/02/
20032003. p. 38-44.
15. Health and Safety Executive. Controlling Noise at Work: The Control of Noise at Work Regulations 2005, Guidance on Regulations. London, UK:
Health and Safety Executive; 2005.
16. International Organization for Standardization.
Acoustics: Determination of Occupational Noise Exposure and Estimation of Noise-induced Hearing Impairment-International Standard ISO 1999. Sec- ond ed. Geneva, Switzerland: ISO; 1990.
17. Neitzel R, Daniell W, Sheppard L, Davies H, Seixas N. Evaluation and comparison of three exposure assessment techniques. Journal of occupational and environmental hygiene. 2011; 8(5): 310-323.
18. W.Alberti P. The Pathophysiology of the ear. In:
J Environ Health Sci 2019; 45(6): 569-576 http://www.kseh.org/
Goelzer B, Hansen CH, Sehrndt GA, editors. Occu- pational exposure to noise: Evaluation, prevention and control. Dortmund, Germany: Federal Institute for Occupational Safety and Health (BAuA); 2001.
p. 49.
19. Kang T-S, Lee L-K, Kang S-C, Park D-U, Kim R- H, Yoon C-S. Assessment of noise measurements made with a continuous monitoring in time. The Journal of the Acoustical Society of America. 2013;
134(1): 822-921.
20. The National Emergency Management Agency. The Main Statistics of Korea NEMA. In: The National Emergency Management Agency, editor. 2012.
<저자정보>
강태선(교수)