GEOLOGICAL AGE AND THICKNESS ESTIMATION OF LAVA AT MARE CRISIUM BY LUNAR SURFACE GIS
Yoriko Kazama
1)and Tsuneo Matsunaga
2)1) Hitachi, Ltd., Central Research Laboratory, 2) National Institute for Environmental Studies, Japan 1-280 Higashi-Koigakubo, Kokubunji-shi, Tokyo 185-8601, Japan
ABSTRACT: SELENE, a Japanese lunar mission, has been launched this year. There are large volumes of images that were already archived and will be archived by missions such as SELENE. Automatic image analysis systems, which extract useful information from large amounts of data, are now required. The authors propose Lunar Surface GIS, which archives lunar surface information collected by lunar orbiting spacecraft and conducts geological analysis automatically.
This system includes automatic crater detection, automatic age determination, and lava thickness estimation methods. In this paper, methods for automatically determining the age and estimating the lava thickness of lunar mare are described.
The lunar surface age was determined by analyzing data of detected crater size and number using a crater chronology method. Lava thickness was estimated by the extent of the overlying material around the crater as well as the composition of underlying terrain units. In this result, the age map at Mare Crisium suggests the mare had been formed 3.0 – 3.7 b.y. ago. The lava thickness result suggests the thickest part of the mare is distributed around the center of the mare. The Lunar Surface GIS can produce a geological map, age map, and mare lava thickness map, for example.
KEY WORDS: SELENE, crater, crater chronology
1. INTRODUCTION 1.1 Background
SELENE, a Japanese lunar orbitering spacecraft was launched on Sep 14, 2007 [SELENE Project]. The name stands for Selenological and Engineering Explorer. The mission aims to map the lunar surface and study lunar origins and evolution. SELENE has various sensors, so it is expected to acquire a lot of lunar surface data. In addition, other space missions such as the Indian Chandrayaan-1 and Chinese Chang’e-1 are planned; the day we treat huge amounts of lunar and space data is coming in the near future. Hence, the amount of observed data will continue to grow. Therefore, automatic image and data analysis systems, which can extract useful information from that large data, are required now.
The surface of the moon is heavily cratered. Most lunar craters originated from the impact of projectiles. Impact craters are the remains of collisions of an asteroid, comet, or meteorite on the moon. The well-investigated size-frequency distributions (SFD) of lunar craters are useful to estimate the SFD of projectiles which formed craters on terrestrial planets and on asteroids. Projectiles hit the moon and excavate the underlying terrain materials. Therefore, craters have important geological information, and craters can offer clues to learn about lunar origins and evolution.
The authors developed the Lunar Surface GIS (Geographical Information System), which treats crater information as the key to geological analysis. The Lunar Surface GIS has a lot of functions to analyze satellite imagery. The crater detection algorithm was developed as the basis of this system [Sawabe et al 2005a, Sawabe et al 2006]. The detection algorithm achieved high accuracy in
detecting craters using many kinds of images, such as Apollo photos, Lunar-Orbiter and Clementine images. In this paper, automatic geological mapping, geological age estimation, and lava thickness estimation are described.
2. METHODOLOGY 2.1 Lunar Surface GIS overview
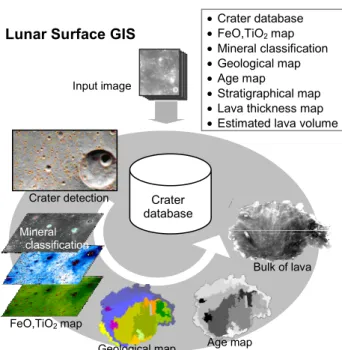
The concept of Lunar Surface GIS is shown in Figure 1.
The first step in developing this system is making a database and a lot of analysis functions. The main function of this system is automatic crater detection (MARC method [Sawabe et al 2005a, Sawabe et al 2006]). The database of craters detected by the MARC method is the center of the Lunar Surface GIS. In the next step of the development process, maps of FeO, TiO2, mineral classification, geology, geological age, lava thickness, and estimated lava volume are made. By integrating all this information, we can make assumptions about when, where, and how much of the lava effused out of the mare. That could solve the mystery of the origin and evolutionary process of the moon. When images are input into this system, a lot of geological information is estimated automatically, and these results could be displayed as 2D and 3D images.
2.2 Geological classification and lava age estimation In this paper, geological age means how long ago lava effused from beneath the lunar mare. About 17% of the lunar surface has been covered with lunar mare lava.
Mare lava has been formed preferentially on the lunar nearside, and its presence on planetary surfaces is indicative of thermal activity and volcanic evolution of the planetary body.
The estimation of the age of lava was based on a classification of geological units by an automatic geological classification method [Sawabe et al. 2005b].
The flowchart of this classification method is shown inFigure 2. The geological map was compiled from FeO and TiO2 contents, OMAT (matured index) [Luney et al.
1998], and albedo data. The minimum geological area, considered as the minimum error estimated using the crater chronology, was decided to be 2,000 km2.
After making a geological map, the geological age was estimated from the SFD at each geological unit (Figure 3).
The size and number of craters were detected by the MARC method, and this distribution was approximated by equation (1) [Neukum and Ivanov 1994].
11 11
2 2 1
0 log (log ) (log )
logN=a +a D+a D +L+a D (1) where N = cumulative number of craters
D = diameter of crater.
Using the crater production rate in equation (2) [Neukum and Ivanov 1994] and crater density, the geological age could be estimated. This equation was determined by sample-return data of Apollo and LUNA.
T T
N(1)=5.44×10⁻¹⁴{exp(6.93 )−1}+8.38×10⁻⁴ (2) where
N(1) = cumulative number of craters (diameter > 1 km) T = age [b.y.]
Then, the geological age map could be estimated. The concentration of compounds such as FeO and TiO2, and the geological age are easily displayed in this map.
Figure 1. Concept of Lunar Surface GIS.
Figure 2. Flowchart of geological map development.
Figure 3. Flowchart of Lunar Surface GIS 2.3 Automatic lava thickness estimation
The lava thickness could indicate the lava volume, so we assumed the scale of lunar magmatism. In this paper, the lava thickness is estimated using the mechanism of crater formation.
In the “simple crater”, that is, lunar craters whose diameter is less than 14 km, there is a relationship between the excavated depth and the annular distance from the crater rim of surrounding material. The lava thicknesses in mare have been determined using assumptions about the topography of partly buried craters [Budney and Lucey 1998]. Highland material is sometimes excavated from below the mare cover to form craters from the mare. Here, the differences between mare and highland materials were determined by the amount of FeO.
3. RESULTS 3.1 Data and area
In this paper, Clementine UVVIS images were used.
Clementine was launched in 1994 by NASA, and the UVVIS sensor had five bands (415 nm, 750 nm, 900 nm, 950 nm, 1000 nm). The spatial resolution of the images was 100 m.
Input image Crater detection Geological mapping
Age estimation Lava thickness
Geological map Age map Stratigraphic map Input image
Resampling FeO, TiO2, Parameter
Classification Labelling
Geology map Threshold
Large crater information Crater extraction Highland masking
Small area?
Connecting Yes
No
Crater database
• Crater database
• FeO,TiO2 map
• Mineral classification
• Geological map
• Age map
• Stratigraphical map
• Lava thickness map
• Estimated lava volume Lunar Surface GIS
Age map FeO,TiO2 map
Mineral classification
Input image
Bulk of lava
Geological map Crater detection
We focused on Mare Crisium, which is located in the north-east area of the near side (17.5°N, 58.5°E). The diameter is about 540 km. The mosaiced image of Mare Crisium is shown in Figure 4.
Figure 4. Mare Crisium (Clementine UVVIS image)
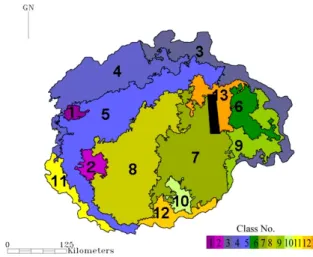
Figure 5. Geological map of Mare Crisium. (black areas indicate lack of data)
3.2 Age map
The geological map automatically estimated by the Lunar Surface GIS is shown in Figure 5. This mare was classified into 13 units. The result matched well with previous geological maps such as Kodama [2003].
Subsequently, the age of each unit was estimated using crater information extracted from the crater database using the crater chronology method (Eq. (1) (2)). The age map is shown in Figure 6. As shown in this geological age map, the central area was made by younger lava and the youngest lava effused above the mare’s ring.
In the south-east of Mare Crisium (in Figure 4), LUNA-24 landed and returned to the earth with gathered samples. The age of the samples was calculated to be about 2.50 – 3.75 b.y. ago [Boyce et al. 1977]. This age agreed well with the age of our result: 3.29 b.y. ago.
From these results, in the first lava effusion stage, there were a lot of radioactive elements with a high content.
The magma was melted by this decay heat, and there was
a large amount of melting lava that filled the mare. This lava contained higher content of Fe and Ti than those of the highland below the mare, and the specific gravity of the mare was also higher. As a result, the center of the mare sank. In the next stage, the lava effused to the central area due to its low viscosity.
The relationship between age and amounts of FeO and TiO2 is determined by the depth of the melted lava and the solidification speed. Therefore, knowing the content and age of TiO2 is important for understanding the vertically structured upper mantle. Relationships between ages and weight percentages of compounds of the lava are shown in Figure 7. This figure suggests that older lava contained a variety of TiO2 and FeO weight percentages, and younger lava contained only high weight percentages of TiO2 and FeO. The age between younger and older lava is approximately 3.4 – 3.5 b.y.
Figure 6. Age map of Mare Crisium.
Figure 7. Relationship between elemental composition and age of lava flows.
3.3 Lava thickness
To calculate the lava thickness, all simple craters in the mare were selected and the maximum annular distance of surrounding highland materials from the crater rim was estimated. Using the relationships between crater diameter and distribution of materials surrounding the crater, lava thicknesses have been determined. At the center of the mare, simple craters with highland materials around them have not been found. Except in the center, the thickness could be estimated. Then, Apollo Radar Sounder data [Peeples et al. 1978] was used as
© NASA Landing site
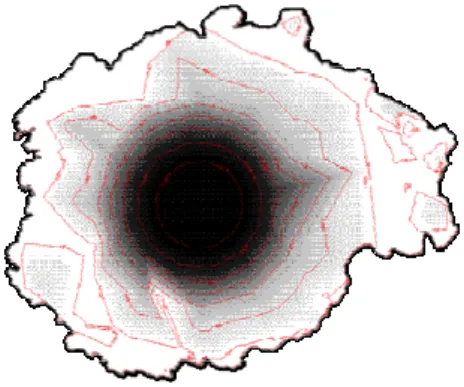
interpolated data, and the lava thickness all over the mare was estimated. The estimated lava thickness contour is shown in Figure 8. A 3D image is shown in Figure 9.
When the lava thickness at the center was 3,400 km, the volume of the mare lava was estimated to be 122,400 km3.
Figure 8. Contour map of lava thickness
Figure 9. 3D image of lava thickness.
According to the relationship between geological age and FeO, younger lava does not have a low FeO content.
Then, if there were a high FeO content around craters in younger lava, that would indicate the crater penetrated the younger geological unit and excavated the material from the underlying older unit. With this assumption, the thickness of a younger lava unit can be estimated. As a result, the volume of 3.1 - 3.3 b.y. ago units near the center of the mare comprised about 10% of the whole mare volume.
4. CONCLUSION 4.1 Conclusion
The prototyped Lunar Surface GIS was developed and it estimated the geological map, age map, and lava thickness calculation. As a result, mare Crisium was formulated by many time lava exclusions between 3.7 – 3.0 b.y. ago. A very young unit at Mare Crisium was discovered in this research. By using the lava thickness estimation, the thickness at several points could be calculated around the mare edges, and the lava volume was also calculated. The proposed Lunar Surface GIS were very effectiveness.
4.2 Future Works
The Lunar Surface GIS will be enhanced by more functions such as impact melt crater analysis. SELENE
has various interesting sensors [SELENE Project], in particular, Spectral Profiler (hyper-spectral sensor). The Spectral Profiler can determine the types of materials, but techniques for analyzing hyper-spectral data are needed. Therefore, an automatic mapping system using hyper-spectral data in a preliminary experiment was developed [Ishimaru and Iwamura 2005]. The experiment indicated that both the spectral and context information should be considered for object recognition and mapping. This Lunar Surface GIS will be used to SELENE data analysis.
4.3 Acknowledgements
The authors would like to thank Mr. Ishimaru and Mr.
Iwamura of Hitachi Central Research Laboratories for helpful discussions.
References:
Boyce, J., et al., 1977. Age of Luna 24 mare basalts based on crater studies. Nature, Vol. 265, pp. 38-39.
Budney, C. J. and P. G. Lucey, 1998. Basalt thickness in Mare Humorum: The crater excavation method. J. Geophysical and Research, Vol. 103, No. E7, pp. 16855-16870.
Ishimaru, N. and Iwamura, K., 2005. An Integrated Framework for Map Generation by Analyzing Hyperspectral Imagery. Proc.
IGARSS 2005.
Ivanov, B., et al, 2002. The Comparison of Size-Frequency Distributions of Impact Craters and Asteroids and the Planetary Cratering Rate. Asteroids III, Univ. Arizona Press, p.89-101.
Kodama, S. and Yamaguchi, Y., 2003. Lunar mare volcanism in the eastern nearside region derived from Clementine UV/VIS data. Meteoritics & Planetary Science, Vol. 38, No. 10, pp.
1461-1484.
Lucey, P. G., Blewett, D. T., and Hawke, B. R., 1998. Mapping the FeO and TiO2 content of the lunar surface with
multispectarl imagery. J. Geophysical Research, Vol. 103, pp.
3679.
Neukum, G. and Ivanov, B. A., 1994. Crater Size Distributions and Impact Probabilities on Earth from Lunar, Terrestrial-planet, and Asteroid Cratering Data. Hazards due to comets and asteroids, University of Arizona Press, pp. 359.
Peeples, W. J. et al., 1978. Orbital radar evidence for lunar subsurface layering in Maria Serenitatis and Crisium. J.
Geophysical Research, Vol. 83, pp. 3459-3468.
Sawabe, Y. et al., 2006. Automatic detection and classification of craters from image data acquired by lunar orbiting space craft.
Advances in Space Research, 37, pp. 21 - 27.
Sawabe, Y. et al., 2005a. Automatic crater detection algorithm for the lunar surface using multiple approaches. Journal of the Remote Sensing of Japan, 25(2), pp. 157-168.
Sawabe, Y. et al., 2005b. Automatic geological classification method at the Lunar Surface GIS. Proc. 38th Conf. Remote Sensing Soc. Japan, pp. 191-192.
SELENE Project,
http://www.jaxa.jp/projects/sat/selene/index_e.html, JAXA.