梔子가 대식세포의 Cytokine에 미치는 영향
가천대학교 한의과대학 한방부인과학교실 차지혜, 임은미
ABSTRACT
Effects of Gardeniae Fructus on Cytokines in Mouse Macrophage Ji-Hea Cha, Eun-Mee Lim
Dept. of Gynecology, College of Oriental Medicine, Ga-Chon University Objectives: The purpose of this study was to investigate the effects of Gardeniae Fructus Water Extract (GF) on the production of inflammatory mediators in RAW 264.7 cell treated with lipopolysaccharide (LPS).
Methods: Gradeniae Fructus was extracted with distilled water (2,000 ml) for 2 hours. In order to evaluate cytotoxicity of GF, 3 - (4,5-dimethylthiazol-2-yl) - 2,5 - diphenyltetrazolium bromide (MTT) assay was performed. To investigate anti- inflammatory effects, the concentration of nitric oxide (NO) was measured with No assay, calcium (Ca) was measured with Fluo-4 Ca assay, and cytokine was measured by Bio-Plex cytokine assay in RAW 264.7 cell. And when p-value is below 0.05, it is judged to have the significant difference statistically.
Results:
1. GF did not show any cytotoxicity.
2. GF suppressed the production of NO and Ca at the concentration of 25, 50, 100 and 200 μg/ml.
3. GF suppressed the production of interleukin (IL)-1β, IL-10, IL-12p40, macrophage -colony stimulating factor (M-CSF), macrophage inflammatory protein (MIP)-1β and keratinocyte chemoattractant(KC) at the concentration of 25, 50, 100 and 200 μg/ml.
4. GF suppressed the production of vascular endothelial growth factor (VEGF), granulocyte-colony stimulating factor (G-CSF) and monocyte cheomattractant protein (MCP)-1 at the concentration of 25, 50 and 100 μg/ml.
5. GF suppressed the production of granulocyte macrophage-colony stimulating factor (GM-CSF) and regulated on activation, normal T cell expressed and secreted (RANTES) at the concentration of 25 and 50 μg/ml.
6. GF suppressed the production of MIP-2 at the concentration of 50 and 100 μg/ml, and tumor necrosis factor (TNF)-α at the concentration of 50 and 200 μg/ml.
Conclusions: These results suggest that GF has anti-inflammatory effect and immuno-modulating activity.
Key Words: Gardeniae Fructus, Macrophage, Anti-inflammation, NO, Cytokine
1)
“이 연구는 2013년도 가천대학교 지원에 의한 결과임”
Corresponding author(Eun-Mee Lim) : Dept. of Gynecology, Gil Oriental Medical, Gachon University, 1200-1, Guwol 1-dong, Namdong-gu, Incheon, Republic of Korea
Tel : 070-7120-5010 E-mail : [email protected]
Ⅰ. 서 론
염증은 손상에 대한 살아있는 조직의 반응으로 생체조직이 어떠한 원인에 의 하여 손상을 받았을 때, 이 손상을 최소 화하고 손상된 부위를 정상상태로 되돌 리려는 생체의 초기 조직반응이며, 면역 계를 동원하는 생체의 방어기전과 상처 의 치유에 핵심적인 역할을 하고 있을 뿐만 아니라 많은 질병의 병리 발생과도 관련되어 있는 중요한 과정이다 1,2) .
염증 반응 과정에서 대식세포는 NO와 다양한 cytokine을 생산하여 초기 감염 방어에 중요한 역할을 한다. 그러나 과 다한 활성에 의해 이들의 생산이 과잉으 로 일어나면 오히려 염증을 심화하고 정 상 조직을 손상시켜 염증 질환을 일으킨 다 3) . 따라서 과도한 NO와 cytokine의 생 성을 억제하는 등의 염증제어는 만성적 인 염증으로 인한 다양한 질환의 예방과 치료에 유의하게 작용할 수 있다.
염증 반응과 관련된 질병들로는 자가 면역질환, 다양한 신경질환, 패혈증, 암, 동맥경화 등이 있으며 4) , 최근에는 정확 한 기전이 밝혀지지 않았으나 골반통증 및 불임의 주요 원인이 되는 자궁내막증과 자연유산, 임신중독증 등의 산부인과질 환의 원인 또한 대식세포의 염증반응과 관련되어 있다는 연구들이 보고되었다 5,6) .
梔子는 꼭두서니과에 속한 常綠灌木인 치자나무 Gardenia jasminoides Ellis 또는 동속식물의 성숙한 果實로, 淸熱瀉火藥 으로 상용되고 있으며 7) , 梔子의 주성분 으로는 iridoid glycoside인 geniposide와 gardenoside를 비롯하여 genipin, geniposidic acid, shanzhiside 8) 및 crocetin derivatives 등이 있다 9) .
최근 梔子와 관련된 연구들로 梔子 추 출물과 梔子로부터 분리된 주성분들의 항염작용에 관한 연구들이 보고되고 있
는데 10-13) , 이에 저자는 梔子의 항염작용
과 관련된 선행연구를 바탕으로 염증매 개물질의 발현과 면역조절의 효과를 다 양한 cytokine의 생성을 통해 확인해보 고자 GF를 대상으로 마우스 대식세포 RAW 264.7 cell의 세포 생존율과 LPS로 유발된 마우스 대식세포의 NO 및 Ca, 그 리고 IL과 chemokine 및 growth factor 등의 cytokine의 생성에 미치는 영향을 조사하여 유의한 결과를 얻었기에 이에 보고하는 바이다.
Ⅱ. 재료 및 방법
1. 재 료 1) 약 재
실험에 사용된 梔子는 한국 대구의 옴니 허브로부터 구입(NO. 2012-0601)하였으 며, 모든 약재는 ultrasonic cleaner(Branson, USA)를 이용하여 불순물을 제거하고 사 용하였다.
2) Cell lines
실험에 사용된 세포는 마우스 대식세 포 RAW 264.7 cell line으로 한국 세포주 은행(Korean Cell Line Bank, KCLB)에 서 구입하였다.
3) 시약 및 기기 (1) 시 약
실험을 위해서 FBS(Sigma, USA), ethyl
alcohol(Samchun Chemical, Korea), penicillin
(Sigma, USA), streptomycin(Sigma, USA),
DMEM(Sigma, USA), methyl alcohol
(Samchun Chemical, Korea), DMSO(Sigma,
USA), PBS(Sigma, USA), EDTA(Sigma, USA), trypsin-EDTA(Sigma, USA), MTT assay kit(Sigma, USA), Fluo-4 Ca assay kit(Molecular Probes, USA), NO assay kit(Sigma, USA), Bio-Plex cytokine assay kit(Panomics, USA) 등이 사용되었다.
(2) 기 기
실험에 사용된 기기는 ultrasonic cleaner (Branson, USA), centrifuge(Hanil, Korea), filter paper(Advantec No.2, Japan), CO 2
incubator(NUAIRE, USA), rotary vacuum evaporator(Eyela, Japan), air compressor (Tamiya, Japan), homogenizer(O-mni, USA), research microscope(Olympus, Japan), fume hood(Hanil, Korea), clean bench (Jeio thec, Korea), deep freezer(Ilshin Lab Co, Korea), microplate reader(Bio- Rad, USA), thermo aluminum bath(Fine PCR, USA), vortex mixer(Vision Scientific Co, Korea), water bath(In-Tron biotech, Korea), ice-maker(Vision Scientific Co, Korea), Bio-Plex 200(Bio-Rad, USA), spectrofluorometer(Dynex, UK) 등이다.
2. 방 법 1) 시료 제조
梔子 30 g을 정확하게 측정한 뒤, 환류 추출기에 1차 증류수 2,000 ml와 함께 넣은 뒤 탕액이 끓는 시점으로부터 2시 간 동안 가열하여 추출한 다음 추출액을 filter paper로 감압 여과한 여과액을 rotary vacuum evaporator를 이용하여 농축액 을 얻었다. 이 농축액을 동결건조기를 이용하여 건조한 분말을 시료로 사용하 였다. 동결건조 추출물은 10.30 g을 얻었 으며, 수율은 34.22%였다.
2) 세포 배양
RAW 264.7 cell을 37℃, 5% CO 2 조건 에서 10% FBS, penicillin(100 U/ml), streptomycin(100 μg/ml)이 첨가된 DMEM 배지로 배양하였다. 세포들은 75 cm² flask 에서 충분히 증식된 후 배양 3일 간격으로 배양세포 표면을 PBS 용액으로 씻어준 후 50 ml flask 당 1 ml의 0.25% trypsin- EDTA용액을 넣고 실온에서 1분간 처리 한 다음 trypsin용액을 버리고 37℃에서 5분간 보관하여 세포를 탈착하여 계대 배양하였다. 탈착된 세포는 10% FBS가 첨가된 DMEM 배양액 10 ml에 부유시 킨 다음 새로운 50 ml의 배양용기에 옮겨 1 : 2의 split ratio로 CO 2 배양기(37℃, 5% CO 2 )에서 배양되었다.
3) 세포생존율 측정
GF의 세포독성을 알아보기 위하여 MTT assay를 다음과 같이 실시하였다. 96 well plate에 1×10 5 cells/well을 100 μl씩 넣고 37℃, 5% CO 2 incubator에서 24시간 동 안 배양한 후 배지를 버리고 배양세포 표면을 1×PBS 용액으로 씻어주었다. 같은 양의 배지와 PBS에 녹인 시료를 25, 50, 100 및 200 μg/ml의 농도에서 각각의 well에 처리하고 24시간 동안 배양하였 다. 배양이 끝난 후 PBS에 녹인 1 mg/ml MTT를 100 μl씩 각 well에 처리하여 알 루미늄호일로 차광시킨 후 2시간 동안 같은 조건에서 배양하였다. 배양액을 모 두 제거한 후 DMSO를 100 μl 처리하고 37℃에서 2시간 방치 후 microplate reader 를 이용하여 490 nm에서 흡광도를 측정, 세포 생존율을 비교하였다.
4) NO 생성 측정
NO의 기질인 L-arginine은 L-citrulline
과 NO로 변하는데, 이는 빠르게 안정된
NO 2 , nitrite, nitrate로 변한다. 그리스
시약(griess reagent: 0.5%의 sulfanilamide, 2.5%의 phosphoric acid 및 0.5%의 naphthylethyleneamine)은 nitrite와 화학 반응하여 보라색의 azo-dye를 형성하고 이것은 NO의 농도와 일치하기 때문에, azo-dye의 농도로부터 nitrite의 농도를 추정하기 위해 microplate reader를 이용 하여 540 nm에서 흡광도를 측정하여 NO 의 생성정도를 비교하였다. 이를 위해 다음과 같이 실험하였다. LPS 1 μg/ml 를 단독 혹은 25, 50, 100 및 200 μg/ml 농도의 시료와 함께 배지에 담아 각 well 에 처리하고 24시간 동안 37℃, 5% CO 2
incubator에서 배양한 후 세포배양 상등액 100 μl을 채취하여 여기에 그리스 시약 100 μl을 혼합하여 15분 동안 반응시킨 후 microplate reader를 이용하여 540 nm에서 흡광도를 측정, NO 생성을 비교하였다.
5) Ca 생성 측정
GF가 마우스 대식세포의 세포내 Ca 방출에 미치는 영향을 알아보기 위하여 Fluo-4 Ca assay를 다음과 같이 실시하 였다. 96 well plate에 2×10 5 cells/ml의 cell을 100 μl씩 넣고 37℃, 5% CO 2 incubator 에서 24시간 동안 배양한 후 배지를 제 거하고 배양세포 표면을 1×PBS 용액으 로 씻어준 뒤 각 well에 LPS 1 μg/ml를 단독 혹은 25, 50, 100 및 200 μg/ml 농 도의 시료와 함께 배지에 담아 처리하고 24시간 동안 37℃, 5% CO 2 incubator에 서 배양하였다. 배양이 끝난 후 각 well 의 배지를 제거하고 100 ml의 Fluo-4 dye solution을 각 well에 처리한 후, 30 분 동안 37℃, 5% CO 2 incubator에서 배 양, 상온에서 30분 동안 추가 배양하였 다. 배양이 끝난 후, spectrofluorometer(485 nm excitation filter; 535 nm emission
filter)를 이용하여 각 well의 형광강도를 측정, 비교하였다.
6) Cytokine 생성 측정
Cytokine의 분비와 관련된 GF의 영향 을 알아보기 위해 Politch 등의 연구를
14,15) 참조하여 다음과 같이 실험하였다.
96 well plate에 1×10 5 cells/ml의 cell을 100 μl씩 넣고 37℃, 5% CO 2 incubator 에서 24시간 동안 배양한 후 배지를 버 리고 배양세포 표면을 1×PBS 용액으로 씻어준 뒤 각 well에 LPS 1 μg/ml를 단 독 혹은 25, 50, 100 및 200 μg/ml 농도 의 시료와 함께 배지에 담아 처리하고 24시간 동안 배양하였다. 배양이 끝나면 상등액을 채취하여 96 well type의 filter plate에 미리 준비되어 있던 antibody- conjugated capture beads와 결합시켰다.
결합된 capture beads가 담긴 filter plate의 각 well을 150 μl의 wash buffer로 세척 하였다. 세척이 끝난 뒤 각 well에 detection antibody를 추가한 후 30분간 배양하였 다. 배양이 끝나면 wash buffer로 3회 세척 한 뒤 각 well에 streptavidin-phycoerythrin 을 분주하고 상온에서 300~500 rpm의 조건으로 30분간 진동배양한다. 배양이 끝나면 wash buffer로 3회 세척한 뒤 각 well에 120 μl의 reading buffer를 분주하 고 상온에서 300~500 rpm의 조건으로 5 분간 진동배양한 후 Bio-Plex array reader 를 이용, 측정하고자 하는 cytokine의 양 을 조사, 비교하였다.
3. 통계처리
실험에서 얻은 결과에 대해서는 mean
±SD로 나타내었으며, 대조군과 실험군의
평균 차이는 Student's t-test와 ANOVA
test로 분석하여 p-value 값이 0.05 미만
일 때 통계적으로 유의한 차이가 있는 것으로 판정하였다.
Ⅲ. 결 과
1. 세포생존율의 변화
GF가 대식세포의 세포생존율에 미치 는 영향을 측정한 결과 세포독성을 나타 내지 않았다(Fig. 1).
Fig. 1. Effect of GF on Cell Viability in RAW 264.7 Cell.
GF : Gardeniae Fructus water extract.
Nor (Normal) : Treated with media only.
Cells were incubated with GF at the concentration of 25, 50, 100, 200 μg/ml for 24 hrs.
Results are represented as mean±SD of three independent experiments.
* : Statistically significant compared with normal (p<0.05)
** : Statistically significant compared with normal (p<0.01)
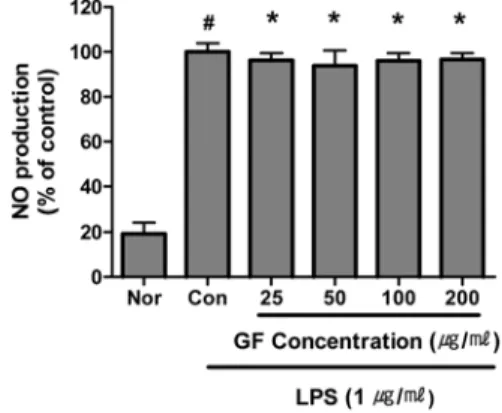
2. NO 생성의 변화
GF는 25, 50, 100 및 200 μg/ml의 모 든 농도에서 NO의 생성을 유의하게 억 제하였다(Fig. 2).
3. Ca 생성의 변화
GF는 25, 50, 100 및 200 μg/ml의 모 든 농도에서 Ca의 생성을 유의하게 억 제하였다(Fig. 3).
Fig. 2. Effect of GF on NO Production of RAW 264.7 Cell Treated with LPS.
GF : Gardeniae Fructus water extract.
Nor (Normal) : Treated with media only.
Con (Control) : Treated with LPS (1 μg/ml) only.
LPS-induced cells were incubated with GF at the concentration of 25, 50, 100, 200 μg/ml for 24 hrs.
Results are represented as mean±SD of three independent experiments.
# : Statistically significant compared with normal (p<0.05)
* : Statistically significant compared with control (p<0.05)
** : Statistically significant compared with control (p<0.01)
Fig. 3. Effect of GF on Ca Production of RAW 264.7 Cell Treated with LPS.
GF : Gardeniae Fructus water extract.
Nor (Normal) : Treated with media only.
Con (Control) : Treated with LPS (1 μg/ml) only.
LPS-induced cells were incubated with GF at the concentration of 25, 50, 100, 200 μg/ml for 24 hrs.
Results are represented as mean±SD of three independent experiments.
# : Statistically significant compared with normal (p<0.05)
* : Statistically significant compared with control (p<0.05)
** : Statistically significant compared with control (p<0.01)
4. Cytokine 생성의 변화 1) IL-1β
GF는 25, 50, 100 및 200 μg/ml의 모 든 농도에서 IL-1β의 생성을 유의하게 억제하였다(Fig. 4).
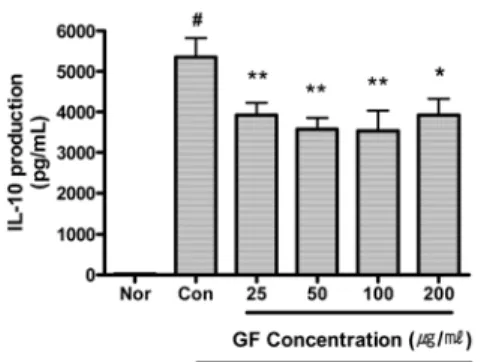
2) IL-10
GF는 25, 50, 100 및 200 μg/ml의 모 든 농도에서 IL-10의 생성을 유의하게 억제하였다(Fig. 5).
3) IL-12p40
GF는 25, 50, 100 및 200 μg/ml의 모 든 농도에서 IL-12p40의 생성을 유의하 게 억제하였다(Fig. 6).
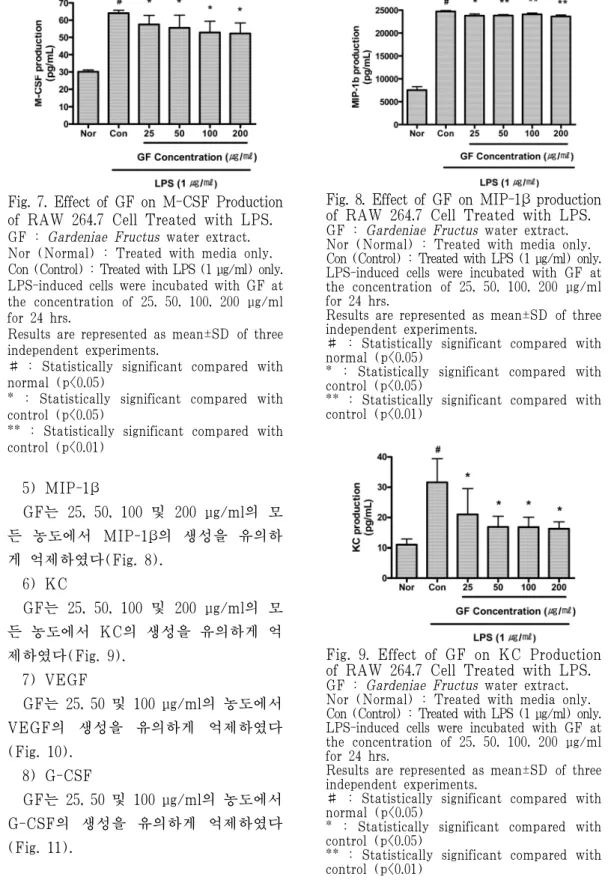
4) M-CSF
GF는 25, 50, 100 및 200 μg/ml의 모 든 농도에서 M-CSF의 생성을 유의하게 억제하였다(Fig. 7).
Fig. 4. Effect of GF on IL-1β Production of RAW 264.7 Cell Treated with LPS.
GF : Gardeniae Fructus water extract.
Nor (Normal) : Treated with media only.
Con (Control) : Treated with LPS (1 μg/ml) only.
LPS-induced cells were incubated with GF at the concentration of 25, 50, 100, 200 μg/ml for 24 hrs.
Results are represented as mean±SD of three independent experiments.
# : Statistically significant compared with normal (p<0.05)
* : Statistically significant compared with control (p<0.05)
** : Statistically significant compared with control (p<0.01)
Fig. 5. Effect of GF on IL-10 Production of RAW 264.7 Cell Treated with LPS.
GF : Gardeniae Fructus water extract.
Nor (Normal) : Treated with media only.
Con (Control) : Treated with LPS (1 μg/ml) only.
LPS-induced cells were incubated with GF at the concentration of 25, 50, 100, 200 μg/ml for 24 hrs.
Results are represented as mean±SD of three independent experiments.
# : Statistically significant compared with normal (p<0.05)
* : Statistically significant compared with control (p<0.05)
** : Statistically significant compared with control (p<0.01)
Fig. 6. Effect of GF on IL-12p40 Production of RAW 264.7 Cell Treated with LPS.
GF : Gardeniae Fructus water extract.
Nor (Normal) : Treated with media only.
Con (Control) : Treated with LPS (1 μg/ml) only.
LPS-induced cells were incubated with GF at the concentration of 25, 50, 100, 200 μg/ml for 24 hrs.
Results are represented as mean±SD of three independent experiments.
# : Statistically significant compared with normal (p<0.05)
* : Statistically significant compared with control (p<0.05)
** : Statistically significant compared with control (p<0.01)
Fig. 7. Effect of GF on M-CSF Production of RAW 264.7 Cell Treated with LPS.
GF : Gardeniae Fructus water extract.
Nor (Normal) : Treated with media only.
Con (Control) : Treated with LPS (1 μg/ml) only.
LPS-induced cells were incubated with GF at the concentration of 25, 50, 100, 200 μg/ml for 24 hrs.
Results are represented as mean±SD of three independent experiments.
# : Statistically significant compared with normal (p<0.05)
* : Statistically significant compared with control (p<0.05)
** : Statistically significant compared with control (p<0.01)
5) MIP-1β
GF는 25, 50, 100 및 200 μg/ml의 모 든 농도에서 MIP-1β의 생성을 유의하 게 억제하였다(Fig. 8).
6) KC
GF는 25, 50, 100 및 200 μg/ml의 모 든 농도에서 KC의 생성을 유의하게 억 제하였다(Fig. 9).
7) VEGF
GF는 25, 50 및 100 μg/ml의 농도에서 VEGF의 생성을 유의하게 억제하였다 (Fig. 10).
8) G-CSF
GF는 25, 50 및 100 μg/ml의 농도에서 G-CSF의 생성을 유의하게 억제하였다 (Fig. 11).
Fig. 8. Effect of GF on MIP-1β production of RAW 264.7 Cell Treated with LPS.
GF : Gardeniae Fructus water extract.
Nor (Normal) : Treated with media only.
Con (Control) : Treated with LPS (1 μg/ml) only.
LPS-induced cells were incubated with GF at the concentration of 25, 50, 100, 200 μg/ml for 24 hrs.
Results are represented as mean±SD of three independent experiments.
# : Statistically significant compared with normal (p<0.05)
* : Statistically significant compared with control (p<0.05)
** : Statistically significant compared with control (p<0.01)
Fig. 9. Effect of GF on KC Production of RAW 264.7 Cell Treated with LPS.
GF : Gardeniae Fructus water extract.
Nor (Normal) : Treated with media only.
Con (Control) : Treated with LPS (1 μg/ml) only.
LPS-induced cells were incubated with GF at the concentration of 25, 50, 100, 200 μg/ml for 24 hrs.
Results are represented as mean±SD of three independent experiments.
# : Statistically significant compared with normal (p<0.05)
* : Statistically significant compared with control (p<0.05)
** : Statistically significant compared with control (p<0.01)
Fig. 10. Effect of GF on VEGF Production of RAW 264.7 Cell Treated with LPS.
GF : Gardeniae Fructus water extract.
Nor (Normal) : Treated with media only.
Con (Control) : Treated with LPS (1 μg/ml) only.
LPS-induced cells were incubated with GF at the concentration of 25, 50, 100, 200 μg/ml for 24 hrs.
Results are represented as mean±SD of three independent experiments.
# : Statistically significant compared with normal (p<0.05)
* : Statistically significant compared with control (p<0.05)
** : Statistically significant compared with control (p<0.01)
Fig. 11. Effect of GF on G-CSF Production of RAW 264.7 Cell Treated with LPS.
GF : Gardeniae Fructus water extract.
Nor (Normal) : Treated with media only.
Con (Control) : Treated with LPS (1 μg/ml) only.
LPS-induced cells were incubated with GF at the concentration of 25, 50, 100, 200 μg/ml for 24 hrs.
Results are represented as mean±SD of three independent experiments.
# : Statistically significant compared with normal (p<0.05)
* : Statistically significant compared with control (p<0.05)
** : Statistically significant compared with
control (p<0.01)
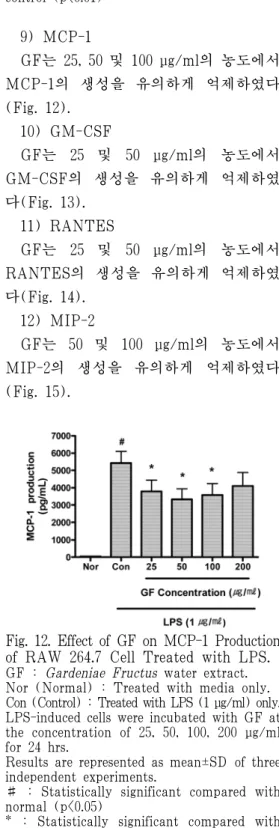
9) MCP-1
GF는 25, 50 및 100 μg/ml의 농도에서 MCP-1의 생성을 유의하게 억제하였다 (Fig. 12).
10) GM-CSF
GF는 25 및 50 μg/ml의 농도에서 GM-CSF의 생성을 유의하게 억제하였 다(Fig. 13).
11) RANTES
GF는 25 및 50 μg/ml의 농도에서 RANTES의 생성을 유의하게 억제하였 다(Fig. 14).
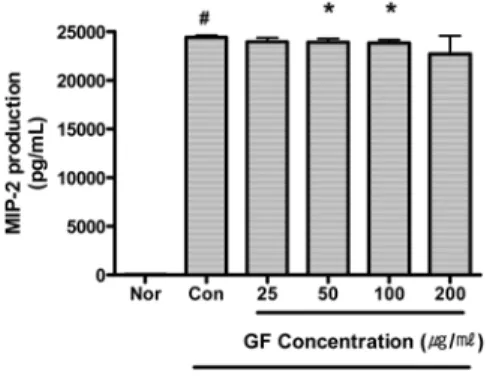
12) MIP-2
GF는 50 및 100 μg/ml의 농도에서 MIP-2의 생성을 유의하게 억제하였다 (Fig. 15).
Fig. 12. Effect of GF on MCP-1 Production of RAW 264.7 Cell Treated with LPS.
GF : Gardeniae Fructus water extract.
Nor (Normal) : Treated with media only.
Con (Control) : Treated with LPS (1 μg/ml) only.
LPS-induced cells were incubated with GF at the concentration of 25, 50, 100, 200 μg/ml for 24 hrs.
Results are represented as mean±SD of three independent experiments.
# : Statistically significant compared with normal (p<0.05)
* : Statistically significant compared with control (p<0.05)
** : Statistically significant compared with control (p<0.01)
Fig. 13. Effect of GF on GM-CSF Production of RAW 264.7 Cell Treated with LPS.
GF : Gardeniae Fructus water extract.
Nor (Normal) : Treated with media only.
Con (Control) : Treated with LPS (1 μg/ml) only.
LPS-induced cells were incubated with GF at the concentration of 25, 50, 100, 200 μg/ml for 24 hrs.
Results are represented as mean±SD of three independent experiments.
# : Statistically significant compared with normal (p<0.05)
* : Statistically significant compared with control (p<0.05)
** : Statistically significant compared with control (p<0.01)
Fig. 14. Effect of GF on RANTES Production of RAW 264.7 Cell Treated with LPS.
GF : Gardeniae Fructus water extract.
Nor (Normal) : Treated with media only.
Con (Control) : Treated with LPS (1 μg/ml) only.
LPS-induced cells were incubated with GF at the concentration of 25, 50, 100, 200 μg/ml for 24 hrs.
Results are represented as mean±SD of three independent experiments.
# : Statistically significant compared with normal (p<0.05)
* : Statistically significant compared with control (p<0.05)
** : Statistically significant compared with control (p<0.01)
Fig. 15. Effect of GF on MIP-2 Production of RAW 264.7 Cell Treated with LPS.
GF : Gardeniae Fructus water extract.
Nor (Normal) : Treated with media only.
Con (Control) : Treated with LPS (1 μg/ml) only.
LPS-induced cells were incubated with GF at the concentration of 25, 50, 100, 200 μg/ml for 24 hrs.
Results are represented as mean±SD of three independent experiments.
# : Statistically significant compared with normal (p<0.05)
* : Statistically significant compared with control (p<0.05)
** : Statistically significant compared with control (p<0.01)
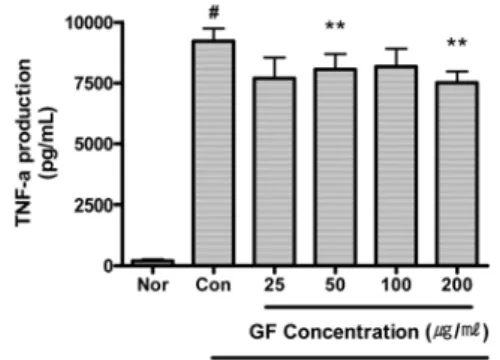
13) TNF-α
GF는 50 및 200 μg/ml의 농도에서
TNF-α의 생성을 유의하게 억제하였다
(Fig. 16).
Fig. 16. Effect of GF on TNF-α Production of RAW 264.7 Cell Treated with LPS.
GF : Gardeniae Fructus water extract.
Nor (Normal) : Treated with media only.
Con (Control) : Treated with LPS (1 μg/ml) only.
LPS-induced cells were incubated with GF at the concentration of 25, 50, 100, 200 μg/ml for 24 hrs.
Results are represented as mean±SD of three independent experiments.
# : Statistically significant compared with normal (p<0.05)
** : Statistically significant compared with control (p<0.01)