- 171 -
중국의 물류네트워크 및 경제발전*
Kevin Li**·Guanqiu Qi***
Logistics network and economic development in China
Kevin Li·Guanqiu Qi
Abstract
Logistics network has been increasingly acknowledged as one of the important driving force for economic development in China. With the scope of logistics effect broadening and the develop- ment of logistics infrastructure, both logistics network and economy in terms of GDP in China has experienced rapid development hand in hand.
This paper investigates the relationship between logistics network and economic growth, using a dataset covering 31 provinces over the period from 2003 to 2012 in China. Factor analysis is ap- plied to obtain a total evaluation of logistics function defining the impact of logistics network on the national economy growth. According to fixed effect panel data approach, a significant and pos- itive impact of logistics network on economic growth in China is found, meanwhile, a comparative analysis regarding economic development between coastal provinces and interior provinces is also conducted. The results suggest that the impact of logistics network on economic growth is higher in eastern provinces than that in western provinces. The policy implication for other nations, in particular for developing nations, is logistics network should be regarded as an important driving force for economic development, and investment should be made in advance to achieve the best efficiency in economic development and planning.
Key words : logistics network, economic growth, fixed panel data model, factor analysis
▷ 논문접수: 2015. 03. 12. ▷ 심사완료: 2015. 03. 23. ▷ 게재확정: 2015. 03. 25.
*“This research was supported by the Chung-Ang University Research Scholarship Grants in 2014, and the National Research Foundation of Korea Grant funded by the Korean Government (NRF-2014S1A2A2027957)ˮ. This study does not cover Hong Kong, Macao and Taiwan.
** Professor, Department of International Logistics, Chung-Ang University, Seoul, The first author, [email protected]
*** Ph.D. student, Department of International Logistics, Chung-Ang University, Seoul, The coauthor, [email protected]
Ⅰ. Introduction
In the 1960s, American scholar Drucker brought forward the doctrine that logistics was the gloomy mainland of economic field and more scholars started to study logistics theory. Drucker stated that there was interrelation between logistics in- dustry and economic development (De´murger, 2001; Khadaroo & Seetanah, 2008). Some other points, such as developing logistics industry brings logistics systemʼs reformation (David, 2001; Hong et al., 2011); and on the other hand, logistics capital have a significant positive impact on the countyʼs output.(Ozbay et al., 2007), were suggested.
According to the National Bureau of Statistics of China, the Gross Domestic Products (GDP) of China increased radically from RMB 4,545.62 bil- lion in 1980 to RMB 519,470.10 billion in 2012.
Chinaʼs economy is growing rapidly after reform- ing and opening up in1978 and in 2010 has be- came the second largest economy in the world.
Meanwhile, with the gradual expansion of trade flows involving domestic trade and foreign trade, the transport networks and logistics industry had played a more important role. Also, it stimulated the need to develop logistics market, improve lo- gistics management, and promote hinterland phys- ical infrastructure, both in terms of quality and quantity.
The purpose of this paper is to provide more detailed insights into the significance of logistics development to economic growth in China. Spe- cifically, the first is to identify some important factors affecting the logistic development; the sec- ond is to obtain a comprehensive assessment of each province regarding the level of the logistics
development, and the third is to evaluate the contribution of logistics development to economic growth.
The rest of this paper is structured as follows:
Section II provides a comprehensive literature re- view pertaining to the relationship between logis- tics development and economic growth. Concepts and characteristics of logistics in China are in- troduced in Section III. Data and methodology are presented in Section IV and the empirical re- sults as well as discussion are reported in Section V. Conclusion is summarized in Section Ⅵ.
Ⅱ. Literature Review
There are types of theories on the relationship
between logistics development and economic
growth, i.e., two streams of theories includ-
ing“logistics-promoteˮ and“economy-pullˮ. Spe-
cifically, the former theory addresses that logistics
network can contribute to economic growth in
terms of further investment of the transport infra-
structure, promotion of e-business, and decrease
of waste of storage house resource (Hong et al.,
2011; De´murger, 2001). On the other hand, the
latter suggests that economic growth is able to
increase the demand for logistics service. More-
over, logistics network level is determined by
economic growth level (Jiwattanakulpaisarn et al.,
2011). Accordingly, the relationship between lo-
gistics development and economic growth is be-
coming a hut issue for researcher. Some re-
searches have been done aiming to find the
relationship. From 1960s, American scholar Drucker
proposed the doctrine that logistics is the gloomy
mainland of economic field and more scholars
started to study logistics theory. Logistics industry is regarded as the main support and fundamental industry of economic development. Wang (2010) found that the degree of logistics development is one of the symbols of upgrading and completing national strength, and is described as the accel- erator on promoting economic development. There- after many researches started to consider the in- terrelation between Logistics development and economic growth. Previous studies have recog- nized various determinants contributing to eco- nomic growth. For example, investment in trans- portation which is widely recognized and studied by scholars; investment in E-commerce, because Bosworth and Triplett (2000) found that E-com- merce has played a great role on economic de- velopment and profoundly affected peopleʼs eco- nomic life; public infrastructures; investment in logistics capital; FDI; government consumption;
population growth or density, human capital. But in this research, by reviewing previews resear- ches on the relationship between logistics devel- opment and economic, this thesis generally re- garded transportation as the most represented opinion and analyzed relationship between them both in qualitative and quantitative method. (Mody
& Wang, 1997; Demurger, 2001; Goh & Ling, 2003; Ding et al., 2008; Hooi Hooi Lean, 2014).
Consider, for example, the situation in China.
First, in China it is widely accepted that ʻroad leads to prosperityʼ. According to this, some poli- cy-makers have been encouraged to make huge investments in expanding the nationʼs transport network. Obviously, transport infrastructure in- vestment has a capability of increasing pro- ductivity and bringing up economic growth. For
instance, China is building transport infrastructure like railway or highway at an unprecedented speed, linking its cities with high-speed railways.
Shirley and Winston (2004) stated that investment in highway and high-speed railway can bring benefits by lowering inventories, and generated the cost saving benefits, while investment in tele- communications can generate benefits due to im- proved marketing information(Madden & Savage, 2000). Researchers found that the improvement of infrastructure was not a sufficient condition for regional development, both transport and tele- communication facilities had become growth en- gines during this period, also many other factors played a role in economic growth(Mody &
Wang, 1997; Rietveld, 1994; Banister & Berechman, 2001; Demurger, 2001; Bose et al., 2005; Deng, 2013; Hooi, 2014). Ding et al., (2008) found that telecommunication infrastructure did enhance eco- nomic growth and there was an obvious regional income convergence in China from 1986 to 2002.
The main problems in Chinaʼs logistics dis-
tribution were undeveloped infrastructure, govern-
ment regulations; regional protection and frag-
mented distribution channels throughout the coun-
try and the aged infrastructure, archaic and ling
equipment and the lack of qualified logistics per-
son cannot meet the vibrant demand in the
economy. (Jiang & Prater, 2002; Goh & Ling,
2003). Banister and Thurstain-Goodwin (2011)
suggested the transport investment affected the
local economy at three different levels: firstly, at
the macroeconomic level, regional network effects
could be identified as measured through changes
in output and productivity. Secondly, at the meso
level, the impacts relate more to agglomeration
economies and labour market effects. Finally, at the micro level, the impacts are determined by the land and property market effects. Most of the previous studies have used a production function model with a similar structure. While lo- gistics infrastructure leads to economic growth through the following mechanisms: Firstly, invest- ment in infrastructure increases the demand for goods and services. Secondly, the improvement of logistics infrastructure reduces travel time, and passenger and freight transporters gain directly from time and cost savings (Gunasekera et al., 2008). Thirdly, a better infrastructure attracts for- eign direct investment (Hong et al., 2011), which is an important engine of economic growth in China.
Second, there is a rapid growth of research on e-commerce and economic growth. E-commerce has become a hot issue with the rapid develop- ment of computer, network, and information and communication technology. It has played a great role on economic development and profoundly affected peopleʼs economic life (Bosworth,2000).
In China, with the development of computer technology and networking, e-commerce has en- tered a stage of large scale development. As the number of internet users, growth and the steady improvement of the national economy, B2B and online ecommerce industry as the representative of China have made a substantial contribution to the GDP (Lu, 2012). The telecommunication in- frastructure, investment, and FDI enhanced eco- nomic growth as the relationship is significantly positive and there was an obvious regional in- come convergence in China. (Ding et al., 2008;
Yang, 2011)
Third, research on logistics capital and eco- nomic growth states that investment in logistics can not only increase the demand for goods and services, but also improve the efficiency of logis- tics systems by reducing travel time and cost (Roller & Weverman, 2001; Gunasekera et al., 2008).
Fourth, research on foreign direct investment (FDI) and economic growth is attractive as FDI is widely regarded as an important engine of economic growth in China, which can be re- flected by the popularity of the development of logistics zones (Lu & Yang, 2006).
Fifth, as for the research methods, more atten- tion has been paid to quantitative approaches to examine the relationship between logistics devel- opment and economic growth. Among them, Granger causality test is widely used. For in- stance, an interaction relationship between logis- tics development and economic growth was found (Bose & Haque, 2005; Sahoo & Dash, 2007; Zhang, 2010). The other popular quantita- tive method is regression technique aiming to ex- amine the magnitude of their interdependence (Wang, 2010; Chen, 2010).
Finally, particular concerns also have been given to regional analysis of the relationship between lo- gistics development and economic growth in China. A case study of Zhejiang province showed the existence of interaction relationship between logistics development and economic growth (Liu
& Li, 2007). Other studies contributing to this is- sue can be found in Yang (2009), Zheng (2009), Zhang (2010), Luo (2011), Liu (2012) and so on.
Liu (2012) found that, Qin Huangdao port logis-
tics and regional economic development consists
of a mutual have long-term effect of dynamic linear system, but different is, Goods growth is to promote the increase of the GDP throughput Granger causes, but the influence of the reverse is not significant. This shows that the port logis- tics development of Qin Huangdao city can im- prove economic growth. While a number of studies have been done in the literature, several basic questions remain unsolved. On one hand, previous studies tend to focus on only one type of logistics infrastructure, like highway invest- ment, railway length (Fleisher & Chen, 1997), cargo turnover, freight volume individually to test the relationship between logistics development and economic growth, which cannot capture the impact of total logistics ability. On the other hand, they didnʼt use some comprehensive data, and their data used didnʼt reflect the whole lo- gistics development. Many empirical studies have confirmed the effect of logistic development on economic growth. Panel data mean sectional time-series data which is a dataset in which the behavior of entities are observed across time.
Ⅲ. Concepts and Characteristics of Logistics in China
Logistics means more than handling, transport, and storage of goods today. Logistics has its ori- gins in the military. From that perspective, it ap- plies to the process of supplying a theater of war with troops, equipment and supplies. Today logistics development in China is fundamental to its economic growth. Chinaʼs logistic is growing at an extraordinary rate; because of the rapid ex- pansion of the countryʼs industrial economy base.
Chinese economic growth has been heavily de- pendent on logistics since 1980s. China needs to develop its logistics market, management, and hinterland transportation infrastructure, both in terms of quality and quantity, if it aims to be maintaining the current levels of development.
The government has acknowledged that effi- cient transport and logistics is the key for long development and it should commit huge funds to build airports, roll out a national expressway net- work and, expands and upgrades the countryʼs railway system.
China has built a comprehensive transportation system of railways, highways, and airports. A big part of Chinaʼs transport system has been built since 1949 and especially since the beginning of the 80s. However, the development of the coun- try in these transport infrastructures varies ex- tremely according to the region, with important local disparities: bad equipment in the West of the country, in particular the Tibet, due to its re- liefs, and then the Xinjiang, the Inner Mongolia and the Yunnan. The western urban regions, be- tween the metropolises of Wuhan, Shanghai, Xiʼ an and Harbin are much better handed out.
Hong and Liu (2007) found that most of the logistics companies in China provided limited val- ue-added service to customers and society. The industry provides only traditional services, such as transportation, distribution and warehousing.
Only a small number of companies had“high- levelˮ activities, such as logistics system design and information management. The World Bankʼs Logistics Performance Index shows there are some problems in the logistics industry of China.
At an international rank of 27, China lead the
developing countries, but still lags significantly behind some industrial nations, and was far be- hind Germany, Singapore, and Sweden. Without doubt, the logistics industry in China is robust in its growth. However, it still faces many chall- enges. Like: 1, Logistics concentration remains scattered; 2, Total logistics costs stay high; 3, Warehousing management has room to grow; 4, Logistics burden of high toll fees; 5, Stringent regulation hinders logistics growth-- Licensing ap- plications; 6, Constraints on human resources; 7, Corruption. Numerous small-sized enterprises of- fer similar but limited services without nationwide coverage, while the supply of logistics facilities in some districts is either insufficient or redun- dant. Also, constraints on logistics facilities and human capital, as well as expensive logistics costs, add further burdens to logistics users and operators. Although the government has adopted
promulgated numbers of measures to support the development of the logistics industry, policy ex- ecution sometimes hinders that growth.
The government is fully aware of how possi- ble inefficiencies in the logistics are impacting economic growth, and is in the gradual process of addressing these through a combination of regulatory measures. The governmentʼs 11th Five Year Plan, running from 2005 to 2010, sets out key investment areas for transport infrastructure projects.
Ⅳ. Data and Methodology
Based on the theory of logistics network and economy growth, firstly, this research aims to identify main factors affecting the performance of logistics development by using factor analysis and then to obtain a total evaluation of logistics
Variables symbol Variables
X1 Passenger traffic
X2 Passenger kilometers
X3 Freight traffic
X4 Freight ton-kilometers
X6 Possession of civil transport deadweight ton
X5 Possession of civil transport vessel
X7 Possession of civil transport vessels
X8 Internet users
X11 Pieces of express mail services
X12 Length of railways in operation
X13 Length of highways
Y P-GDP
X9 Ratio of transport investment to total social investment X10 Ratio of transport employed persons to total social employed persons
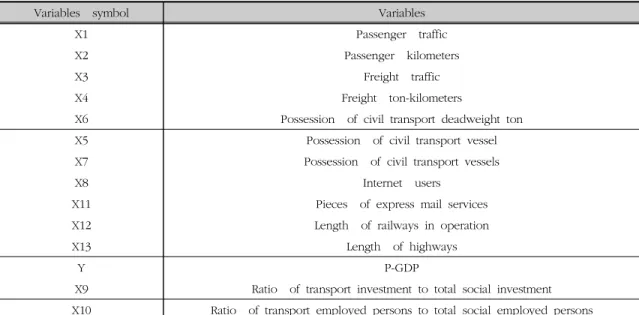
Table 1. Descriptive statistics of all variables
function. Then, with the help of a panel data model with fixed effect, the relationship between logistics development and economic growth is quantitatively examined under the framework of production function.
1. Data Resources and Indexes Selection
The sample data is mostly collected from Chinaʼs National Bureau of Statistics and available from the Statistics website. There are 13 variables selected in the research overall 31 provinces from 2001-2012 in China which has not been tried yet and this paper will try to test the rela- tionship between logistics network and economic growth. As showed in Table 1, all data are an- nual data and they are transformed to the natural logarithmic form. Research uses econometric ana- lytical method, taking the gross domestic product as the explained variable (Y) to show the level of economic development, taking the 13 variables shown in Table 1 as the explaining variable to show the development level of logistics industry.
The variables in this paper are selected follow- ing the guidance of the previous literature (De- murger, 2001; Datta and Agarwal, 2004; Ding et al., 2008). Some variables have been applied, for example, the provincial economic data of GDP, real GDP per capita, physical capital stock, la- bour force (David Yossi, 2001; Yang Shao, 2010). For example, In addition, Roller and Waverman (2001) tested the relationship between logistics network and economic growth from a total output, demand and disaggregate output perspective.
2. Main Method: Panel Data Analysis
Following Cai (2006), a panel production func- tion model is considered in this paper. Cai (2006) regarded the logistics industry as a func- tion of economic growth. Besides this, physical capital stock and labor force are also considered in this study. Transport infrastructure, mainly in- cluding roads, railroads, airports and seaports, has often been claimed as an important determi- nant of productivity and economic growth. Accor- ding to Chinaʼs National Bureau of Statistics, transportation accounts for the largest component of total logistics costs in China, with around 55 percent (RMB 2.1 trillion)
1), followed by in- ventory storage costs (RMB 1.2 trillion) and man- agement costs (RMB 500 billion) in 2012. From this data, we can see logistics cost is key to to- tal logistics industry in China. In this paper, to reflect the level of infrastructure of each prov- ince, factors like total investment in fixed assets of transport, storage, post and telecommunication, railway length, number of fixed line telephones for will be used to check the actual strength of different provinces.
Panel data means data series observations of a number of individuals, observations in panel data involve at least two dimensions; one is a cross- sectional dimension, indicated by subscript i, and other one is a time series dimension, indicated by subscript t.
′
1) CIA – The World Factbook(ed.), https://www.cia.go
v/library/publications/the-world-factbook/geos/ch.htm
l.(last retrieved 01/2011.)
Where i=1, ⋯ , N , t =1, ⋯ , T. The stochas- tic process {yit} is used for panel individuals. To avoid spurious regression, the series considered in a particular study should be stationary, which can be checked by employing unit root test. The main panel data method has clear advantages in considering cross-section data and time series da- ta together. Moreover, by identifying fixed ef- fects, this model is helpful to consider differ- ences between individuals, and it is able to im- prove the estimation efficiency. Also, co-in- tegration test can be used to test the long run equilibrium relationship between variables with the same order of integration. Consequently, a three-step procedure is proposed: In step 1, the panel-based unit root test is proposed which al- lows for individual special intercepts and time trends. Step 2 will estimate the ratio of long run to short run innovation standard deviation of each individual. In the final step, we will esti- mate the panel pooled model with fixed effect.
The subsidiary method in this research is factor analysis, factor analysis is a statistical method which is used to describe variability among ob- served, correlated variables in terms of a poten- tially lower number of unobserved variables called factors. And Factor analysis searches for such joint variations in response to unobserved latent variables. Specifically, there are 13 original variables regarding logistics network in this research. Due to the potential multicollinearity ex- isting among the original variables, factor analysis is used for dimension reduction and simplicity.
3. Subsidiary Method: Factor Analysis
The subsidiary method in this research is fac-
tor analysis-factor analysis
2)is a statistical method which is used to describe variability among ob- served, correlated variables in terms of a poten- tially lower number of unobserved variables called factors. Factor analysis (FA) which is a method first introduced by Thurstone(1931), is performed to reduce correlational variables into a smaller number of factors by examining pattern of corre- lations between observed variables. In other words, it means highly correlated variables are likely in- fluenced by the same factors while lowly corre- lated variables are likely influenced by different factors. Consider a set of m observable and cor- related random variable, x
1. x
2, …, x
m. By using FA, original variables can be written as linear combinations of n unobserved random factors plus the error terms. Then, the specification is:
⋯
⋯
⋮
⋯
(1)
where fi, i=1, 2, …, n denotes the unobserved random factors while
is the error terms. To reduce the number of variables, n should be lower than m. Furthermore,
are independently distributed with zero mean and finite variance, which maybe not as same as for all i. Factors,
, …
, are uncorrelated. By solving (1), a number of correlated variables can be trans- formed into a smaller number of uncorrelated factors containing most original information. More
2) http://en.wikipedia.org/wiki/Factor_analysis
technique details can be found in Akaike(1987), Ledesma and Valero-Mora(2007). And Factor anal- ysis is used to search joint variations related to unobserved latent variables. Specifically, there are 13 original variables regarding logistics network in this research. Due to the potential multi- collinearity existing among the original variables, factor analysis is used for dimension reduction and simplicity.
Ⅴ. Empirical Results and Analysis
Firstly, the suitability of factor analysis has to been checked before analysis, which is achieved by KMO test. According to the result presented in Table 2, KMO statistic values between 0 and 1, the degree which is closer to 1 means that a correlation between variables is strong and the results of factor analysis are better. The corre- sponding values of the corresponding suitability of factor analysis as followed in the table: (see Table 2). As showed in Table 3, KMO> 0.7, and Bartlettʼs test
= 3979.791, P <0.05. So form this
P value, the analysis can be carried out and the original variables are suitable for factor analysis.
Therefore, this study applies SAS9.2 statistical analysis software to conduct factor analysis of the original data.
Secondly, by using the factor analysis, four factors can be identified, factor 1, 2, 3 and 4, which accounts for more than 80% of the total variation. with the help of principal component analysis method, the original 13 indicators belong to four main factors, which can fully reflect the original factor structure evaluation information.
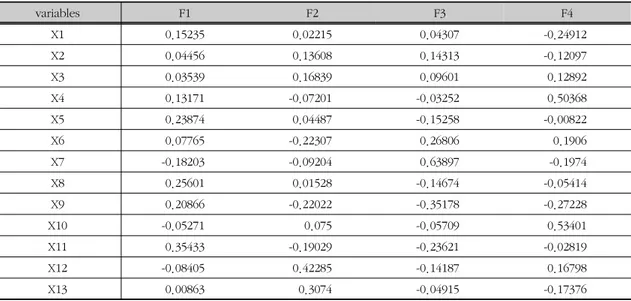
From Table 4, there are four main factors F1, F2, F3, and F4 in order to get the logistics eval- uation after factor analysis system, in this paper, we named F1 industry indicators because varia- bles belong to it are mostly represent the in- dustry development level, like passengers in traf- fic, then we name F2 infra indicators and named F3 to development indicators, F4 is named to been human indicators. According to the pro- portion and size of load about each indicator on each of the main factors, that can be seen (see Table 4). Meanwhile, the score and coefficient of
KMO statistics Factor analysis for degree KMO statistics Factor analysis for degree
≥0.9 fit well 0.6-0.7 Average
0.8-0.9 suitable 0.5-0.6 inappropriate
0.7-0.8 general ≤0.5 unearthly
Table 3. KMO and Bartlettʼs Test of Sphericity results
KMO test Bartlettʼs test
KMO
DF P
0.788 3979.79122968 78 0.000
Table 2. Suitability of Factor Analysis
each factor can be obtained and reported in Table 5. Then, According to the factor score, taking Variance contribution rate of each of the main factors as the weight proportion of the to- tal variance contribution rate of re-weighted aver- age, a comprehensive evaluation model will be developed:
F= 0.6014 F1+ 0.1856 F2+ 0.1104 F3+ 0.1025 F4
F indicates logistics composite situation score, F1-F4 factors represented by the factor scores
calculated by Factor score function. With higher score of F, it means more higher the level of lo- gistics situation.
Thirdly, to estimate the panel model with fixed effect, the following steps can be followed.
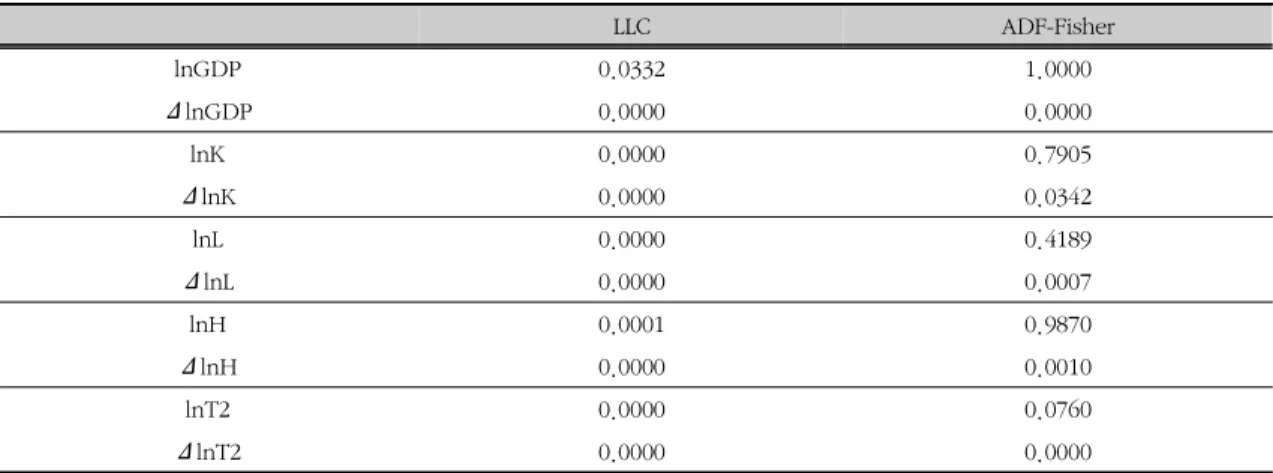
Step 1 is to check whether the series is sta- tionary. As shown in Table 6, Δln value is less than 0.05, so all variables are stationary after taking first difference. LLC, ADF-Fisher unit root tests provided in Eviews 6.0 are applied.
In step 2, From the Table 7, in the test result, P value is less than 0.05, also in Table 8, p val-
system Sub-system indicators
logistics indicators
F1: Industry Indicators X1; X2 X3 X4 X7 X5 X6 X8 X11
F2: Infra Indicators X12 X13
F3: Development Indicators X9
F4: Human Indicators X10
Table 5. Factor Score Coefficient
variables F1 F2 F3 F4
X1 0.15235 0.02215 0.04307 -0.24912
X2 0.04456 0.13608 0.14313 -0.12097
X3 0.03539 0.16839 0.09601 0.12892
X4 0.13171 -0.07201 -0.03252 0.50368
X5 0.23874 0.04487 -0.15258 -0.00822
X6 0.07765 -0.22307 0.26806 0.1906
X7 -0.18203 -0.09204 0.63897 -0.1974
X8 0.25601 0.01528 -0.14674 -0.05414
X9 0.20866 -0.22022 -0.35178 -0.27228
X10 -0.05271 0.075 -0.05709 0.53401
X11 0.35433 -0.19029 -0.23621 -0.02819
X12 -0.08405 0.42285 -0.14187 0.16798
X13 0.00863 0.3074 -0.04915 -0.17376
Table 4. The Evaluation Indicator System
ue is 0 means the impact of logistics to econom- ic is significance and positive. Co-integration test is conducted to investigate long term relationship between variables, which is reported in Table 7 and Table 8. As indicated by Kao residual co-in- tegration test and Pedroni Residual Co-integration Test, a long term equilibrium relationship is sug- gested between logistics development and eco- nomic growth.
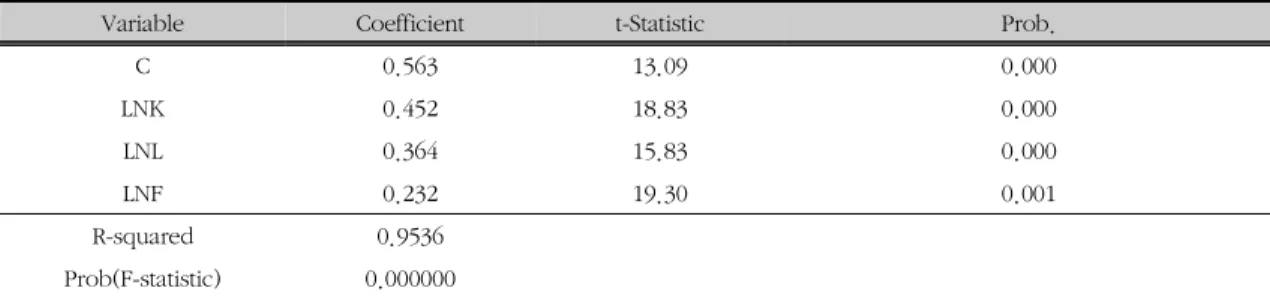
Step 3 is to estimate a pooled regression mod- el as a benchmark model. From Table 9, the co-
efficient of variable F and GDP is 0.232 which means when logistics development increases 1 unit; the total GDP will increase 1.232 units. It is clearly seen that all inputs involving capital, labor and logistics have significant and positive contribution to economic growth, which is re- flected by the corresponding p-values. Moreover, the economy presents a slight effect of increasing return to scale because the sum of all co- efficients except constant is more than one.
LLC ADF-Fisher
lnGDP 0.0332 1.0000
ΔlnGDP 0.0000 0.0000
lnK 0.0000 0.7905
ΔlnK 0.0000 0.0342
lnL 0.0000 0.4189
ΔlnL 0.0000 0.0007
lnH 0.0001 0.9870
ΔlnH 0.0000 0.0010
lnT2 0.0000 0.0760
ΔlnT2 0.0000 0.0000
Table 7. Kao Residual Co-integration Test
t-Statistic Prob.
ADF -4.645937 0.0000
Table 8. Pedroni Residual Co-integration Test Weighted
Statistic Prob. Statistic Prob.
Panel PP-Statistic -11.00300 0.0000 -14.50906 0.0000
Panel ADF-Statistic -5.235763 0.0000 -8.177906 0.0000
Table 6. Results of unit root test and co-integration test
The following step is to estimate the panel da- ta model. Before estimating the model, to decide between fixed or random, we use the Hausman test where the null hypothesis is that the pre- ferred model is random effects vs. the alternative the fixed effects. The test result is given in Table 10. According to the p-value (smaller than 0.05), a fixed effects model rather than a random-
effects model is suggested. Then, a panel data model with fixed effect is estimated and reported in Table 11. From this table, we find that the coefficient of logistics development is 0.494, which is positive and significant meaning the impact of logistics development on economic growth is sig- nificance and positive. Moreover, from the per- spective of elasticity, one unit change in logistics
Variable Coefficient t-Statistic Prob.
C 0.563 13.09 0.000
LNK 0.452 18.83 0.000
LNL 0.364 15.83 0.000
LNF 0.232 19.30 0.001
R-squared 0.9536
Prob(F-statistic) 0.000000
Table 10. Results of Hausman test
Variable (b)FE (B) RE
C 0.643 0.582
LNK 0.537 0.553
LNL 0.465 0.467
LNF 0.104 0.049
Prob>chi2 = 0.000000
Table 11. Fixed-effects model
Variable Coefficient t-Statistic Prob.
C 0.582 12.90 0.000
LNK 0.553 19.75 0.000
LNL 0.467 16.10 0.000
LNF 0.494 35.30 0.001
R-squared 0.9637
Prob> chi2 = 0.000000
Table 9. linear regression results
development will result in 0.494 unit changes in economic growth. Compared the contribution of labor and logistics development to economic growth, it is clear that logistics development is more substantial.
Finally, to investigate the disparities of the im- pact of logistics network on economic growth, a cross-region analysis is also performed in this research. Though the development of modern lo- gistics is going into the rapid growth stage in China recent years, China logistics network is still in the primary modern logistics. Some provinces like Hubei, Hena which is located inland is low- er intensification, specialization and standardization compared with modern logistics in coastal devel- oped area like Shanghai, Zhejiang province. To identify the impact of logistics on economic growth across regions, we classify the provinces into 4 regions (see Figure 1) based on their geo- graphical location, as we all know one of the basic characteristics of the Chinese economy is unequal development across regions: the devel- oped eastern coastal region, the developing cen- tral region, and the lagging western region. The classification is preferred for the reason that there is a significant difference in growth rates and lo- gistics network between the coastal provinces and interior provinces and on average, coastal region is better than interior region and others
regions:
1. Eastern Region: Beijing, Tianjin, Hebei, Shang- hai, Jiangsu, Zhejiang, Fujian, Shandong, Guang- dong and Hainan.(see Figure 1: region 1) 2. Northeast Region: Liaoning, Jilin and Hei-
longjiang. (see Figure 1: region 2)
3. Middle Region: Shan-xi, Anhui, Jiangxi, Henan, Hubei and Hunan.(see Figure 1: region 3) 4. West Region: Inner Mongolia, Guangxi, Chong-
qing, Sichuan, Guizhou, Yunnan, Tibet, Shaanxi, Gansu, Qinghai, Ningxia and Xin- jiang.(see Figure 1: region 4)
The cross-region estimation coefficient for lo- gistics development is shown in Table 12. lNF means the comprehensive development level in this area and then Checked the relationship of it with GDP of China, from the table, P value is less than 0.05, the coefficient of East Region be- tween GDP is 0.526, which means logistics de- velopment has the highest contribution to eco- nomic growth in the eastern region, followed by the northeast region, middle region, and the low- est contribution appears in the western region. It seems that Chinese government should make right policy for western China and be helpful to reduce regional inequality.
Fortunately, in recent years, the government takes some measures to deal with the problem
Variable Coefficient Prob.
LNF ER 0.526 0.000
LNF NR 0.195 0.028
LNF MR 0.136 0.002
LNF WR 0.124 0.005
<Table 12> Comparison of regions fixed effects model
of regional inequality, among which, to develop logistics systems in Western and Central China is an important action. According to the sequences of introduction in each provinces, the level of economic development has presents the differ- ence in each province. With the economic glob- alization and information of today, each province in China must pay attention to the advantage of the favorable development of logistics to seize the opportunity to achieve the economic catch-up strategy for this century.
Ⅵ. Conclusions
This paper provided more detailed insights in-
to the significance of logistics network to eco- nomic growth based on the data of 31 provinces of China from 2003 to 2012 for using a compre- hensive model. According to the results of factor analysis results, for operating evaluation model, logistics composite situation score F can be ob- tained to present the comprehensive assessment of each 31 province about the level of their lo- gistics network. On the other hand, following the panel data analysis, the impact of logistics devel- opment on economic growth is significance and positive, while compared the contribution of la- bor and logistics development to economic growth, it is clear that logistics development is more substantial.
Moreover, as there are many provinces in
Figure 1. Map of Chinese economic regions
China, the level of logistics development also dif- ferent with each other, according to the analysis, we found that the logistics development has the highest contribution to economic growth in the eastern region, followed by the northeast region, middle region, and the lowest contribution ap- pears in the western region. It appears that Chinese government should make focused policy for western part of China and to reduce regional in- equality between east and western part of China.
while, high logistics ability encourages better re- gional economic cooperation. Improve- ment of regional logistics ability in China will cut down logistics costs and enhance intra-regional trade and other activities.
The policy implication for other nations, in particular for developing nations, is logistics net- work should be regarded as an important driving force for economic development, and investment should be made in advance to achieve the best efficiency in economic development and planning.
More research is needed to investigate how ra- tionally and effectively to allocate public re- sources in view of Chinaʼs government among different types of factors related to logistics net- work, so get the improvement of economic in each regions.
References
Akaike, H.(1978),“Factor analysis and AIC,ˮ Psycho- metrika, 52(3), 317-332.
Banister, D. and Berechman, Y.(2001),“Transport in- vestment and the promotion of economic growth,ˮ Journal of Transport Geography, 9(3), 209-218.
Banister, D. and Thurstain-Goodwin, M.(2011),“Quanti- fication of the non-transport benefits resulting from rail investment,ˮ Journal of Transport
Geography, 19(2), 212-223.
Bose, N. and Haque, M.E.(2005),“Causality between public investment in transport and communica- tion and economic growth,ˮ Journal of Econo- mic Development, 30(1), 95.
Bosworth, B.P. and Triplett, J.E.(2000),“Whatʼs new about the new economy? IT, economic growth and productivity[R],ˮ Brookings Institution, Mimeo.
Cai, D.P.(2006),“Statistical analysis of the modern lo- gistics industry and the national economy,ˮ Logistics, 21(1), 74–75.
Chen, X.(2010),“Empirical Analysis on the Relationship between Development of Modern Logistics and Economic Growth in Zhuhai,ˮ In ICLEM 2010@
sLogistics For Sustained Economic Develop- ment: Infrastructure, Information, Integration (pp.3741-3745). ASCE.
Datta, A. and Agarwal, S.(2004),“Telecommunications and economic growth: a panel data approach,ˮ Applied Economics, 36(15), 1649-1654.
Demurger, S.(2001),“Infrastructure development and economic growth: An explanation for regional disparities in china?ˮ Journal of Comparative Economics, 29(1), 95-117.
Deng, T.(2013),“Impacts of transport infrastructure on productivity and economic growth: Recent ad- vances and research challenges,ˮ Transport Re- views, 33(6), 686-699.
Ding, L., Haynes, K. E. and Liu, Y.(2008),“Telecom- munications infrastructure and regional income convergence in china: Panel data approaches,ˮ The Annals of Regional Science, 42(4), 843- 861.
Fleisher, B.M. and Chen, J.(1997),“The coast–non- coastal income gap, productivity, and regional economic policy in China,ˮ Journal of Compa- rative Economics, 25(2), 220-236.
Goh, M. and Ling, C.(2003),“Logistics development in china,ˮ International Journal of Physical Distri- bution & Logistics Management, 33(10), 886- 917.
Gunasekera, K., Anderson, W. and Lakshmanan, T.
(2008),“Highway-induced development: Evidence from srilanka,ˮ World Development, 36(11), 2371-2389.
Hong, J., Chu, Z. and Wang, Q.(2011),“Transport in-
frastructure and regional economic growth:
Evidence from China,ˮ Transportation, 38(5), 737-752.
Hooi Lean, H., Huang, W. and Hong, J.(2014),“Logis- tics and economic development: Experience from china,ˮ Transport Policy, 32, 96-104.
Hui, L.(2011),“The construction of country tourism se- curity system in the counties of minority under the background of balance urban and rural de- velopmen,ˮ Journal of Anhui Agricultural Sciences, 1, 152.
Jiang, B. and Prater, E.(2002),“Distribution and logis- tics development in China: The revolution has begun,ˮ International Journal of Physical Distri- bution & Logistics Management, 32(9), 783-798.
Jiwattanakulpaisarn, P., Noland, R.B. and Graham, D.J.
(2011),“Highway infrastructure and private output: Evidence from static and dynamic pro- duction function models,ˮ Transport metrica, 7(5), 347-367.
Khadaroo, J. and Boopen S.(2008),“Transport and economic performance: The case of Mau- ri- tius,ˮ Journal of Transport Economics and Policy(JTEP), 42(2), 255-267.
Lakshmanan, T.(2011),“The broader economic con- sequences of transport infrastructure invest- ments,ˮ Journal of Transport Geography, 19(1), 1-12.
Ledesma, R.D. and Valero-Mora, P.(2007),“Determining the number of factors to retain in EFA: an easy-to-use computer program for carrying out Parallel analysis,ˮ Practical Assessment, Research
& Evaluation, 12(2), 1-11.
Levin, A., Lin, C. and James Chu, C.(2002),“Unit root tests in panel data: Asymptotic and finite- sam- ple properties,ˮ Journal of Econometrics, 108 (1), 1-24.
Liu N. and Li Y.(2007),“Interaction between Logistics Develop- ment and Economic Growth in China,ˮ Journal of Industrial Engineering and Engineering Management, 1, 156-159.
Liu, L.Z.(2012),“Analysis of the relationship between Qinhuangdao port logistics and economic growth,ˮ Advances in Information Sciences & Service Sciences, 4(4).
Lu, C.S. and Yang, C.C.(2007),“An evaluation of the
investment environment in international logistics zones: A Taiwanese manufacturerʼs perspective,ˮ International Journal of Production Economics, 107(1), 279-300.
Madden, G. and Savage, S.J.(2000),“R&D spillovers, information technology and telecommunications, and productivity in ASIA and the OECD,ˮ Information Economics and Policy, 12(4), 367- 392.
Mody, A. and Wang, F.(1997),“Explaining industrial growth in coastal China: Economic reforms and what else?ˮ The World Bank Economic Review, 11(2), 293-325.
Ozbay, K., Ozmen-Ertekin, D. and Berechman, J.
(2007),“Contribution of transportation invest- ments to county output,ˮ Transport Policy, 14(4), 317-329.
Rietveld, P.(1994),“Spatial economic impacts of trans- port infrastructure supply,ˮ Transportation Research Part A: Policy and Practice, 28(4), 329-341.
Röller, L. and Waverman, L.(2001),“Telecommunications infrastructure and economic development: A si- multaneous approach,ˮ American Economic Re- view, 909-923.
Sahoo, P., Dash, R. K. and Nataraj, G.(2010),“Infra- structure development and economic growth in China,ˮ Mihama Ward: Institute of Developing Economies, JETRO
Shao, Y.(2010),“An application of spatial-panel analy- sis-provincial economic growth and logistics in China,ˮ Annals of the University of Petrosani Economics, 10(2).
Shao, Y. and Zheng, J.(2010),“An applied research on the relations between regional economic growth and regional logistics in China,ˮ Romanian Eco- nomic Journal, 13(38).
Shirley, C. and Winston, C.(2004),“Firm inventory be- havior and the returns from highway infra- structure investments,ˮ Journal of Urban Econo- mics, 55(2), 398-415.
Thurstone, L.L.(1931),“Multiple factor analysis,ˮ Psycho- logical Review, 38(5), 406-427.
Wang, A.(2010),“Research of logistics and regional economic growth,ˮ I-Business, 2(4), 395.
Wang, Y.(2010),“Empirical research on the effects of
logistics industry on economic,ˮ I-Business,
2(1).
Wang, Y. and Wang, L.(2010),“The economic growth effect of logistics industry FDI analysis,ˮ I-Business, 2(4).
Yang, S. and Jianguo, Z.(2011),“The panel co-in- tegration analysis between the logistics industry and economics growth in China,ˮ International Business & Management, 2(2).
Zhang, Z. and Figliozzi, M.A.(2010),“A survey of Chinaʼs logistics industry and the impacts of transport delays on importers and exporters,ˮ Transport Reviews, 30(2), 179-194.
Zheng, M.(2009),“Empirical Study on the Relationship
between Regional Logistic Capability and Eco-
nomic Growth in Guangdong [J],ˮ Innovation
Economic Management Journal, 11.
중국의 물류네트워크 및 경제발전