Economic Evaluation of Coupling APR1400 with a Desalination Plant in Saudi Arabia
15
0
0
전체 글
(2)
(3)
(4)
(5)
(6)
(7)
(8)
(9)
(10)
(11)
(12)
(13)
(14)
(15)
수치
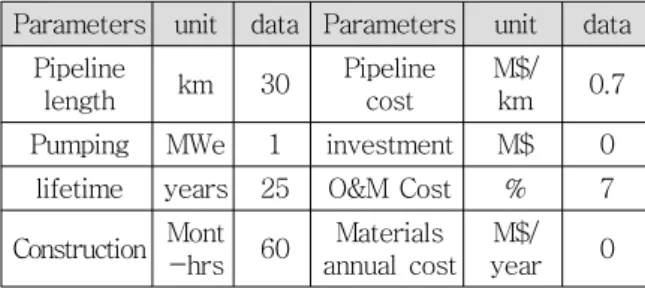
![Figure 3. facility shows an example of coupling between the MSF and the NPP, along with an intermediate heat exchanger (termed ‘reboiler’) as an additional isolation loop [1].](https://thumb-ap.123doks.com/thumbv2/123dokinfo/4816581.523723/5.892.475.774.151.333/figure-facility-coupling-intermediate-exchanger-reboiler-additional-isolation.webp)
관련 문서
Na, Prediction of Hydrogen Concentration in Nuclear Power Plant Containment under Severe Accidents using Cascaded Fuzzy Neural Networks, Nuclear Engineering
In SCP, a solar collector field is con- nected to a conventional distillation plant to provide thermal energy for the desalination process because fossil fuel is not
Owing to nuclear power plant data characteristics such as nonlinear, time sequential and multivariate, in this light, this thesis aims at proposing an
The estimated capital cost for a chemical plant using the study estimate method (Class 4) was calculated to be $2 million.. If the plant were to be built, over what range
Liquid radioactive waste system of a nuclear power plant is to remove the radioactive material collects various equipment and floor drainage, including
– Total project cost is not known before construction begins – Less owner input: Owner struggles to keep
flexibility required during construction would be the most critical issues.. 401.649 Cost Planning for Construction Projects
The philosophy behind the Symbiosis is that the six companies: Energy E2 Asnæs Power Station, the plasterboard factory BPB Gyproc A/S, the pharmaceutical plant Novo Nordisk
