1) Graduate Student, Department of Construction and Disaster Prevention Engineering, Kyungpook National University 2) Assistant Professor, Department of Agricultural Civil Engineering, Kyungpook National University
Assessment of Soil Erosion Loss by Using RUSLE and GIS in the Bagmati Basin of Nepal
Shiksha Bastola1)・ Yeon Jeong Seong1)・ Sang Hyup Lee1)・ Yongchul Shin2)・ YounghunJung† Received: October 1st, 2018; Revised: October 8th, 2018; Accepted: February 15th, 2019
ABSTRACT : This study attempted to study the soil erosion dynamic in the Bagmati Basin of Nepal. In this study, an inclusive methodology that combines Revised Universal Soil Loss Equation (RUSLE) and GIS techniques was adopted to determine the distribution of soil loss in the study basin. As well, this study attempts to study the intensity of soil erosion in the seven different land use patterns in the Bagmati Basin. Soil loss is an associated phenomenon of hydrologic cycle and this dynamic phenomenon possesses threats to sustainability of basin hydrology, agriculture system, hydraulic structures in operation and overall ecosystem in a long run. Soil conservation works, and various planning and design of watersheds works demands quantification of soil loss. The results of the study in Bagmati Basin shows the total annual soil loss in the basin is 22.93 million tons with an average rate of 75.83T/ha/yr. The computed soil loss risk was divided into five classes from tolerable to severe and the spatial pattern was mapped for easy interpretation. Also, evaluation of soil loss in different land use categories shows barren area has highest rate of soil loss followed by agriculture area. This is a preliminary work and provides erosion risk scenario in the basin. The study can be further used for strategic planning of land use and hydrologic conservation works in a basin.
Keywords : Revised Universal Soil Loss Equation, Soil conservation, Soil loss, Land use, Nepal
ISSN 1598-0820 DOI https://doi.org/10.14481/jkges.2019.20.3.5 Journal of the Korean Geo-Environmental Society
20(3): 5~14. (March 2019) http://www.kges.or.kr
1. Introduction
Nepal occupies a large part of central Himalayas, and more than 80% of the land area is mountainous and still tectonically active (Shrestha, 1997). In the world map on the status of human-induced soil degradation (UNEP/ISRIC, 1990;
Shrestha, 1997), deforestation, removal of natural vegetation and overgrazing are reported to be the main reasons for loss of topsoil and terrain deformation due to soil erosion in the mountainous regions of Nepal. Owing to mountainous topo- graphy, natural phenomena like earthquakes, intensive rains and glacial lake outburst flooding makes cases of soil erosion even more susceptible (Shrestha, 1997).
Soil is an important natural asset having direct impact on food production, drinking water quality, biodiversity and various other ecosystem services. Soil loss due to rapid industrialization, forest fires, artificial pasturing, agricultural activities, etc., has been on the increase worldwide (Terranova et al., 2009). Every year, 25-40 billion tons surface soils are removed globally due to soil erosion, causing approximately 400 billion dollars’ worth of direct economic losses, such
as declines in crop production (FAOUN, 2015; Montanarella, 2015). Increment of soil loss also enhances phenomenon like landslides, collapse of banks, flood and draughts. The severe and frequent precipitation events occurring as an impact of climate change further exacerbates the scenario of soil loss (Nearing et al., 1989; Li et al., 2011).
Assessment of spatial intensity of soil erosion is helpful in strategic planning of soil conservation works (Bhattarai, 2013). Empirical and physical-based models are available for computation of soil loss. Empirical models are regression or lumped mathematical models, which are developed using the experimental data of plot studies on erosion by water. Models like Universal Soil Loss Equation (USLE) (Wischmeier &
Smith, 1978), Revised Universal Soil Loss Equation (RUSLE) (Renard et al., 1991), Chemical Runoff and Erosion from Agricultural Management Systems (CREAMS) (Knisel, 1980), etc are an example of empirical models. Theoretically, physically based models like Water Erosion Prediction Project WEEP (Nearing et al., 1989), Kinematic Runoff and Erosion Model (KINEROS) MODEL etc. have better performance compared to empirical model as they can be combined with physically
Fig. 1. Location of basin in the map of Nepal
Fig. 2. Slope map of the basin based hydrological models. Physical models are intended to
represent the essential mechanisms controlling erosion and sediment transport mechanisms. They have better performance than empirical models, but the cost of computation is high, and they require a large amount of input data at high spatial resolution (Jha & Paudel, 2010; Rabia, 2012).
Among various models for soil loss assessment, the most commonly used erosion model is the Universal Soil Loss Equation (USLE) and its revised version RUSLE. These models estimate long term average annual soil loss by sheet and rill erosion and the soil loss caused by (ephemeral) gully erosion is not predicted by RUSLE. Despite some shortcomings, RUSLE is still widely used model at large scales due to its data simplicity and its provision of basis for carrying out scenario analysis and taking measures against erosion (Lu et al., 2003). In Nepal also, many studies have used the USLE and RUSLE model to assess soil losses at larger watershed scales. Soil erosion dynamics in Koshi Basin of Nepal has been studied by using RUSLE for assessment of priority areas for conservation. Likewise, RUSLE has been successfully used to assess soil loss rates and the spatial erosion pattern in the Triyuga, Kulekhani and Kalchi Khola watersheds.
Owing to satisfactory results from the previous studies, in this study we have used RUSLE model together with GIS.
The main objective of this study is the basin wide study of erosion dynamics in consort with determination of soil loss according to land use in the Bagmati Basin of Nepal. The evaluation of soil loss is crucial for soil conservation works and hence also for preservation of various ecosystem services correlated with it.
2. Materials and Method
2.1 Study area
For the study, Bagmati basin of Nepal is selected. The basin lies at middle mountain region of Nepal at latitude 26°42´ to 27°50´ N and longitude 85°22´ to 85°58´E with a total area of 3,750 km2 (Fig. 1). The area of the basin considered for this study is 3,054.23 km2 based on data availability. The Bagmati river originates from north of capital city Kathmandu at Shivapuri (Bagdwar) at an altitude of 2,690 m and drains out of Nepal across the Indian state of Bihar to reach the Ganges. The elevation difference of basin
from valley floors to mountain summits results in bio-climatic diversity and interrelated land use changes having influence on soil erosion, which is considered typical for middle mountains of Nepal (Bhattarai, 2013). The annual average rainfall in the basin is about 1,700 mm. Bagmati basin is one of the most important basins in terms of socio-economic activities in Nepal as it drains from capital city Kathmandu.
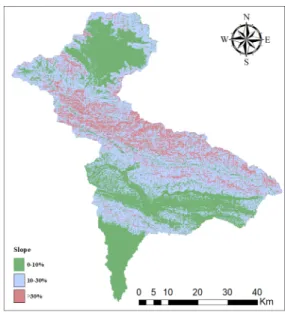
The elevation of the basin varies from 78 m to as high as 2,872 m from sea level. The basin can be divided into three area as the upper, middle and lower Bagmati watershed areas. The upper part of basin covers the whole of Kathmandu valley. Lower part of the basin is comparatively flat than upper and middle part. Of the study area, 39% area is relatively flat with a slope of 0-10%. About 47.5% of the area has mild slope ranging from 10-30% and 13.5% of area contains high slope with slope value greater than 30%. Fig.
2 represents slope map in the basin.
Fig. 3. Distribution of land use in the basin
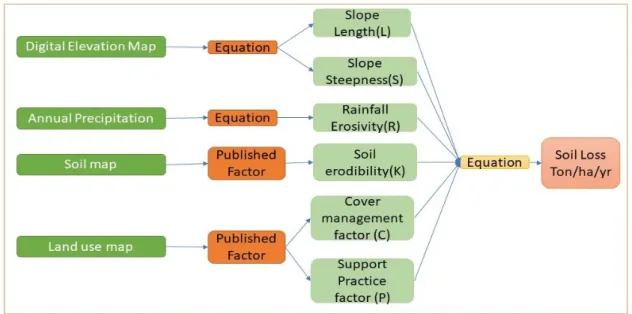
Fig. 4. RUSLE data preparation Likewise, according to land use map, land use is observed
to be mixed type. Cultivated land is dominant in upper part of basin whereas in middle and lower part of basin, forest is dominant. As the capital city lies in upper part, most of built up area of basin is concentrated on upper part. Of the total study area, 63.5% of the area is covered by forest and 25.5% of area by agriculture. Built up area represents nearly 6% of area while barren area is 2.6% of area. Fig. 3 shows detail distribution of land use in Bagmati Basin.
2.2 Revised Universal Soil Loss Equation (RUSLE) model
Revised Universal Soil Loss Equation (RUSLE) model
along with GIS is used to compute soil loss in the study basin. RUSLE is modified version of Universal Soil Loss Equation (USLE) model, and is one of simplified erosion prediction model, widely used to predict soil erosion from hillslopes. The model uses a combination of geo-physical and land cover factors to estimate the likely annual soil loss from a unit of land. The USLE was initially applied to the quantification of soil loss to support decisions on agricultural land management in the USA. The RUSLE, like its predecessor the Universal soil loss equation, quantifies the soil erosion as the product of six factors representing rainfall erosivity (R), soil erodibility (K), slope length (L), slope steepness (S), cover and management practices (C) and supporting conservation practices (P). The required data were prepared with DEM, soil map, land use map, meteorological data and various literatures (Fig. 4). Separate raster layers for each factor were prepared in GIS and the average annual soil erosion rate was determined by multiplying the respective factors in ArcGis environment. The RUSLE Eq. (1) is as follows:
A R K L S C P= × × × × × (1)
Where, A = average annual soil loss amount in (Mg/ha/yr) R = Rainfall-runoff erosivity factor (MJ mm/h/ha/yr) K = Soil erodibility factor (Mg hr/MJ mm) L = slope length factor
S = Slope steepness factor
C = Land cover management factor P = Support practice factor
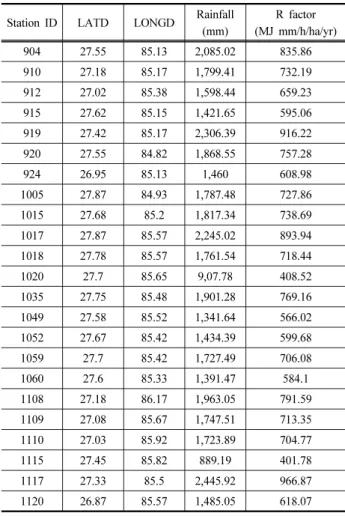
Table 1. Details of precipitation data Station ID LATD LONGD Rainfall
(mm)
R factor (MJ mm/h/ha/yr)
904 27.55 85.13 2,085.02 835.86
910 27.18 85.17 1,799.41 732.19
912 27.02 85.38 1,598.44 659.23
915 27.62 85.15 1,421.65 595.06
919 27.42 85.17 2,306.39 916.22
920 27.55 84.82 1,868.55 757.28
924 26.95 85.13 1,460 608.98
1005 27.87 84.93 1,787.48 727.86
1015 27.68 85.2 1,817.34 738.69
1017 27.87 85.57 2,245.02 893.94
1018 27.78 85.57 1,761.54 718.44
1020 27.7 85.65 9,07.78 408.52
1035 27.75 85.48 1,901.28 769.16
1049 27.58 85.52 1,341.64 566.02
1052 27.67 85.42 1,434.39 599.68
1059 27.7 85.42 1,727.49 706.08
1060 27.6 85.33 1,391.47 584.1
1108 27.18 86.17 1,963.05 791.59
1109 27.08 85.67 1,747.51 713.35
1110 27.03 85.92 1,723.89 704.77
1115 27.45 85.82 889.19 401.78
1117 27.33 85.5 2,445.92 966.87
1120 26.87 85.57 1,485.05 618.07
2.3 Description and computation of RUSLE para- meter
2.3.1 Rainfall-runoff erosivity factor (R)
Rainfall is one of primary cause of soil erosion. Precipitation is known to be driving factor of erosion as it has direct impact on the detachment of soil particles, the breakdown of aggregates and the transport of eroded particles via runoff (Panagos et al., 2015). The R-factor is a multi-annual average index that measures rainfall’s kinetic energy and intensity to describe the effect of rainfall on sheet and rill erosion at a geographical location. It is estimated from the annual summation of storm rainfall energy multiplied by the maximum intensity in a 30 min interval (Toy & Foster, 1998). Compu- tation of R-factor needs recording of precipitation at short time intervals (1-60min) for a period of several years which makes its complex in data sparse country like Nepal. Many literatures have proposed several alternative rainfall erosivity indices to corelate soil loss for particular locations and scales. Thus, Singh (Singh et al., 1981) approach recommended for Himalayan region is referred in this study which states
R = 79 + 0.363P (2)
Where, R = rainfall erosivity factor (MJ mm ha-1hr-1yr-1) P = mean annual precipitation in mm.
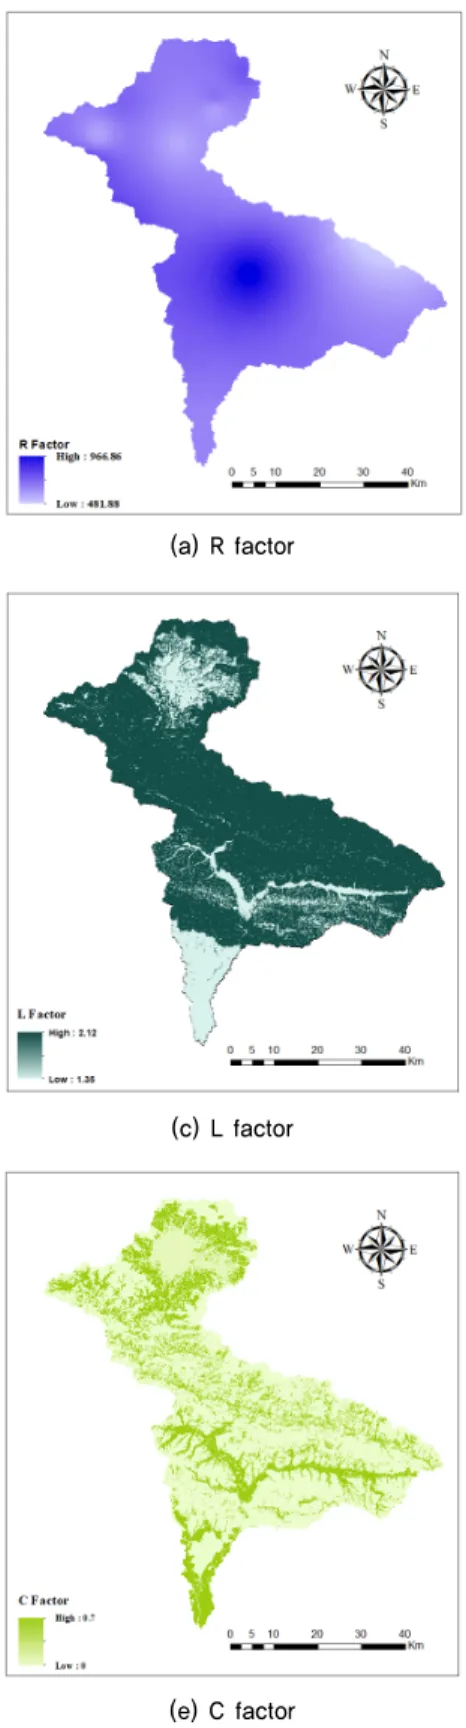
In this study R factor is computed with rainfall data from 23 rain gauge stations within and around the basin (Table 1). The data is collected from department of hydrology and meteorology, Nepal. The annual rainfall of the basin is 1,700 mm. R factor is calculated with Eq. (2) and the inverse distance weighing method of interpolation is used to prepare the R factor raster map of basin. The computed R factor along with rain stations detail shown in Table 1. The value of R factor ranges from 481.88 to 966.87 MJ mm/h/ha/yr with average value of 713.80 MJ mm/h/ha/yr. Fig. 5 (a) shows spatial distribution of R factor in the basin.
2.3.2 Soil erodibility factor (K)
The soil erodibility factor (K) represents the susceptibility of soil particles to detachment and transport by rainfall and runoff (Lane et al., 1992). K is a function of distribution of particle sizes, organic matter content, and the structure and permeability of the soil or surface material. (14) For a particular soil, the soil erodibility factor is the rate of erosion per unit erosion index from a standard plot. The K factor of the basin is estimated based on the soil types described by Food and Agriculture Organization (FAO) database adapted to Nepal by World Soil Information (ISRC). Using GIS, soil unit map of basin is extracted from SOTER database of Nepal and it is found that major soil types are Chromic Cambisols, Eutric Cambisols and Chromic Luvisols. The soil erodibility factor (K) is computed from different published literature on mountain areas (Gardner & Gerrard, 2003; Jain et al., 2001) and other countries (Voprovil et al., 2007). The K factor in the basin varies from 0.19 to 0.49 with average value of 0.28. The soil erodibility factor map is prepared in GIS map and is presented in Fig. 5 (b).
2.3.3 Slope Length factor (L)
The slope length factor (L) represents the effect of slope length on erosion. For a uniform slope with finite length, the flow accumulation and erosion increase linearly as the slope length increases (Zingg, 1940; Wischmeier & Smith,
(a) R factor (b) K factor
(c) L factor (d) S factor
(e) C factor (f) P factor
Fig. 5. Factors for RUSLE computation 1978; McCool et al., 1981). The relationship between the
length of flow accumulation and soil erosion can be directly established based on the slope length. The slope length factor (L) is the ratio of field soil loss to the corresponding soil loss from a 22.13 m length on the same soil type and gradient and is estimated by Eq. (3):
(3)
Where λ indicates a field slope length and 22.13 is the slope length of a unit runoff plot (m). α = slope length exponent and value is between 0.2 and 0.5.
The field slope length λ is taken as the DEM grid size 100 m and thus the slope length factor was calculated as Eq. (4):
(4)
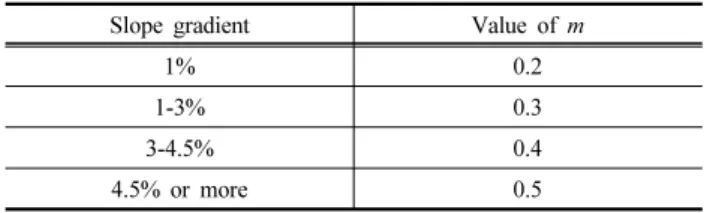
Fig. 5 (c) shows the spatial distribution of the slope length factor in the study basin. The determination of m for different slopes have been described by Wischmeier and Smith and has been applied in the Indian subcontinent (Singh et al., 1981; Jain et al., 2001). Here, in this study, value of m is taken based on slope gradient and determined using slope map as input (Table 2).
Table 2. Value of m for different slope gradients
Slope gradient Value of m
1% 0.2
1-3% 0.3
3-4.5% 0.4
4.5% or more 0.5
2.3.4 Slope steepness factor (S)
Slope steepness factor (S) represents the effect of slope steepness on intensity of soil erosion. Slope steepness has more impact on soil loss than slope length. S factor is the ratio of soil loss from the field gradient to that from a 9%
slope under otherwise identical conditions. Density of vegetation cover and soil particle size also influences the relationship of soil loss and gradient. The S factor is calculated using Eq. (5) as described by Wischmeier and Smith (Wischmeier
& Smith, 1978).
∙ ∙ (5)
Where, slope = slope in percent
Fig. 5 (d) shows the spatial distribution of the slope steepness factor in the study area.
2.3.5 Cover management factor (C)
The cover management factor (C) represents the effect of surface vegetation cover on rates of soil loss at a particular site compared to loss under tilled, continuous fallow conditions.
(22). After topography, vegetation cover is the significant factor controlling soil erosion risk. (20). The cover factor introduces the variable influence of vegetation density and types, which ultimately reflect the erosion on protected and non-protected areas. C factor is generated through different techniques like land use/land cover-based arbitrary value (CLULC), Normalised Different Vegetation Index-based methods CNDVI1 and CNDVI2 and Modified Soil Adjusted Vegetation Index 2-based method (CMSAVI2) etc. (Vijith et al., 2018). Here, in this study, C value, which depends on land use, was obtained from different published literature (Jha, 2002) in similar area.
The values assigned for different land use in the basin are tabulated in the Table 3. Fig. 5 (e) shows the spatial distri- bution of cover management factor (C) in the study area.
Table 3. Cover management factor (C) based on land use
Land use C factor
Forest 0.01
Shrubland 0.1
Grassland 0.01
Agriculture area 0.42
Barren area 0.7
Water body 0
Built-up area 0.05
2.3.6 Support practice factor (P)
The support practice factor (P) accounts for control practices that reduce the erosion potential of runoff by their influence on drainage pattern, runoff concentration, runoff velocity and hydraulic forces exerted by the runoff on the soil surface (Renard et al., 1991). It is an expression of the overall effects of supporting conservation practices such as contour farming, strip cropping, terracing and subsurface drainage on soil loss at particular site. These practices principally affect water erosion by modifying the flow pattern, grade, or direction of surface runoff and by reducing the volume and rate of runoff. The effectiveness of certain soil erosion control practices varies substantially with local conditions. Based on previous studies (Bhattarai, 2013), value of P factor is taken as 0.5 for agricultural land and for rest of land use, P valuer is assigned to be 1. Fig. 5 (f) shows the spatial distribution of P factor in the study basin.
Fig. 6. Soil loss distribution in the basin
Table 4. OECD standard for soil loss risk classification OECD standard Tolerable Low Moderate High Severe
Soil loss
(Mg/ha/yr) < 6 6-10.9 11-21.9 22-32.9 > 33
Table 5. Soil loss risk classified by the OECD standard Soil loss risk Area (km2) Area (%)
Tolerable 841.16 27.54
Low 415.6 13.61
Moderate 566.34 18.54
High 319.42 10.46
Severe 911.72 29.85
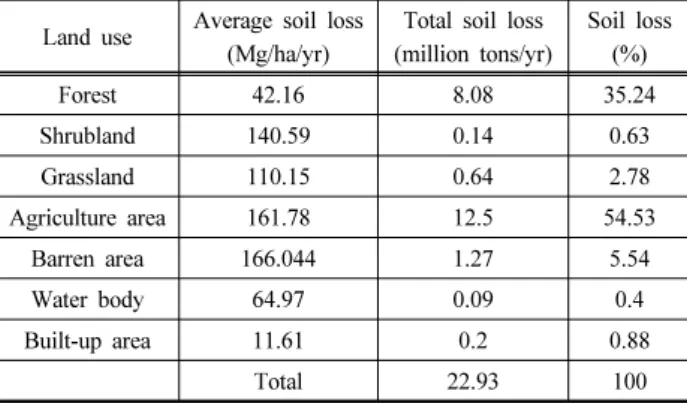
Table 6. Soil loss on each land use Land use Average soil loss
(Mg/ha/yr)
Total soil loss (million tons/yr)
Soil loss (%)
Forest 42.16 8.08 35.24
Shrubland 140.59 0.14 0.63
Grassland 110.15 0.64 2.78
Agriculture area 161.78 12.5 54.53
Barren area 166.044 1.27 5.54
Water body 64.97 0.09 0.4
Built-up area 11.61 0.2 0.88
Total 22.93 100
3. Results and Discussion
After preparation of required parameters of RUSLE in GIS, soil loss map of the basin is prepared. Potential soil loss in the basin ranges from 0 to 9,133.93 Mg/ha/yr with the average value of 75.83 Mg/ha/yr. The total annual soil loss in the basin is computed to be 22.93 million tons. The computed soil loss is divided into five classes as per OECD description where soil loss less than 6 Mg/ha/yr is defined as tolerable, 6-10.9 Mg/ha/yr is defined to be low, 11-21.9 Mg/ha/yr is defined to be moderate, 22-32.9 is defined to be high and more than 33 Mg/ha/yr is defined as severe. Fig.
6 shows total soil loss distribution and its risk classification on the basin. Based on the OECD standard (Table 4), Table 5 shows percentage of severity of soil loss in the basin. Soil loss in this area is classified as “severe”, 30% of the total area by international standards. In particular, soil loss has been found to be serious in northern regions, including Kathmandu, the capital of Nepal. These results are consistent with the land use of the forestation and cultivation, which is the cause of soil loss in the northern part of the area (Fig. 5).
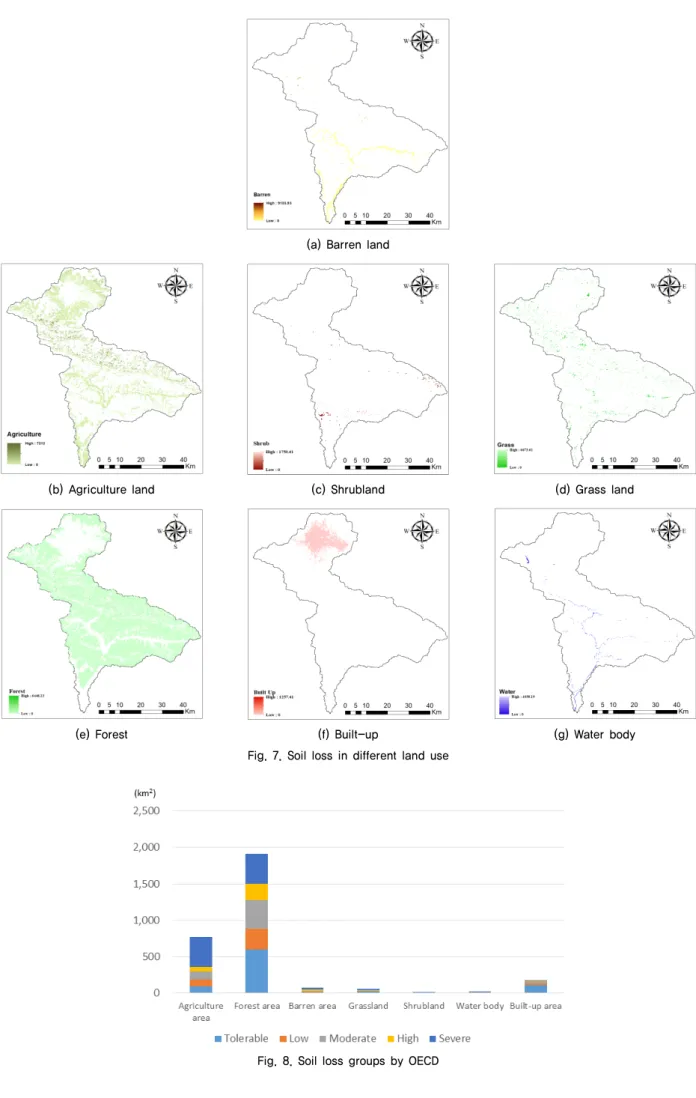
As well, soil loss is studied according to land use. Rate of soil loss is highest from barren area with an average value of 166.04 Mg/ha/yr and lowest from built-up area with an average value of 11.61 Mg/ha/yr (Table 6). The rate of soil
loss from agriculture area is second highest with an average value of 161.78 Mg/ha/yr. Likewise, average rate of soil loss from shrubland, grassland and forest are 140.59 Mg/ha/yr, 110.15 Mg/ha/yr and 42.16 Mg/ha/yr respectively (Fig. 7).
The agriculture area generates highest percentage of soil loss, followed by forest and barren area in the basin. Almost 26%
of total area of basin is covered by agricultural area and the rate of erosion is highest compared to covered area. Estimating soil erosion according to land cover can be a very important factor for soil conservation.
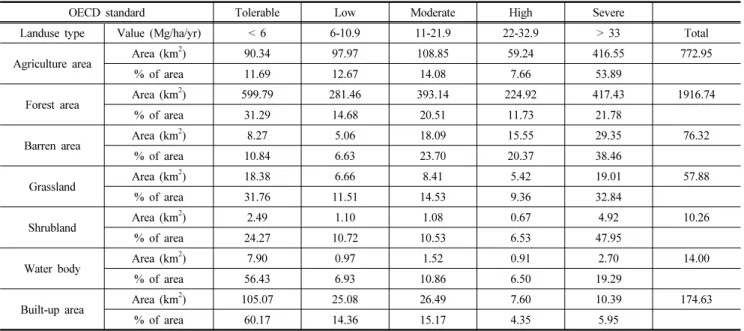
Also, the result shows that 53.89% of total agriculture land possess severe soil loss risk (Table 7 and Fig. 8). Remedial actions to minimize the soil loss from these areas can enhance productivity as well as maintain top soil quality of cultivable land. Agriculture practices of the basin highly determine the total soil loss and the conservation techniques like terracing, agro-foresting, bunding, crop rotation etc. can be effective to minimize the soil loss from the agricultural area of the basin. If preventive measures are not taken on time to prevent present rate of soil erosion from agricultural area then it may lead to soil degradation, ultimately causing cultivable land unfit for cultivation in the future.
(a) Barren land
(b) Agriculture land (c) Shrubland (d) Grass land
(e) Forest (f) Built-up (g) Water body
Fig. 7. Soil loss in different land use
Fig. 8. Soil loss groups by OECD
Table 7. Soil loss risk classified by OECD standard for types of land use
OECD standard Tolerable Low Moderate High Severe
Landuse type Value (Mg/ha/yr) < 6 6-10.9 11-21.9 22-32.9 > 33 Total
Agriculture area Area (km2) 90.34 97.97 108.85 59.24 416.55 772.95
% of area 11.69 12.67 14.08 7.66 53.89
Forest area Area (km2) 599.79 281.46 393.14 224.92 417.43 1916.74
% of area 31.29 14.68 20.51 11.73 21.78
Barren area Area (km2) 8.27 5.06 18.09 15.55 29.35 76.32
% of area 10.84 6.63 23.70 20.37 38.46
Grassland Area (km2) 18.38 6.66 8.41 5.42 19.01 57.88
% of area 31.76 11.51 14.53 9.36 32.84
Shrubland Area (km2) 2.49 1.10 1.08 0.67 4.92 10.26
% of area 24.27 10.72 10.53 6.53 47.95
Water body Area (km2) 7.90 0.97 1.52 0.91 2.70 14.00
% of area 56.43 6.93 10.86 6.50 19.29
Built-up area Area (km2) 105.07 25.08 26.49 7.60 10.39 174.63
% of area 60.17 14.36 15.17 4.35 5.95
4. Conclusion
The RUSLE based approach is used to study the spatial distribution of soil erosion in the Bagmati Basin of Nepal.
Soil erosion is one of serious problem of basin during the monsoon season. Of the total soil loss in the basin, agricultural area marks 54.53%, which obviously demands urgent impro- visation in the agricultural practices of the basin. Soil is an important asset and a limited resource whose formation takes years while degradation can occur rapidly. Soil erosion is attributed by both environmental degradation and an inappro- priate land use practice. Moreover, integration of detail soil series data, finer resolution DEM data and time varying C factor value may improve the accountability of results of the model. Hence, soil erosion map can mark the erosion prone areas and the estimate of soil erosion on a basin scale can be a basis for carrying out sustainable land use management strategies. Also, soil loss map to represent soil conservation, as one of the ecosystem services, will be helpful to assess ecosystem of Nepal.
Acknowledgement
This work was supported by the National Research Foundation of Korea (NRF) grant funded by the Korea government (MSIT) (No. 2018020453).
References
1. Bhattarai, R. (2013), In book: Sediment transport modelling using GIS in Bagmati basin, Nepal, DOI: 10.5772/51449.
2. FAOUN (2015), Food and Agriculture Organization of the United Nations, Status of the World’s Soil Resources, Washington, DC.
3. Gardner, R. A. M. and Gerrard, A. J. (2003), Runoff and soil erosion on cultivated rainfed terraces in the Middle Hills of Nepal, Applied Geography, Vol. 23, Issue 1, pp. 23~45.
4. Jain, S. K., Kumar, S. and Varghese, J. (2001), Estimation of Soil Erosion for a Himalayan Watershed Using GIS Technique, Vol. 15, Issue 1, pp. 41~54.
5. Jha, M. K. and Paudel, R. C. (2010), Erosion predictions by empirical models in a mountainous watershed in Nepal, Journal of Spatial Hydrology, Vol. 10, No. 1.
6. Jha, R. (2002), Potential erosion map for Bagmati basin using GRASS GIS, Proceedings of the open source GIS-GRASS users conference 2002, Trento, Italy.
7. Knisel, W. G. (1980), CREAMS: A field-scale model for chemicals, runoff and erosion from agricultural management systems, U.S.
Department of Agriculture, pp. 327.
8. Lane, L. J., Renard, K. G., Foster, G. R. and Laflen, J. M.
(1992), Development and application of modern soil erosion prediction technology - The USDA experience, Australian Journal of Soil Research, Vol. 30, No. 6, pp. 893~912.
9. Li, Z., Liu, WZ., Zhang, XC. and Zheng, FL. (2011), Assessing the site-specific impacts of climate change on hydrology, soil erosion and crop yields in the Loess Plateau of China. Clim Change 105:223-242.
10. Lu, H., Prosser, I., Moran, C., Gallant, J., Priestley, G. and Stevenson, J. (2003), Predicting sheetwash and rill erosion over the Australian continent, Australian Journal of Soil Research, Vol. 41, No. 6, pp. 1~2.
11. McCool, D. K., Foster, G. R., Mutchler, C. K. and Meyer, L.
D. (1981), Revised slope length factor for the universal soil loss equation, Transactions of the ASAE, Vol. 32, No. 5, pp.
1571~1576.
12. Montanarella, L. (2015), Agricultural policy: Govern our Soils, Nature, Vol. 528, Issue 7580, pp. 32~33.
13. Nearing, M. A., Forster, G. R. and Lane, L. J. (1989), A process- based soil erosion model for USDA water erosion prediction project, Transactions of ASAE, Vol. 32, No. 5, pp. 1587~1593.
14. Panagos, P., Ballabio, C., Borrelli, P., Meusburger, K., Klik, A., Rousseva, S., Tadić, M.P., Michaelides, S., Hrabalíková, M., Olsen, P., Aalto J., Lakatos, M., Rymszewicz, A., Dumitrescu, A., Beguería, S. and Alewell, C. (2015), Rainfall erosivity in Europe, Sci. Total Environ., Vol. 511, pp. 801~814.
15. Rabia, A. H. (2012), GIS Spatial Modeling for Land Degradation Assessment in Tigray, Ethiopia, 8th International Soil Science Congress on Land Degradation and Challenges in Sustainable Soil Management, Çeşme -Izmir, Turkey, Ege University, Vol.
3, pp. 161~167.
16. Renard, K. G., Foster, G. R., Weesies, G. A. and Porter, J.
P. (1991), RUSLE Revised universal soil loss equation, Journal of soil and Water Conservation, Vol 46, No. 1, pp. 30~33.
17. Renard, K. G., Foster, G. R., Weesies, G. A., McCool, D. K.
and Yoder, D. C. (1997), Predicting Soil Erosion by Water:
A Guide to Conservation Planning with the Revised Universal Soil Loss Equation (RUSLE), Agriculture Handbook 703, pp.
403.
18. Shrestha, D. P. (1997), Assessment of soil erosion in the Nepalese himalaya, a case study in Likhu Khola valley, middle mountain region., Land Husbandry, Vol. 2, No. 1, pp. 59~80.
19. Singh, G., Babu, R. and Chandra, S. (1981), Soil loss and
prediction research in India, Central Soil and Water Conservation Research Training Institute (Bulletin No. T-12/D9).
20. Terranova, O., Antronico, R., Coscarelli, R. and Iaquinta, P.
(2009), Soil erosion risk scenarios in the Mediterranean environ- ment using RUSLE and GIS: An application model for Calabria (southern Italy). Geomorphology. 112. 228-245. 10.1016/j.geomorph.
2009.06.009.
21. Toy, T. J. and Foster, G. R. (1998), Guidelines for the use of the Revised Universal Soil Loss Equation (RUSLE), version 1.06 on Mined Lands, Construction Sites and Reclaimed Lands.
In: Joe RG (ed) The Office of Technology Transfer. Western Regional Coordinating Center Office of Surface Mining, Denver.
22. UNEP/ISRIC (1990), World map on status of human induced soil degradation; scale 1:10,000,000. UNEP, Nairobi, Kenya.
23. Vijith, H., Seling, L. W. and Dodge-Wan, D. (2018), Effect of cover management factor in quantification of soil loss: case study of Sungai Akah subwatershed, Baram River basin Sarawak, Malaysia, Geocarto International, Vol. 33, Issue 5, pp. 505~521.
24. Vopravil, J., Janeček, M. and Tippl, M. (2007), Revised soil erodibility K-factor for soils in the Czech Republic, Soil and Water Research, Vol. 2, No. 1, pp. 1~9.
25. Wischmeier, W. H. and Smith, D. D. (1978), Predicting rainfall erosion losses: A guide to conservation planning, The USDA Agricultural Handbook, Washington, D.C, No. 537, pp. 1~58.
26. Zingg, A. W. (1940), Degree and length of land slope as it affects soil loss in runoff, Agricultural Engineering, Vol. 21, Issue 2, pp. 59~64.