INTRODUCTION
Heterogeneity is a key challenge in defining a depressive syn- drome, which is defined in a polythetic and operational man- ner.1-4 According to the fifth edition of the Diagnostic and Sta- tistical Manual of Mental Disorders (DSM-5),5 the diagnostic
criteria for major depressive disorder (MDD) include nine symptoms. MDD is diagnosed when patients present with five or more of these symptoms, one of which should be de- pressed mood or diminished interest lasting for more than two weeks. However, calculating the binomial coefficient of the combinations of symptoms meeting this criterion yields al- most 227 possibilities.1,6 Indeed, depressive sub-syndromes have been identified based on the differing numeric values of possible combinations. In the Rhode Island Methods to Im- prove the Diagnostic Assessment and Service (MIDAS) project, 170 different symptom combinations were identified among 1,566 patients with MDD.6 Furthermore, in the Clinical Re- search Center for Depression (CRESCEND) study involving 853 patients, 119 different symptom combinations were found
Network Analysis of the Symptoms of Depressive Disorders Over the Course of Therapy: Changes in Centrality Measures
Seon-Cheol Park1 , Yaeseul Kim2, Kiwon Kim3, Young Sup Woo4, Jung-Bum Kim5, Eun Young Jang6, Hwa-Young Lee7, Hyeon-Woo Yim8, Byung-Joo Ham9, Jae-Min Kim10, and Yong Chon Park11
1Department of Psychiatry, Inje University Haeundae Paik Hospital, Busan, Republic of Korea
2Department of Psychiatry, Hanyang University School of Medicine, Seoul, Republic of Korea
3Department of Psychiatry, Veteran Health Service Medical Center, Seoul, Republic of Korea
4Department of Psychiatry, The Catholic University of Korea, Yeouido St. Mary’s Hospital, Seoul, Republic of Korea
5Department of Psychiatry, Keimyung University School of Medicine, Daegu, Republic of Korea
6Department of Counselling Psychology, Honam Unviersity College of Humanities and Social Sciences, Gwangju, Republic of Korea
7Department of Psychiatry, Soonchunhyang University Cheonan Hospital, Cheonan, Republic of Korea
8Department of Preventive Medicine, The Catholic University of Korea College of Medicine, Seoul, Republic of Korea
9Department of Psychiatry, Korea University Anam Hospital, Seoul, Republic of Korea
10Department of Psychiatry, Chonnam National University School of Medicine, Gwangju, Republic of Korea
11Department of Neuropsychiatry, Hanyang University Guri Hospital, Guri, Republic of Korea
Objective Network analysis can be used in terms of a novel psychopathological approach for depressive syndrome. We aimed to esti- mate the successive network structures of depressive symptoms in patients with depressive disorder using data from the Clinical Re- search Center for Depression study.
Methods We enrolled 1,152 South Korean adult patients with depressive disorders who were beginning treatment for first-onset or re- current depressive episodes. We examined the network structure of the severities of the items on the Hamilton Depression Rating Scale (HAMD) at baseline and at weeks 2, 12, 25, and 52. The node strength centrality of all the HAMD items at baseline and at week 2, 12, 25, and 52 in terms of network analysis.
Results In the severity networks, the anxiety (psychic) item was the most centrally situated in the initial period (baseline and week 2), while loss of weight was the most centrally situated item in the later period (weeks 25 and 52). In addition, the number of strong edges (i.e., edges representing strong correlations) increased in the late period compared to the initial period.
Conclusion Our findings support a period-specific and symptom-focused therapeutic approach that can provide complementary in- formation to the unidimensional total HAMD score. Psychiatry Investig 2021;18(1):48-58 Key Words Anxiety (psychic), Centrality, Depressive disorders, Network analysis, Symptom-focused approach.
Received: October 6, 2020 Revised: November 27, 2020 Accepted: December 7, 2020
Correspondence: Seon-Cheol Park, MD, PhD
Department of Psychiatry, Inje University Haeundae Paik Hospital, 875 Haeundae-ro, Haeundae-gu, Busan 48108, Republic of Korea
Tel: +82-51-797-3300, Fax: +82-51-797-0298 E-mail: [email protected]
cc This is an Open Access article distributed under the terms of the Creative Commons Attribution Non-Commercial License (https://creativecommons.org/licenses/by- nc/4.0) which permits unrestricted non-commercial use, distribution, and reproduc- tion in any medium, provided the original work is properly cited.
to meet the diagnostic criteria for MDD.7 It is asserted that cer- tain symptom combinations are more prevalent than others in a depressive syndrome. However, current evidence-based medicine may be insufficient to fully describe the heteroge- neous complexity of depressive disorders, leading to a recom- mendation that the application of the DSM-5 definition is lim- ited to a general clinical setting.8 Moreover, according to Insel,9 clinical targets should be personalized in terms of the “next- generation treatments for mental disorders” based on a diag- nosis to a symptom or to an endophenotype. In contrast to earlier opinions that depression is the result of a chemical im- balance, it is now proposed that depression is conceptualized as a dysfunction of the neural circuit as a whole. McNally et al.10 proposed a new pragmatic perspective on psychopathology based on symptoms rather than categories, as follows: “Symp- toms are not an outcome of an underlying disease; symptoms and the associations between them are the disease itself.” Thus, network analysis is a natural method of analyzing psychopa- thology, working from the bottom up, without applying any top-down construct consistent with the standard biomedical and reductionist model.11 A network analysis attributes a giv- en psychiatric condition to a network structure of symptom components, whereas a traditional structural equation model explains any covariance of constituent symptoms in terms of the common influence of a latent variable.12-14 The heteroge- neity of the interrelated symptoms within a network of depres- sive disorders can be explained better with a network-analytic approach that is consistent with nominalism and not with es- sentialism.15,16 A network analysis can computationally evalu- ate a given property of the network structure and determine component variables that contribute proportionately or dis- proportionately to the network cohesiveness. In an estimated network structure, a centrality measure denotes the overall connectivity of a particular symptom. Central symptoms, or symptoms with a high value of this measure, contribute the most to the interrelatedness of symptoms within the estimated network structure.17-21 It is suggested that central symptoms have a stronger involvement in disease than peripheral symp- toms, translating into a greater impact on the cohesiveness of the symptom network. A network analysis can provide a novel perspective for evaluating the diagnostic construct “depressive disorder.” For instance, a network analysis of 3,463 outpatients with depression performed by the Sequenced Treatment Al- ternatives to Relieve Depression (STAR*D) study demonstrat- ed no significant differences between the centralities of DSM symptoms (e.g., depressed mood) and those of non-DSM symp- toms (e.g., anxiety).22 These previous findings are further sup- ported by a network analysis considering the centralities of DSM symptoms and non-DSM symptoms in 5,952 Han Chi- nese women with MDD.23 In addition, depressive symptoms
were not more central than anxiety symptoms in a network analysis of symptomatology in 223 patients with major de- pression.24 Guilt, in fact, was the most central domain within a network structure of depressive symptoms in 643 East Asian patients with depressive disorders. This result is not entirely consistent with the typical symptoms of depressive episodes as defined by the tenth edition of the International Statistical Classification of Diseases and Related Health Problems, namely depressed mood, loss of interest, and reduced energy.25 Thus, using data from the CRESCEND study,7 this study aimed to es- timate the serial changes in the centralities and network struc- tures of the items of the 17-item Hamilton Depression Rating Scale (HAMD)26,27 in a large sample of South Korean patients with DSM-defined depressive disorders.
METHODS
Study overviewThe CRESCEND study in South Korea comprises a large nationwide sample of patients with depressive disorders. It is a prospective, observational, and naturalistic study, and is the first to use such a large sample of national data.7 A total of 1,183 participants with depressive disorders, including first- onset patients beginning psychiatric treatment and those di- agnosed with a recurrent depressive episode, were recruited at 18 study centers, including 16 university-affiliated hospitals and 2 general hospitals, across South Korea from January 2006 to August 2008. The inclusion criteria were as follows: 1) age
>18 years; 2) a current diagnosis of MDD, dysthymic disor- der, or depressive disorder not otherwise specified, as defined by the DSM-IV (American Psychiatric Association 1994) and confirmed by the Structured Clinical Interview for DSM-IV Axis I Disorders, Research Version (SCID-I);28 and 3) comple- tion of all HAMD items26,27 at baseline and at weeks 2, 12, 25, and 52. The exclusion criteria were as follows: 1) a current or lifetime comorbid diagnosis of cognitive disorders, schizophre- nia, other psychotic disorders, or bipolar disorders as defined by the DSM-IV;29 2) current or past history of any significant medical or neurological disease; and 3) pregnant or breast- feeding women, or women who intend to become pregnant within 9 months of enrollment. Finally, 1,152 patients with depressive disorders were included in our study. The research protocol and consent form were approved by the institutional review boards of all the study centers, including the Catholic Medical Center, Catholic University of Korea (receipt number:
CUMC07U001). All eligible study subjects provided written informed consent prior to study participation.
Study design
The study participants underwent diagnostic evaluation at
baseline, and histories of medical diseases and psychiatric dis- orders were taken. In addition, at each of the regional centers, the sociodemographic and clinical data of all participants were collected and evaluated by trained and certified research co- ordinators under the supervision of clinical psychiatrists. After the exclusion of patients according to the stated criteria, eligible study subjects were psychometrically assessed by a clinician at baseline and at weeks 2, 12, 25, and 52 using the HAMD.
The 17-item HAMD, a clinician-administered assessment scale, fully covered the melancholic and physical features of depression. The patients described the severity of their psy- chiatric symptoms using a 5-point Likert scale: 0 (symptoms absent), 1 (mild symptoms), 2 (moderate symptoms), 3 (severe symptoms), and 4 (very severe symptoms).26 The internal con- sistency (Cronbach’s α=0.76) and inter-rater reliability (r=0.94, p<0.0001) of the Korean version of the HAMD were consid- ered favorable and excellent, respectively.27
Statistical analysis
The network structures were estimated using the R package
“graphics.”30 Using mixed models of repeated-measures anal- ysis of the HAMD items, we constructed network structures consisting of nodes (symptoms) and edges (associations among symptoms). False-positive edges were controlled using the least absolute shrinkage and selection operator (LASSO),31 and very short edges were set to exactly 0 in length. The edges indicate partial correlation coefficients in the graphical LASSO proce- dure. Thus, the edge length inversely represents the relation- ship strength between two symptoms with all other relation- ships within the network controlled. In addition, the shrinkage parameter was minimized by the extended Bayesian informa- tion criterion, and the underlying network structures were ac- curately recovered.32,33 The shorter the distance between two nodes, the stronger the associations between the two corre- sponding symptoms, as calculated using the Fruchterman-Re- ingold algorithm. This convention provides a visual demonstra- tion of the network. Several centrality indices were examined, including node-strength centrality, a common, stable, central metric, and the sum of the associations of a given node with all others; closeness centrality, a measure of how closely one symptom is related to others; and betweenness centrality, the number of shortest paths connecting two other nodes that pass through the node under consideration. In this study, the con- clusions are based on node-strength centrality, but this mea- sure was substantially correlated with the other centralities.
The correlation stability coefficient (CS coefficient), which we calculated with 1,000 node-drop bootstrap replicates, de- notes the maximum proportion of cases that can be eliminat- ed and still retain a 95% probability of a correct node rank- ing. Thus, in a node-ranking correlation between the original
and the case-subset networks, a CS coefficient of 0.700 would amount to a very large effect.34 The stability of the centrality measure was operationally defined using the CS coefficient, and we only considered centrality indices with a CS coefficient above 0.250—and preferably above 0.500—as recommended by Epskamp et al.30
RESULTS
Baseline characteristics
Of the 1,152 patients with depressive disorders, the mean age and age at onset of the first depressive episode were 48.3 [stan- dard deviation (SD)=2.0] years and 45.2 (SD=17.4) years, re- spectively. The participants were predominantly female (74.4%), married (65.9%), and not working outside the home (64.2%).
In addition, many of the participants were enrolled as outpa- tients (78.4%) and diagnosed with recurrent depressive epi- sodes (67.0%). Other baseline characteristics as well as psycho- metric assessments, including the HAMD scores at baseline and at weeks 2, 12, 25, and 52, are presented in Table 1. In the selection of an initial antidepressant, the prescription rates for SSRIs, dual-action antidepressants, and other antidepres- sants were 48.9%, 45.8%, and 5.3%, respectively. Among SSRIs, escitalopram (22.4%) was the most prescribed initial antide- pressant, followed by paroxetine (18.7%), fluoxetine (4.1%), and sertraline (3.7%). Furthermore, 20.6% of the patients who underwent antidepressant therapy were prescribed concomi- tant medications.
Estimated networks of HAMD items Baseline (n=1,152)
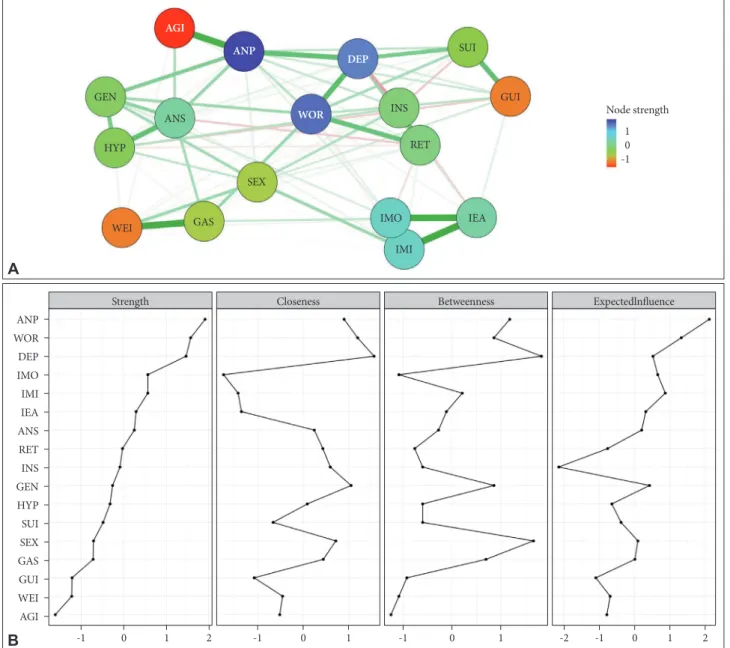
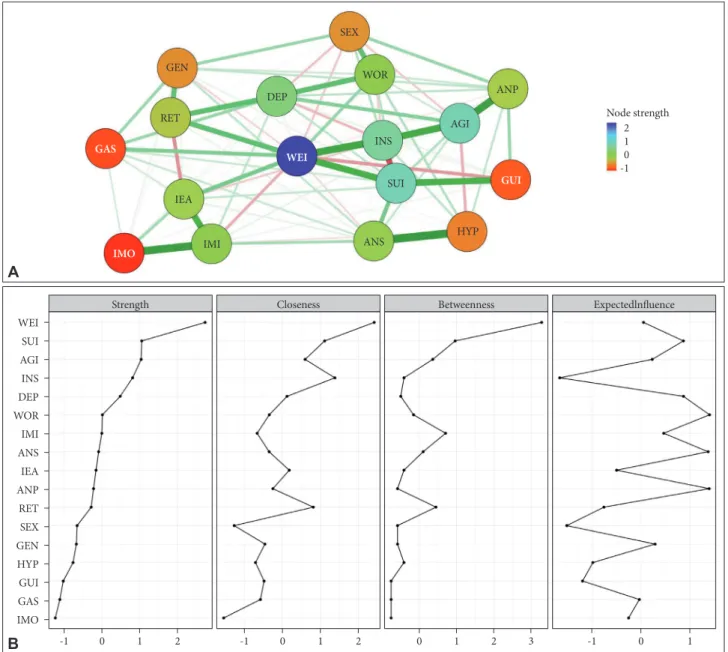
Construction of a severity network on the 17 HAMD items at baseline revealed that 85 (63.2%) of a possible 136 edges were estimated to exceed 0 (Figure 1A). In addition, several strong, positive edges with partial correlations of more than 3.000 were revealed, including connections between insomnia (middle of the night) and insomnia (early hours of the morning), insom- nia (early in the night) and insomnia (middle of the night), so- matic symptoms (gastrointestinal) and loss of weight, insom- nia (early hours of the morning) and insomnia (early in the night), and between anxiety (psychic) and agitation. Inspect- ing the node strength centrality of the HAMD items revealed that anxiety (psychic) was the most central symptom domain, followed by work-and-activities, depressed mood, and others, while agitation was the most poorly interconnected within the network. At baseline, the mean total score on the HAMD was 19.8 (SD=6.2) (Table 1). The centrality indices for the node strength, closeness, and betweenness of the severity network of the 17 HAMD items at baseline are shown in Figure 1B.
Week 2 (n=801)
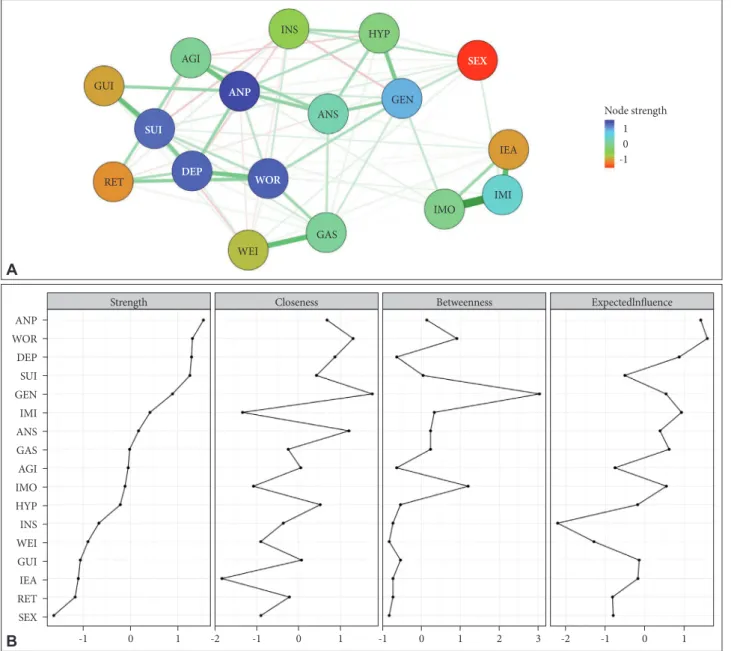
As shown in Figure 2A, the severity network of the HAMD items assessed at week 2 revealed that 85 (63.2%) of all possible edges were estimated to exceed 0. In addition, several strong positive edges were found between insomnia (middle of the night) and insomnia (early hours of the morning), insomnia (early in the night) and insomnia (middle of the night), somatic symptoms (gastrointestinal) and loss of weight, feelings of guilt and suicide, and between anxiety (psychic) and agitation. Thus, the strong edges at week 2 were similar to those at baseline.
Inspecting the node-strength centrality of the HAMD items revealed that anxiety (psychic) was again the most centrally located within the estimated network, whereas genital symp- toms was the most poorly interconnected within the network.
The mean total score on the HAMD at week 2 was 13.0 (SD=
4.8) (Table 1). The centrality indices at week 2 are shown in Figure 2B.
Week 12 (n=522)
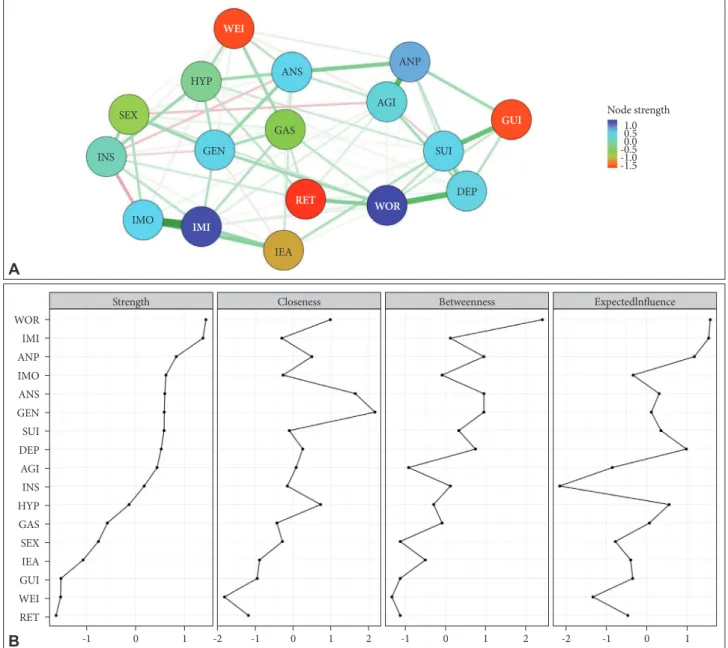
As shown in Figure 3A, the severity network of the HAMD items assessed at week 12 revealed that 89 (65.4%) of all possi- ble edges were estimated to exceed 0. In addition, several strong positive edges were revealed between insomnia (middle of the night) and insomnia (early hours of the morning), anxiety (psychic) and agitation, depressed mood and work-and-activ- ities, and feelings of guilt and suicide. Inspection of the node- strength centrality of the HAMD items revealed work-and- activities to be the most centrally located within the estimated network, whereas retardation was the most poorly intercon- nected within the network. Moreover, at week 12, the mean total HAMD score was 10.0 (SD=3.6) (Table 1). The centrality indices at week 12 are shown in Figure 3B.
Week 25 (n=409)
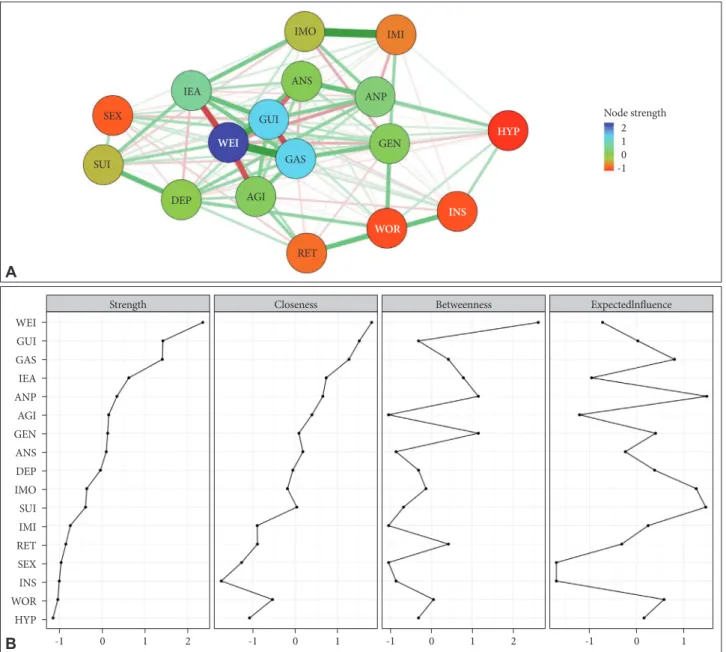
As shown in Figure 4A, the severity network of the HAMD items assessed at week 25 revealed that 120 (88.2%) of all pos- sible edges were estimated to exceed 0. In addition, several strong edges were revealed, including those between insomnia (middle of the night) and insomnia (early hours of the morn- ing), somatic symptoms (gastrointestinal) and loss of weight, feelings of guilt and loss of weight, anxiety (psychic) and anxi- ety (somatic), depressed mood and suicide, feelings of guilt and insomnia (early in the night), retardation and insight, anxi- ety (somatic) and loss of weight, general somatic symptoms and somatic symptoms (gastrointestinal), insomnia (early in the night) and insomnia (early hours of the morning), insom- nia (early in the night) and somatic symptoms (gastrointesti- nal), work-and-activities and general somatic symptoms, and between agitation and somatic symptoms (gastrointestinal).
Conversely, several strong negative edges with partial correla- tions of less than -3.000 were found between insomnia (early hours of the morning) and loss of weight, feelings of guilt and somatic symptoms (gastrointestinal), agitation and loss of weight, and feelings of guilt and anxiety (somatic). Inspecting the node-strength centrality of the HAMD items revealed loss of weight to be the most centrally located within the estimat- ed network, while retardation was the most poorly intercon- nected within the network. Moreover, at week 25, the mean total score on the HAMD was 9.4 (SD=3.1) (Table 1). The cen- trality indices at week 25 are shown in Figure 4B.
Week 52 (n=281)
As shown in Figure 5A, the severity network of the HAMD items assessed at week 52 revealed that 90 (66.2%) of all pos- sible edges were estimated to exceed 0. Several strong posi- Table 1. Descriptive statistics for baseline characteristics of the
study participants (N=1,152)
Variables N (%) or mean (SD)
Age, mean (SD) years 48.3 (2.0)
Female, N (%) 857 (74.4)
Education below high school, N (%) 843 (73.2)
Married, N (%) 759 (65.9)
Unemployed, N (%) 740 (64.2)
Annual household income <30,000 USD, N (%) 781 (67.8)
Religious, N (%) 707 (61.4)
Recurrent depressive episode, N (%) 772 (67.0) Age at onset of the first depressive episode,
mean (SD) years 45.2 (17.4)
Number of depressive episodes, mean (SD) 1.8 (1.8) Current general medical comorbidities, N (%) 776 (67.4) Past history of suicide attempt, N (%) 905 (78.6) HAMD at baseline, mean (SD) 19.8 (6.2)
HAMD at week 2,* mean (SD) 13.0 (4.8)
HAMD at week 12,† mean (SD) 10.0 (3.6) HAMD at week 25,‡ mean (SD) 9.4 (3.1) HAMD at week 52,§ mean (SD) 8.7 (2.8)
BDI-II, mean (SD) 29.0 (11.5)
SSI, mean (SD) 10.4 (8.4)
HAMA, mean (SD) 18.7 (8.4)
CGI-S, mean (SD) 4.7 (3.9)
SOFAS, mean (SD) 59.0 (11.2)
WHOQOL-BREF, mean (SD) 64.1 (10.5)
*N=801, †N=522, ‡N=409, §N=281. BDI-II: Beck Depression In- ventory-Second Edition, CGI-S: Clinical Global Impression Scale- Severity, HAMA: Hamilton Anxiety Rating Scale, HAMD: 17-item Hamilton Depression Rating Scale, SOFAS: Social and Occupa- tional Functioning Assessment Scale, SSI: Scale for Suicide Ide- ation, WHOQOL-BREF: World Health Organization Quality of Life assessment instrument-abbreviated version
tive edges were found, including those between anxiety (so- matic) and hypochondriasis, insomnia (middle of the night) and insomnia (early hours of the morning), anxiety (psychic) and agitation, loss of weight and insight, agitation and insight, suicide and loss of weight, insomnia (early hours of the morn- ing) and insomnia (middle of the night), feelings of guilt and suicide, depressed mood and retardation, and between de- pressed mood and work-and-activities. Conversely, a strong negative edge was revealed between suicide and insight. In- specting the node-strength centrality of the HAMD items again
revealed loss of weight to be the most centrally located within the estimated network, whereas insomnia (early hours of the morning) was the most poorly interconnected within the net- work. The mean total HAMD score at week 52 was 8.7 (SD=
2.8) (Table 1). The centrality indices at week 52 are shown in Figure 5B.
DISCUSSION
The present study found successive changes in the identi-
AGI
ANP GEN
HYP
WEI GAS
SEX
WOR DEP
INS RET
IMO IEA
IMI
SUI
GUI
ANS Node strength
ANP WOR DEP IMO IMI IEA ANS RET INS GEN HYP SUI SEX GAS GUI WEI AGI
10 -1
A
B -1 0 1 2
Strength
-1 0 1
Closeness
-1 0 1
Betweenness
-2 -1 0 1 2
Expectedlnfluence
Figure 1. Network structure and node statistics of the Hamilton Depression Rating Scale items at baseline (N=1,152). A: Network structure of the symptoms of depressive disorders at baseline (CS coefficient=0.400). Green lines represent positive associations. Red lines repre- sent negative associations. The line thicknesses represent the edge strengths. Nodes are depressive symptoms evaluated with the Hamil- ton Depression Rating Scale. B: Node statistics of the symptoms of depressive disorders at baseline. AGI: agitation, ANP: anxiety psychic, ANS: anxiety somatic, DEP: depressed mood, GAS: somatic symptoms gastro-intestinal, GEN: general somatic symptoms, GUI: feelings of guilt, HYP: hypochondriasis, IEA: insomnia: early in the night, IMI: insomnia: middle of the night, IMO: insomnia: early hours of the morning, INS: insight, RET: retardation, SEX: genital (sexual) symptoms, SUI: suicide, WOR: work and activities.
ties of the most central domains within the networks of de- pressive symptoms across the course of treatment. Reflecting the progressive decrease in the HAMD total score from base- line to week 52, the estimated network structures were con- tinually reorganizing. Whereas anxiety (psychic) was the most centrally situated within the estimated network structures in the early period (baseline and week 2), loss of weight was the most centrally situated in the late period (weeks 25 and 52).
It is well known that anxiety (psychic) is included in the non- DSM symptoms of depressive disorders, although loss of weight
is included in the DSM symptoms. These findings are consis- tent with the fact that in patients with major depression, DSM symptoms have been observed to be no more central than non- DSM symptoms within the symptom networks.22,23 In addi- tion, we found that the edges were stronger in the later peri- od than in the initial period. The clinical significance of the increased number of strong edges is not certain, but we spec- ulate that this increase is associated with the reduction of de- pressive symptom severity over the course of treatment and the concomitant boundary blurring of individual depressive
AGI
ANP GEN
HYP
WEI
GAS
SEX
DEP WOR
INS
RET
IMO
IEA IMI SUI
GUI
ANS Node strength
ANP WOR DEP SUI GEN IMI ANS GAS AGI IMO HYP INS WEI GUI IEA RET SEX
1 0 -1
A
B -1 0 1
Strength
-1
-2 0 1
Closeness
-1 0 1 2 3
Betweenness
-2 -1 0 1
Expectedlnfluence
Figure 2. Network structure and node statistics of the Hamilton Depression Rating Scale items at week 2 (N=801). A: Network structure of the symptoms of depressive disorders at week 2 (CS coefficient=0.400). Green lines represent positive associations. Red lines represent negative associations. The line thicknesses represent the edge strengths. Nodes are depressive symptoms evaluated with the Hamilton Depression Rating Scale. B: Node statistics of the symptoms of depressive disorders at week 2. AGI: agitation, ANP: anxiety psychic, ANS:
anxiety somatic, DEP: depressed mood, GAS: somatic symptoms gastro-intestinal, GEN: general somatic symptoms, GUI: feelings of guilt, HYP: hypochondriasis, IEA: insomnia: early in the night, IMI: insomnia: middle of the night, IMO: insomnia: early hours of the morning, INS:
insight, RET: retardation, SEX: genital (sexual) symptoms, SUI: suicide, WOR: work and activities.
symptoms. Furthermore, the edges among insomnia symp- toms, between anxiety (psychic) and agitation, and between feelings of guilt and suicide remained consistent from baseline to week 52. In light of factor analysis and the results of using the change in the aggregate total depression score in clinical trial research,35,36 we conclude that, remarkably, the successive changes that we observed in the most central symptom do- mains are partly inconsistent with the unidimensional concept of depression. Thus, we speculate the following: 1) network analysis of depressive symptoms may overcome the limita-
tions of the use of changes in the total scores of depression scales in clinical trials, 2) a period-differentiated and symp- tom-focused approach across the clinical course of depressive disorders is needed, and 3), the reorganization of network struc- tures and the changes in the HAMD total score in the course of antidepressant treatment offer complementary information.
Hilland et al.37 estimated the links between specific depres- sive symptoms and specific brain structures using network analysis. The study established positive associations, including crying-cingulate, crying-fusiform gyrus, irritability-fusiform
AGI ANP
GEN HYP
WEI
GAS SEX
WOR DEP
INS
RET IMO
IEA IMI
SUI
GUI ANS
Node strength
WOR IMI ANP IMO ANS GEN SUI DEP AGI INS HYP GAS SEX IEA GUI WEI RET
1.00.5 -0.50.0 -1.0-1.5
A
B -1 0 1
Strength
-1
-2 0 1 2
Closeness
-1 0 1 2
Betweenness
-2 -1 0 1
Expectedlnfluence
Figure 3. Network structure and node statistics of the Hamilton Depression Rating Scale items at week 12 (N=522). A: Network structure of the symptoms of depressive disorders at week 12 (CS coefficient=0.323). Green lines represent positive associations. Red lines represent negative associations. The line thicknesses represent the edge strengths. Nodes are depressive symptoms evaluated with the Hamilton Depression Rating Scale. B: Node statistics of the symptoms of depressive disorders at week 12. AGI: agitation, ANP: anxiety psychic, ANS: anxiety somatic, DEP: depressed mood, GAS: somatic symptoms gastro-intestinal, GEN: general somatic symptoms, GUI: feelings of guilt, HYP: hypochondriasis, IEA: insomnia: early in the night, IMI: insomnia: middle of the night, IMO: insomnia: early hours of the morning, INS: insight, RET: retardation, SEX: genital (sexual) symptoms, SUI: suicide, WOR: work and activities.
gyrus, irritability-hippocampus, loss of interest-hippocampus, self-criticism-fusiform gyrus, and worthlessness-cingulate.
Negative associations were also established, including changes in appetite-hippocampus, loss of interest in sex-insula, sad- ness-cingulate, sadness-hippocampus, and sadness-insula. We therefore speculate that the successive changes we observed in the most central domains are related to successive changes in the activities and functions of specific brain structures across the clinical course of depressive disorders. Herein, it is assumed that the observed sequence of the most central symptom, i.e.,
anxiety (psychic) → anxiety (psychic) → work and activities → loss of weight → loss of weight is closely associated with activ- ity changes in the hippocampus, fusiform gyrus, and cingulate gyrus over the course of recovery.
Our study has several limitations. First, the restricted range of the Likert scale (0–4) may contribute to an estimation bias in the centrality measures because symptoms with smaller means and variances may have a limited probability of mani- festing pronounced associations with other symptoms.26,27 Our study found that depressed mood, which has been reported to
Node strength
WEI GUI GAS IEA ANP AGI GEN ANS DEP IMO SUI IMI RET SEX INS WOR HYP
21 -10
A
B -1 0 1 2
Strength
-1 0 1
Closeness
-1 0 1 2
Betweenness
-1 0 1
Expectedlnfluence
Figure 4. Network structure and node statistics of the Hamilton Depression Rating Scale items at week 25 (N=409). A: Network structure of the symptoms of depressive disorders at week 25 (CS coefficient=0.399). Green lines represent positive associations. Red lines represent negative associations. The line thicknesses represent the edge strengths. Nodes are depressive symptoms evaluated with the Hamilton Depression Rating Scale. B: Node statistics of the symptoms of depressive disorders at week 25. AGI: agitation, ANP: anxiety psychic, ANS: anxiety somatic, DEP: depressed mood, GAS: somatic symptoms gastro-intestinal, GEN: general somatic symptoms, GUI: feelings of guilt, HYP: hypochondriasis, IEA: insomnia: early in the night, IMI: insomnia: middle of the night, IMO: insomnia: early hours of the morning, INS: insight, RET: retardation, SEX: genital (sexual) symptoms, SUI: suicide, WOR: work and activities.
SUI
AGI
ANP
GEN HYP
WEI
GAS SEX
WOR
DEP INS
RET IMO
IEA
IMI
GUI ANS
have a higher mean value and a lower standard deviation than psychic anxiety and other symptoms, showed more frequent representation than psychic anxiety or other symptoms. How- ever, we found that the Pearson correlation coefficient (r) be- tween the standard deviation and the node-strength centrality of the HAMD items was negligible; no consistent relationship was found that had the potential to bias the results. Second, all study participants were South Korean patients with depres- sive disorders. Therefore, we cannot exclude the possibility that the estimated network structures of the HAMD items
may be affected by some symptom presentation unique to our study population; thus, the generalizability of our findings to other populations may be limited. Third, the estimated net- work structures may be affected by our policy of excluding par- ticipants whose data containing missing values. Fourth, the es- timated network structures may have been influenced by the characteristics of the study participants, particularly with re- spect to medication. Following the CRESCEND study design, we included participants medicated with any class of antide- pressant and switched to any other class of antidepressant over
Node strength
WEI SUI AGI INS DEP WOR IMI ANS IEA ANP RET SEX GEN HYP GUI GAS IMO
21 -10
A
B -1 0 1 2
Strength
-1 0 1 2
Closeness
0 1 2 3
Betweenness
-1 0 1
Expectedlnfluence
Figure 5. Network structure and node statistics of the Hamilton Depression Rating Scale items at week 52 (N=281). A: Network structure of the symptoms of depressive disorders at week 52 (CS coefficient=0.205). Green lines represent positive associations. Red lines represent negative associations. The line thicknesses represent the edge strengths. Nodes are depressive symptoms evaluated with the Hamilton Depression Rating Scale. B: Node statistics of the symptoms of depressive disorders at week 52. AGI: agitation, ANP: anxiety psychic, ANS: anxiety somatic, DEP: depressed mood, GAS: somatic symptoms gastro-intestinal, GEN: general somatic symptoms, GUI: feelings of guilt, HYP: hypochondriasis, IEA: insomnia: early in the night, IMI: insomnia: middle of the night, IMO: insomnia: early hours of the morning, INS: insight, RET: retardation, SEX: genital (sexual) symptoms, SUI: suicide, WOR: work and activities.
SUI
AGI ANP GEN
HYP GAS WEI
SEX
WOR DEP
INS RET
IMO
IEA IMI
GUI
ANS
the course of the study. Therefore, the CRESCEND study de- sign may have been a moderator of the observed network structure of depressive symptoms. Thus, similar to previous network analyses of symptom changes,35,38 our findings have been moderated by the heterogeneity of the study subjects.
Despite these limitations, we have revealed successive chang- es in the network structures of depressive symptoms in a large sample of patients with depressive disorders. In addition, the network structures of depressive symptoms could be affected by the relatively high proportions of middle-aged women among the participants. In further studies, such analyses should be performed in a less heterogeneous sample of patients with depressive disorders. These limitations may be offset by our strategy of examining the successive changes in the most cen- tral symptom domains within the severity networks. It is spec- ulated that the clinically significant symptom domains such as anxiety (psychic), suicide, work-and-activities, and weight loss may be differentiated based on the treatment time course specific to a given depressive disorder.
Acknowledgments
This work was supported by the National Research Foundation of Korea (NRF) (grant no. 2019R1A2C1090146). We would like to thank Dr. Jin- seob Kim for his valuable help with the network analysis.
Conflicts of Interest
The authors have no potential conflicts of interest to disclose.
Author Contributions
Conceptualization: Seon-Cheol Park, Yaeseul Kim, Kiwon Kim, Eun Young Jang. Data curation: Young Sup Woo, Jung-Bum Kim, Eun Young Jang, Hwa-Yong Lee, Hyeon-Woo Yim, Byung-Joo Ham, Jae-Min Kim, Yong Chon Park. Methodology: Seon-Cheol Park, Yaeseul Kim, Kiwon Kim, Eun Young Jang. Supervision: Young Sup Woo, Jung-Bum Kim, Eun Young Jang, Hwa-Yong Lee, Hyeon-Woo Yim, Byung-Joo Ham, Jae-Min Kim, Yong Chon Park. Writing—original draft: Seon-Cheol Park.
ORCID iDs
Seon-Cheol Park https://orcid.org/0000-0003-3691-4624 Yaeseul Kim https://orcid.org/0000-0001-7579-2266 Kiwon Kim https://orcid.org/0000-0001-7594-0142 Young Sup Woo https://orcid.org/0000-0002-0961-838X Jung-Bum Kim https://orcid.org/0000-0001-9444-1437 Eun Young Jang https://orcid.org/0000-0001-5632-9380 Hwa-Yong Lee https://orcid.org/0000-0002-2749-6232 Hyeon-Woo Yim https://orcid.org/0000-0002-3646-8161 Byung-Joo Ham https://orcid.org/0000-0002-0108-2058 Jae-Min Kim https://orcid.org/0000-0001-7409-6306 Yong Chon Park https://orcid.org/0000-0002-3019-5748
REFERENCES
1. Østergaard SD, Jensen SOW, Beck P. The heterogeneity of the depres- sive syndrome: when numbers get serious. Acta Psychiatr Scand 2011;
124:495-496.
2. Uher R, Perlis RH, Henisberg N, Zobel A, Reitschel M, Mors O, et al.
Depression symptom dimensions as predictors of antidepressant treat- ment outcome: replicable evidence for interest-activity symptoms. Psy- chol Med 2012;42:967-980.
3. Park SC, Kim YK. Contemporary issues in depressive disorders. Psy- chiatry Investig 2019;16:633-635.
4. Park SC, Kim YK. Diagnostic issues of depressive disorders from Krae- pelinian dualism to the Diagnostic and Statistical Manual of Mental Disorders, fifth edition. Psychiatry Investig 2019;16:636-644.
5. American Psychiatric Association. Diagnostic and Statistical Manual of Mental Disorders, fifth edition (DSM-5). Washington, DC: Ameri- can Psychiatric Press; 2013.
6. Zimmerman M, Ellison W, Young D, Chelminski I, Dalrymple K. How many different ways do patients meet the diagnostic criteria for major depressive disorder? Compr Psychiatry 2015;56:29-34.
7. Park SC, Kim JM, Jun TY, Lee MS, Kim JB, Yim HW, et al. How many different symptom combinations fulfill the diagnostic criteria for ma- jor depressive disorder?: results from the CRESCEND study. Nord J Psychiatry 2016;71:217-222.
8. Nunes A, Trappenberg T, Alda M. We need an operational framework for heterogeneity in psychiatry research. J Psychiatry Neurosci 2020;
45:3-6.
9. Insel TR. Next-generation treatments for mental disorders. Sci Transl Med 2012;4:155ps19.
10. McNally RJ, Robinaugh DJ, Wu GWY, Wang L, Deserno MK, Bors- boom D. Mental disorders as causal systems: a network approach to posttraumatic stress disorder. Clin Psychol Sci 2015;3:836-849.
11. Young G. Causality in psychiatry: a hybrid symptom network construct model. Front Psychiatry 2015;6:164.
12. Borsboom D, Cramer AOJ. Network analysis: an integrative approach to the structure of psychopathology. Annu Rev Clin Psychol 2013;9:
91-121.
13. Fried EI, van Borkulo CD, Epskamp S, Schoevers RA, Tuerlinckx F, Borsboom D. Measuring depression over time ... or not? Lack of uni- dimensionality and longitudinal measurement invariance in four com- mon rating scales of depression. Psychol Assess 2016;28:1354-1367.
14. Guyon H, Falissard B, Kop JL. Modeling psychological attributes in psychology-an epistemological discussion: network analysis vs. latent variable. Front Psychol 2017;8:798.
15. Kukla A. Methods of Theoretical Psychology. Cambridge: A Bradford Book; 2001.
16. Kendler KS, Zachar P, Craver C. What kinds of things are psychiatric disorders? Psychol Med 2011;41:1143-1150.
17. Cramer AO, Waldorp LJ, van der Maas HL. Comorbidity: a network perspective. Behav Brain Sci 2010;33:137-150.
18. Wichers M, Wigman JTW, Myin-Germeys I. Micro-level affect dy- namics in psychopathology viewed from complex dynamical system theory. Emot Rev 2015;7:362-367.
19. Borsboom D. A network theory of mental disorders. World Psychiatry 2017;16:5-13.
20. Forbes MK, Wright AGC, Markon KE, Krueger RF. The network ap- proach to psychopathology: promise versus reality. World Psychiatry 2019;18:272-273.
21. Park SC, Kim J, Kim D. Reduced awareness of surroundings is the most central domain in the network structure of posttraumatic stress disor- der symptoms. Nord J Psychiatry 2020;74:344-353.
22. Fried EI, Epskamp S, Nesse RM, Tuerlinckx F, Borsboom D. What are
‘good’ depression symptoms? Comparing the centrality of DSM and non-DSM symptoms of depression in a network analysis. J Affect Dis- ord 2016;189:314-329.
23. Kendler KS, Aggen SH, Flint J, Borsboom D, Fried EI. The centrality of DSM and non-DSM depressive symptoms in Han Chinese women with major depression. J Affect Disord 2018;227:739-744.
24. Park SC, Kim D. The centrality of depression and anxiety symptoms in major depressive disorder determined using a network analysis. J Af- fect Disord 2020;271:19-26.
25. Park SC, Jang EY, Xiang EY, Kanba S, Kato TA, Chong MY, et al. Net- work analysis of the depressive symptom profiles in Asian patients with depressive disorders: Findings from the Research on Asian Psychotro-
pic Prescription Patterns for Antidepressants (REAP-AD). Psychiatry Clin Neurosci 2020;74:344-353.
26. Hamiton MA. A rating scale for depression. J Neurol Neurosurg Psy- chiatry 1960;23:56-62.
27. Yi JS, Bae SO, Ahn YM, Park DB, Noh KS, Shin HK, et al. Validity and reliability of the Korean version of the Hamilton Depression Rating Scale (K-HDRS). J Korean Neuropsychiatr Assoc 2015;44:456-465.
28. American Psychiatric Association. Diagnostic and Statistical Manual of Mental Disorders, fourth edition (DSM-IV). Washington, DC: Amer- ican Psychiatric Press; 1994.
29. First MB, Spitzer RL, Gibbon M. User’s Guide for the Structured Clini- cal Interview for DSM-IV Axis I Disorders Research Version (SCID-I).
New York: New York State Psychiatric Institute, Biometrics Research;
1996.
30. Epskamp S, Borsboom D, Fried EI. Estimating psychological networks and their accuracy: a tutorial paper. Behav Res Methods 2018;50:195- 31. Tibshirani R. Regression shrinkage and selection via the lasso. J R Stat 212.
Soc Ser B 1996;58:267-288.
32. Chen J, Chen Z. Extended Bayesian information criteria for model se- lection with large model species. Biometrika 2008;95:759-771.
33. van Borkulo C, Boschloo L, Borsboom D, Penninx BW, Waldorp LJ, Schoevers RA. Association of symptom network structure with the course of depression. JAMA Psychiatry 2015;72:1219-1226.
34. Cohen J. Statistical Power Analysis for the Behavioral Sciences (Revised Edition). New York: Academic Press; 1977.
35. Madhoo M, Levine SZ. Network analysis of the Quick Inventory of Depressive Symptomatology: reanalysis of the STAR*D clinical trial.
Eur Neuropsychopharmacol 2016;26:1768-1774.
36. Reilly TJ, MacGillivray SA, Reid IC, Cameron IM. Psychometric prop- erties of the16-item quick inventory of depressive symptomatology: a systematic review and meta-analysis. J Psychiatr Res 2015;60:132-140.
37. Hilland E, Landro NI, Kraft B, Tamnes CK, Fried EI, Maglanoc LA, et al. Exploring the links between specific depression symptoms and brain structures. Psychiatry Clin Neurosci 2020;74:220-221.
38. Roca P, Diez GG, Castellanos N, Vazquez C. Does mindfulness change the mind? A novel psychonectome perspective based on network analysis. PLoS One 2019;14:e0219793.