• 검색 결과가 없습니다.

Experimental and Numerical Study on Effects of Wall Impingement on Spray and Combustion Characteristics in a Diesel Engine

N/A
N/A
Protected

Academic year: 2021

Share "Experimental and Numerical Study on Effects of Wall Impingement on Spray and Combustion Characteristics in a Diesel Engine"

Copied!
10
0
0

로드 중.... (전체 텍스트 보기)

전체 글

(1)

Experimental and Numerical Study on Effects of Wall Impingement on Spray and Combustion Characteristics in a Diesel Engine

Yu Liu

*

, S. S. Chung

*

and J. Y. Ha

Key Words : Diesel engines, Visualization system, Impinged spray, Free spray, CFD software

Abstract

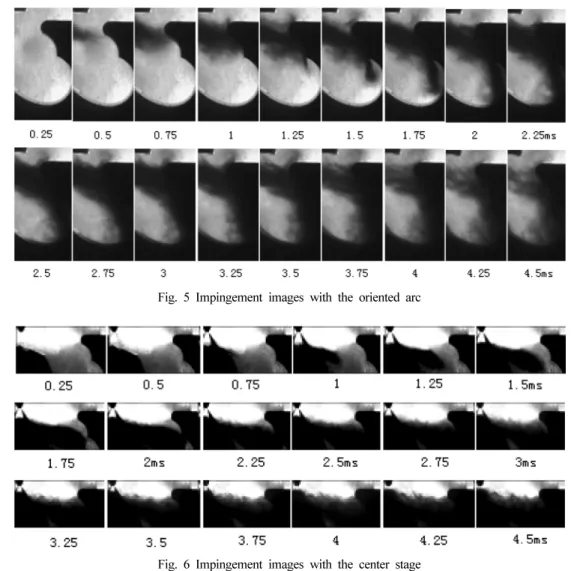
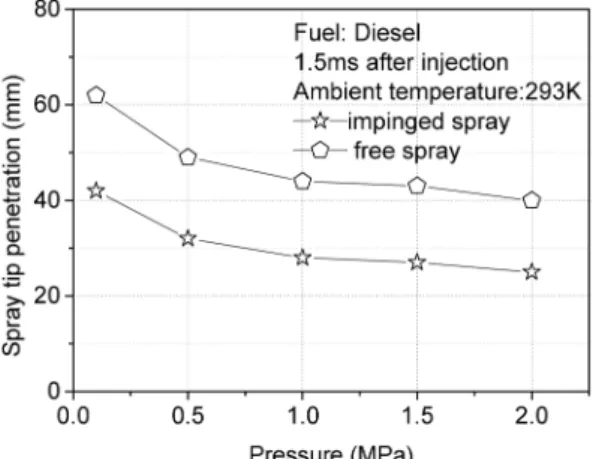
The spray-wall impingement in diesel engines is important to mixture preparation, engine performance and pollutant emissions. The purpose of this paper is to study the effects of spray-wall impingement on fuel distribution, combustion and emission characteristics by using both experimental and numerical methods. To investigate the spray-wall impinge- ment process, an impingement-chamber was designed and a visualization experiment system was also developed. The images of impinged spray and free spray were digitally recorded with an intensified CCD camera. To investigate the fuel distribution, combustion and emission characteristics of impinged spray in a real diesel engine, the fuel injection and com- bustion processes of an engine with impingement-chamber were simulated by CFD software. Equivalence ratio distribution results were obtained to understand the fuel distribution characteristics of the impinged spray. Some combustion and emis- sion characteristics were also acquired and the results showed that ignition delay of impinged spray was shorter than that of free spray; NO emission of the impinged spray was significantly less than that of free spray, but soot emission of impinged spray was more than that of the free spray. This study found that the diesel engine with spray-wall impingement has significant potential to reduce NO emission.

1. Introduction

The spray-wall impingement process, which is caused by the interaction between the spray, the wall and the air, is an important issue affecting mixture preparation and consequent combustion. Therefore it affects engine performance and pollutant emissions.

For example, in port fuel injection systems, it is a common practice to make the fuel spray impinges on the back of the inlet valves to enhance fuel evapora- tion. However, a significant proportion of fuel drop- lets deposit onto the impinged surface, and generates a liquid film which leads to the formation of unburned hydrocarbons. Especially in small bore direct injec- tion engines, the spray-wall impingement is unavoid-

able and the effects of spray-wall impingement can be quite evident. Increased emission of soot, nitric oxides and unburned hydrocarbons have been reported due to spray-wall impingement. Therefore it is neces- sary to study the spray-wall impingement process and its effects on the fuel distribution, combustion and emission characteristics.

Many researches on spray-wall impingement have been performed. For example, Hiroshi used the tur- boKIVA code to develop three-dimensional computa- tions and investigated the effects of wall impingement on combustion characteristics

(1)

. A modified version of wall-impingement model based on KIVA-3V code was proposed and proven to be adequate for different injection pressures and back pressure by Andreassi

(2)

. Shim studied the spray-wall impingement process in gasoline direct injection (GDI) engines, and some fundamental data about the effects of ambient tempera- ture and pressure on fuel film mass were obtained

(3)

. In spite of the previous reports, further study of spray-

(2010

8

12

일접수

~2010

9

13

일심사완료

, 2010

9

27

일게재확정

)

*

Dept. of Mechanical Engineering, Dong-A University, Korea

Dept. of Mechanical Engineering, Dong-A University, Korea

E-mail : [email protected]

(2)

wall impingement is still required to obtain higher ther- mal efficiency and reduce emissions of direct injec- tion diesel engines.

In this study, both experimental and numerical methods were used to study the effects of spray-wall impingement on fuel distribution, combustion and emission characteristics. To investigate the spray-wall impingement process, a new impingement-chamber was modified from deep cave ω -chamber with an oriented arc in the middle of the chamber wall and a visualization experiment system which consisted of constant volume chamber (CVC), fuel supply sys- tem, optical system and date acquisition system was also developed. The images of impinged spray and free spray can be obtained and then analyzed. To investigate the fuel distribution, combustion and emission characteristics of impinged spray in a real diesel engine, the fuel injection and combustion pro- cesses of an engine with impingement-chamber were simulated by a commercially-available CFD soft- ware. The fuel distribution, combustion and emission characteristics, such as equivalence ratio distribution, cylinder pressure and temperature, accumulated heat release as well as NO and soot emissions were acquired and then analyzed.

2. Setup of visualization system

Fig. 1 shows a schematic diagram of the visualiza- tion experimental apparatus, which has a CVC, a fuel supply system, an optical system, and a data acquisi- tion system. The fuel supply system consists of a motor, a fuel injection pump tester and an injector.

The 12PSDB fuel injection pump tester is used and its speed range is from 0 to 3000 r/min. The most important and difficult part of the visualization experiment system is the design of CVC.

2.1 CVC design

The security reliability, gas tightness and adjust- ment flexibility should be considered when the CVC is designed. Fig. 2 shows the structure of the CVC.

The behavior and structure of the fuel spray are mea-

sured under various back pressure conditions. The maximum back pressure is 4 MPa, so this CVC was made of cast steel to meet the strength requirement.

O-rings and sealing tape are used for each cover plate to seal the CVC.

This CVC features a modular design. There are six cover plates (the top, bottom, left and right, front and back) and they can exchange their positions, so the fuel injection process can be photographed from dif- ferent directions. This ensures a sufficient quantity of experimental data for meaningful analysis.

The injector holder is used to adjust the position of

Fig. 1 Schematic diagram of the visualization experimental apparatus

Fig. 2 Structure of the CVC used in the visualization exper-

imental system

(3)

injector and the adjusting lifter is used to adjust the position of the impingement-chamber.

2.2 Impingement-chamber design

A new combustion chamber was modified from a deep cave ω -chamber and was used to examine the spray-wall impingement process. Fig. 3 shows the shape of the chamber. There is a high stage in the center of the chamber and an oriented arc on the cyl- inder wall. The injector is located 6 mm above the center stage. The injector patterns are 2×0.3×150°

(the injector has two holes, the nozzle hole diameter is 0.3 mm, and 75° is the angle between the nozzle hole axis and injector axis) or 2×0.3×60°. Different injector patterns lead to different impingements.

Between two kinds of impingements, the lengths from the nozzle to the impinged surface are different.

2.3 Experimental method

A fuel pump was used to inject fuel into the CVC, and its fuel injection rate was measured. The fuel injection rate defines the injection rate diagram as a set of mass flow rate values. The sum of all elements is used to normalize the diagram for each nozzle in order to fulfill the total specified mass (volume) of injected fluid per nozzle

(4)

. Fig. 4 shows the injection

rate generated by the fuel pump. The injection dura- tion and quantity is 4 ms and 23.73 mg, respectively.

Nitrogen is purged as the ambient gas.

The spray images were digitally recorded with an intensified CCD camera that provided 1280 by 1024 pixel images at a resolution of 8 bits. The camera was connected with a personal computer through an image grabber. In this experiment, the MOTIONeer high speed camera was chosen to take images. This camera is produced by AOS Technologies and it is especially designed for industrial applicants. Table 1 shows the main parameters of this camera.

3. Experimental results 3.1 Impinged spray

Fig. 5 shows fuel distribution images for a 2.0 MPa back pressure at 0.25-4.5 ms after injection. The injected fuel penetrates into the chamber and impinges on the oriented arc. After impingement, most of the fuel moves along the oriented arc, and then it strips

Fig. 3 Structure of impingement-chamber. (a) Geometry of the impingement-chamber (b) Impingement with ori- ented arc (c) Impingement with center stage

Fig. 4 Fuel injection rate of the fuel pump Table 1. Main parameters of MOTIONeer Resolution 1280×1024 Pixel

Speed 62 to 32000 fps

Exposure Rates Global Electronic Shutter from 4 µ sec to 1/frame

Power 12VDC from standard Power Supply

(4)

away from the oriented arc at the edge and enters the lower part of the chamber to mix with air around the cylinder wall.

Fig. 6 shows the spray impingement on the center stage. The pattern of the injector is 2×0.3×60°. After impingement, fuel strips from the stage and becomes a kind of impinged spray, and then goes into the lower part of the chamber. As shown in the images, the fuel mixes with air well.

3.2 Spray penetration and spray area

Fig. 7 shows images of free spray with an injector pattern of 2×0.3×150° and impinged spray with an injector pattern of 2×0.3×60° under different back pressures at 1.5ms after injection. Fig. 8 illustrates a

spray penetration comparison and Fig. 9 illustrates a spray area comparison.

For free spray, penetration is defined as the dis- tance from the injector nozzle to the spray tip. For impinged spray, penetration is defined as the sum of the distance from the injector nozzle to the impinged surface and the distance from the impinged surface

Fig. 5 Impingement images with the oriented arc

Fig. 6 Impingement images with the center stage

Fig. 7 Comparison between free spray and impinged spray

under different back pressures

(5)

to the spray tip. The spray area is the fuel distribution area in the vertical direction. The spray tip penetra- tion and spray area can easily be measured using AutoCAD software (Autodesk, Inc., USA).

Fig. 8 shows that the spray tip penetration of impinged spray is always shorter than that of free spray under various back pressures. This might be due to the loss of kinetic energy because of impinge- ment. Also, after impingement, air entrainment plays a more important role than in free spray, so it short- ens the spray tip penetration.

Fig. 9 shows that with an increase of back pres- sure, both kinds of spray areas increase, but the vari- ability of the impinged spray area is much greater than that of free spray area. It is observed that the

spray area of impinged spray is always smaller than that of free spray with all kinds of back pressures because the impingement promotes the horizontal distribution of the spray. After impingement, the droplets are deflected in every directions, so from the observed side-view, the impinged spray area appears to be smaller than the free spray area.

4. Simulation for diesel spray and combustion process with impingement-chamber

By comparing the images, it is found that the spray-wall impingement is good for obtaining a well- distributed mixture. Impingement with an oriented arc can prevent fuel from adhering to the wall, and impingement with a center stage can make the fuel distribution more reasonable. However, the spray- wall impingement has disadvantages because it leads to the formation of a fuel film and increases the soot and HC emissions which affect engine efficiency. To investigate the fuel distribution, combustion and emis- sion characteristics of impinged spray in a real diesel engine, the fuel injection and combustion processes of an engine with impingement-chamber were simu- lated by a CFD software.

In this paper, the AVL FIRE software is used to sim- ulate combustion process. FIRE is the leading simula- tion program in the field of combustion engine analysis and specializes in accurate prediction of engine gas exchange, mixture formation and combus- tion, as well as emissions and the exhaust gas after treatment. It is a 3D computational fluid dynamics (CFD) tool which provides accurate representation of engine working process. It applies hydrodynamic con- trol equations, combining with spray, evaporation, impinge and combustion models, all of these models are commonly used in diesel engine’s simulation.

4.1 Initial and boundary conditions

This simulation was performed between the inlet valve closure (IVC) and exhaust valve open (EVO).

Because the combustion chamber is a centric and rotationally-symmetric structure and the fuel mass

Fig. 8 Spray tip penetration comparison between free spray and impinged spray

Fig. 9 Spray area comparison between free spray and

impinged spray

(6)

flow is the same for each hole of the injector, only a segment of the geometry for one injected spray was modeled

(5)

. Based on the number of holes in the injection nozzle, one-quarter of a cylinder is used for this simulation. Fig. 10 shows the calculation mesh.

The specification of in-cylinder conditions at the IVC is made by the initialization of ambient temper- ature, ambient pressure, or air density. The ambient temperature and pressure can be measured directly.

The air density is calculated automatically by CFD software if the ambient temperature and pressure are known (using the equation of state).

The specification of wall surface temperatures (cylin- der liner, cylinder head, and piston) was based on experimental experience and depended on the load

and speed operating conditions. The boundary condi- tion of the cylinder head was specified as a fixed wall, and the boundary condition of the piston bowl was specified as a moving wall. Table 2 shows the initial and boundary conditions used in this simula- tion.

4.2 Calculation models

A modified k- ε turbulence model was applied to simulate the flow fields inside the cylinder. The standard WAVE model is used to simulate the breakup process

(6)

. For this model, the initial drop- let size was set to the nozzle hole diameter. The growth of an initial perturbation on a liquid sur- face is linked to its wavelength and to other phys- ical and dynamic parameters of the injected fuel and the domain fluid.

The model WALLJET1 describes what happens if droplets hit a wall. This model in principle is based on the spray/wall impingement model of Naber and Reitz. The angle of reflection and the droplet diame- ter were changed according to a function of the Weber number

(7)

.

The Zeldovich model was used as a NOx forma- tion model. In combination with the Magnussen combustion model or the CFM model, the NO for- mation rate is based on temperature distribution.

The proven successful model of Hiroyasu et al.

was used for calculating soot emissions; this model enabled us to modify the rate of soot formation on the basis of a default rate constant, and to modify the rate of soot oxidation on the basis of a default rate constant.

4.3 Validation of models

The validation of the WAVE model was performed according to the spray tip penetration shown in Fig.

11. Fig. 12 similarly uses the comparison of spray tip penetration to validate the WALLJET1 model. The experimental spray tip penetration was defined by measuring the visible leading edge of the spray images. The calculated spray tip penetration was defined as the average distance of the leading 10 par- ticles from the injector nozzle. Good agreement was

Fig. 10 Calculation mesh of one-quarter cylinder

Table 2. Initial and boundary conditions of simulation

Engine speed (rpm) 1500

Bore×stoke (mm×mm) 135×150

Compression ratio 17.5

Fuel type Diesel

(C

12

H

26

) Diesel lower calorific value 4.24e7 Injection fuel mass (mg/cycle/cylinder) 23.73

Intake air pressure (MPa) 0.105

Intake air swirl ratio 1.2

Intake air temperature (K) 313

Piston temperature (K) 523

Cylinder head temperature (K) 423

Cylinder sleeve temperature (K) 373

Start calculation angle (°ABDC) 55

End calculation angle (°BBDC) 55

(7)

found between the calculated and the experimental results, even though some discrepancies were observed.

From the above results, the WAVE model and the WALLJET1 model can be used in the calculation of the fuel spray process.

The Zeldovich model and the model of Hiroyasu

et al. had previously been partially validated against experimental data by T. C. Zannis et al. at National Technical University of Athens

(8)

. Their experimental data including in-cylinder pressure plots, fuel effi- ciency, and nitrogen oxides emissions levels for a range of engine loads were compared to simulation results, and the CFD model showed good agreement with the experimental results.

5. Simulation results and discussion 5.1 Impingement with oriented arc

In this simulation, the injection timing is 350°CA and the injection duration is 15°CA. Fig. 13 shows the equivalence ratio distribution of impingement with the oriented arc. As shown in Fig. 13, at about 358°CA, the fuel spray penetrated to the oriented arc.

After impingement, it moved along the oriented arc until 360°CA when it stripped away. This result shows that the secondary spray formed by the ori- ented arc increased air entrainment. At 365°CA, the maximum equivalence ratio region was near the cyl- inder wall but not on the wall, which means that less fuel adhered to the wall and it can reduce the soot and HC emissions.

5.2 Impingement with the center stage Fig. 14 shows the equivalence ratio distribution of impingement with the center stage. The fuel spray is impinged immediately on the center stage after injec- tion, and then stripped from the center stage. The

Fig. 11 Comparison of the calculated and experimental spray tip penetrations for free spray

Fig. 12 Comparison of the calculated and experimental spray

tip penetrations for impinged spray Fig. 13 Equivalence ratio distribution of oriented arc impinged

spray

(8)

secondary spray went into the lower part of the cham- ber and then evaporated. After impingement, the big droplets broke into small ones, and the momentum loss by wall-impingement reduced the spray tip pene- tration. The spray tip didn't reach the cylinder wall, and the fuel mixed more effectively with air from both sides of the spray. At 370°CA, the fuel distrib- uted well in the center region of the chamber. Due to the impingement, the fuel-air mixture was quickly formed. At 375°CA, the fuel spread toward the cylin- der head with the engine expansion stroke.

5.3 Comparison of combustion characteristics For demonstrating the advantages and disadvan- tages of fuel combustion and emission characteristics with spray-wall impingement process, the fuel injec- tion and combustion processes of free spray were also simulated by the CFD software. The chamber remained the same but the injector pattern was changed to 2×0.3×120°. With this injector the fuel spray can’t be impinged on either the oriented arc or

the center stage. Fig. 15 to Fig. 19 show comparisons of combustion and emission characteristics for the center stage impinged spray, oriented arc impinged

Fig. 14 Equivalence ratio distribution of center stage impinged spray

Fig. 15 Cylinder pressure history of impinged spray and free spray

Fig. 16 Cylinder temperature history of impinged spray and free spray

Fig. 17 NO mass fraction of impinged spray and free spray

(9)

spray and free spray.

5.3.1 Comparison of ignition delay

Fig. 15 shows the cylinder pressure history of the impinged spray and free spray. Fig. 16 shows the cyl- inder temperature history of the impinged spray and free spray. The ignition delay in a diesel engine is defined as the period between the start of fuel injec- tion into the combustion chamber and the start of combustion. The start of combustion is difficult to determine precisely. It is best identified from the change in slope of the cylinder pressure curve or cyl- inder temperature curve. Shown in Fig. 15 and Fig.

16, the ignition delay of center stage impinged spray is shorter than that of the oriented arc impinged spray, while the ignition delay of free spray is the

longest, which means the well-mixed fuel-air mix- ture formed quickly by the spray-wall impingement.

5.3.2 Comparison of emissions

Fig. 17 and Fig. 18 show the comparisons of emis- sions. The main emissions from a diesel engine are NO and soot. According to the simulation results, impinged spray produced less NO than free spray. It is well known that less NO might be caused by lean mixture formation by less utilization of fuel. Fig. 19 gives the result of accumulated heat release and it also reflects combustion completeness. It is shown in Fig. 19 that compared with free spray, although the combustion completeness of impinged spray are lower, almost 85% of the injected fuel is burned, so the formation of the mixture should not be regarded as the lean mixture. Less NO production was due to impingement which can make the fuel and air mix well, and avoid high temperature and oxygen con- centrations in regions in the cylinder.

Center stage impinged spray produced less NO than oriented arc impinged spray; while their soot emissions were almost the same. It is well known that soot particles are formed in fuel-rich regions of burning diesel jets. Dale R. Tree et al. found soot for- mation is strongly dependent on air entrainment.

They also found that higher temperatures at the end of combustion enhance the burnout of soot in com- pression ignition engines

(9)

. Moreira et al. in an investi- gating of spray-wall impact relevant to IC engines concluded that many elements affect mass deposited onto the solid surface such as temperature and veloc- ity of the liquid, impact angle and solid surface tem- perature

(10)

. For these two kinds of impinged spray, after impingement with the center stage, the air entrainment is enhanced, but due to the different shape of impinged surfaces and different lengths from the nozzle to the impinged surface, they had almost the same soot emissions.

The two kinds of impinged spray produced more soot than that of free spray, which means impinge- ment is not good for soot emission, and that fuel adheres to wall is unavoidable in the spray-wall impingement process.

Fig. 18 Soot mass fraction of impinged spray and free spray

Fig. 19 Accumulated heat release of impinged spray and

free spray

(10)

6. Conclusion

In this study, an impingement-chamber was designed and a visualization system was developed to investi- gate the effects of spray-wall impingement on fuel distribution as well as combustion and emission char- acteristics. The fuel injection and combustion pro- cesses of a real engine with impingement-chamber were also simulated by a commercially-available CFD software. The following summarizes the results:

1. When comparing spray images, the spray tip penetration of center stage impinged spray was always shorter than that of free spray under various back pressures; with the increase of back pressure, both their spray areas increased, but the variability of cen- ter stage impinged spray area was much greater than that of free spray area.

2. Equivalence ratio distribution results showed that the oriented arc had the function of preventing fuel from adhering to the cylinder wall. After impinge- ment with the center stage, the secondary spray can mix with air well, and the fuel was distributed mainly in the center region of the chamber.

3. Combustion characteristic results showed that the ignition delay of impinged spray was shorter than that of free spray; the emission characteristic results showed that NO emission of impinged spray was much less than that of free spray, but soot emission of impinged spray was more than that of free spray.

4. It was found from the simulation results that between two kinds of impinged spray, center stage impinged spray produced less NO than that of ori- ented arc impinged spray; their soot emissions were almost the same.

Acknowledgements

This work was supported by the Dong-A Univer- sity research fund.

References

(1) Hiroshi Ogawa, Yukio Matsui, Shuji Kimura and Jun- ichi Kawashima, “Three-dimensional computation of in-cylinder flow and combustion characteristics in die- sel engines-Effect of wall impingement models of fuel droplet behavior on combustion characteristics”, JSAE Review, Vol. 18, No. 2, 1997, pp. 95~99.

(2) L. Andreassi, S. Ubertini and L. Allocca, “Experimen- tal and numerical analysis of high pressure diesel spray-wall interaction”, International Journal of Mul- tiphase Flow, Vol. 33, No. 7, 2007, pp. 742~765.

(3) Y.-S. Shim, G.-M. Choi and D.-J. Kim, “Numerical and experimental study on effect of wall geometry on wall impingement process of hollow-cone fuel spray under various ambient conditions”, International Journal of Multiphase Flow, Vol. 35, 2009, pp. 885~895.

(4) Akihiko Azetsu, Yoshifumi Wakisaka, Yasuhiko Fukuchi and Chikashi Oikawa, “Effect of fuel injection rate shap- ing on spray combustion: 1st report, an electronically controllable fuel injection system for variable injection rate shaping and analysis of spray characteristics”, JSME International Journal (B), Vol. 64, No. 624, 1998.

(5) AVL LIST GmbH. AVL FIRE 8.2 Manual-Theory.

Graz, Austria, 2003.

(6) Liu Alex B., Mather Daniel and Reiyz Rolf D., “Mod- eling the Effects of Drop Drag and Breakup on Fuel Sprays”, SAE Paper 1993, 930072.

(7) Jiro Senda, Masaaki Kobayashi, Seiji Iwashita and Hajime Fujimoto, “Modeling of Diesel Spray Impinge- ment on a Flat Wall”, SAE Paper 1994, 941894.

(8) T. C. Zannis, E. G. Pariotis, D. T. Hountalas, D. C.

Rakopoulos and Y. A. Levendis, “Theoretical study of DI diesel engine performance and emissions using com- parable air-side and fuel-side oxygen addition”, Energy Conversion and Management, Vol. 48, No. 11, 2007, pp. 2962~2970.

(9) Dale R. Tree and Kenth I. Svensson, “Soot processes in compression ignition engines”, Progress in Energy and Combustion Science, Vol. 33, No. 3, 2007, pp. 272~309.

(10) A. L. N. Moreira, A. S. Moita and M. R. Panão,

“Advances and challenges in explaining fuel spray

impingement”, Progress in Energy and Combustion

Science, Vol. 36, No. 5, 2010, pp. 554~580.

수치

Fig. 2 Structure of the CVC used in the visualization  exper- exper-imental system
Fig. 4 Fuel injection rate of the fuel pump Table 1. Main parameters of MOTIONeer Resolution 1280×1024 Pixel
Fig. 6 shows the spray impingement on the center stage. The pattern of the injector is 2×0.3×60°
Fig. 8 shows that the spray tip penetration of impinged spray is always shorter than that of free spray under various back pressures
+5

참조

관련 문서

"Effect of Injection Pressure and Injection Timing on Spray and Flame Characteristics of Spray-Guided Direct-Injection Spark-Ignition Engine Under Lean

Cho, 2008, "Effects of Biodiesel Fuel on Characteristics of Specific Fuel Consumption and Exhaust Emissions in DI Diesel Engine", Journal of the Korean Society of

Fig.. 3 Effect of EGR rate on combustion characteristics.. Effect of EGR Rate on Combustion and Emission Characteristics in a Single-cylinder Direct Injection Diesel

“Characteristics of canola biodiesel fuel blended with diesel on the combustion and exhaust gas emissions in a compression ignition diesel engine,” Journal of

Abstract: In order to judge that non-esterified soybean oil could be used on diesel engine with electronic control of fuel injection system, The test of combustion

Figure 4: Filter former pressures, filter latter pressure characteristics of Bio diesel and diesel according to supply fuel temperatures (injection pressure: 600 bar,

Keywords : Specific fuel Consumption, CRDI(common rail direct injection), Combustion characteristics, Exhaust emission, Rate of pressure rise, Mass burned fraction,

Spray targeting to minimize soot and co formation in premixed charge compression ignition (PCCI) combustion with a HSDI diesel engine.. Experimental investigation of B20 combustion