319
and Safety
Available online at http://www.foodhygiene.or.kr
https://doi.org/10.13103/JFHS.2020.35.4. 319
Combination of Enrichment and PCR in Rapid Semi-Quantification of Bacillus cereus in Fresh-Cut Vegetables
Yukyung Choi
1, Sujung Lee
2, Yohan Yoon
1,2*
1
Risk Analysis Research Center, Sookmyung Women’s University, Seoul, Korea
2
Department of Food and Nutrition, Sookmyung Women’s University, Seoul, Korea (Received June 18, 2020/Revised July 28, 2020/Accepted July 29, 2020)
ABSTRACT - Widespread consumption of fresh-cut vegetables without cooking results in ingestion of major foodborne pathogens including Bacillus cereus. In this study, we aimed to develop a method to rapidly detect B. cereus in fresh-cut vegeta- bles by combining commercial PCR analysis with enrichment of the pathogenic levels. A mixture of B. cereus strains (KCTC1013, KCTC1014, KCTC1092, KCTC1094, and KCTC3624) was inoculated on the surface of fresh-cut cabbage lettuce (20 g) and baby leafy vegetables (10 g) to concentration 1, 2, 3, 4, and 5 log CFU/g. Eighty milliliters of TSB with 0.15% poly- myxin B was used for cabbage lettuce, and 90 mL of medium was used for baby leafy vegetables and incubated at 42
oC for 0, 2, 3, 4, 5, 6, and 7 h. One milliliter of the enriched media was plated on mannitol-egg yolk-polymyxin agar for quantification, and another 1 mL was used for DNA extraction for PCR analysis. Additionally, the minimum number of sub-samples to be tested from a pack of fresh-cut vegetable samples was determined using 5 sub-samples. The results from this study showed that for detecting B. cereus in fresh-cut cabbage lettuce, 3, 4, 5, 6, and 7 h enrichment were required to at least detect 5, 4, 3, 2, and 1 log CFU/g of B. cereus, respectively. B. cereus in fresh-cut baby leafy vegetables could be detected after 2, 3, 4, 5, and 6 h of enrich- ment at 5, 4, 3, 2, and 1 log CFU/g, respectively, using a combination of enrichment and PCR analysis. To determine if a pack of fresh-cut vegetable is positive, the minimum number of sub-samples should be 3. These results can be used to develop a rapid detection method to semi-quantify B. cereus in fresh-cut vegetable samples combining enrichment and PCR.
Key words : Bacillus cereus, Fresh-cut vegetables, Rapid detection, Enrichment, PCR
Ready-to-use products are produced because of increasing demand for minimally processed and fresh-cut vegetables.
Fresh-cut products are vegetables or fruits that were peeled and/or trimmed and/or cut into usable products according to the International Fresh-cut Produce Association (IFPA)
2). In particular, fresh-cut vegetables are generally consumed without cooking, and thus, the safety of these foods in the context of foodborne pathogens is critical.
Bacillus cereus is a pathogenic bacterium typically present in plants
1,3)and can therefore be detected in raw vegetable seed sprouts, mainly in salads
3). Valero et al.
1)showed that 8.3% of packaged and refrigerated American salads were contaminated with B. cereus. Becker et al.
4)also detected more than 3 log CFU/g of B. cereus sensu lato (B. cereus, Bacillus thuringiensis, and Bacillus anthracis) in 16.7%
vegetable-based salads. Kim et al.
5)and Chon et al.
6)detected B. cereus in 27.3-30.8% of fresh-cut vegetables, and 48% of retail vegetable salads and sprouts in S. Korea.
B. cereus is therefore considered to be a highly prevalent pathogen in vegetables, especially the ones consumed raw.
These products undergo no or minimal decontamination, such as washing with water, and also have a short shelf life.
Hence, it is necessary to develop a method that can rapidly detect B. cereus in these products before they leave the processing facility.
According to the Bacteriological Analytical Manual (BAM), B. cereus detection in foods should be conducted through biochemical testing on the suspected colonies that are pink in color and are surrounded by the precipitate zone on mannitol-egg yolk-polymyxin (MYP) agar
7). These methods, although useful in precisely confirming the presence of B. cereus, are time-consuming. Thus, conventional PCR, real-time PCR, multiplex PCR, enzyme- linked immunosorbent assay (ELISA), and DNA microarray can be used as alternative methodologies for the identification of B. cereus in suspicious colonies
8). These rapid and accurate methods are typically designed for the
*Correspondence to: Yohan Yoon, Department of Food and Nutrition, Sookmyung Women’s University, Seoul 04310, Korea Tel: +82-2-2077-7585, Fax: +82-2-710-9479
E-mail: [email protected]
Copyright © The Korean Society of Food Hygiene and Safety. All rights reserved. The Journal of Food Hygiene and Safety is an Open-Access journal distributed under the terms of the Creative Commons Attribution Non-Commercial License(http://creativecommons.org/licenses/by-nc/3.0) which permits unrestricted non-commercial use, distribution,and reproduction in any medium, provided the original work is properly cited.
identification of single colonies, but they cannot be applied directly to the samples for quantification. Additionally, the detection limits for these methods are relatively high;
therefore, the sample has to be enriched prior to these methods being used. However, quantification upon enrichment is challenging. Therefore, it is necessary to develop a method of detecting B. cereus that combines the accuracy of the PCR method and the benefits of enrichment.
Choi et al.
9)proposed such a method for the detection of Escherichia coli, but this method could not be used to quantify E. coli.
Therefore, the objective of this study was to develop a method combining enrichment and PCR, for the rapid detection of B. cereus in food samples.
Materials and Methods Inocula preparation
A mixture of B. cereus strains KCTC1013, KCTC1014, KCTC1092, KCTC1094, and KCTC3624 was used in this study. A colony of each strain was cultured in 10 mL tryptic soy broth (TSB, Becton, Dickinson and Company, Sparks, MD, USA) at 30
oC for 24 h. Aliquots of 0.1 mL of the cultures were sub-cultured in 10 mL of fresh TSB at 30
oC for 24 h. Subcultures of the different strains were then mixed and centrifuged at 1,912×g at 4
oC for 15 min. The pellet was washed twice with 50 mL phosphate buffered saline (PBS, 0.2 g of KH
2PO
4, 1.5 g of Na
2HPO
4·7H
2O, 8.0 g of NaCl, and 0.2 g of KCl in 1 L of distilled water, pH 7.4) and subsequently resuspended and diluted with PBS to prepare 3-, 4-, and 5-log CFU/mL inocula.
Sample preparation and inoculation
Fresh-cut vegetables (cabbage lettuce and baby leafy vegetables) were purchased from a market in Seoul, S.
Korea. Portions of 20 g and 10 g cabbage lettuce and baby leafy vegetables, respectively, were placed in filter bags (3M, St. Paul, MN, USA). The inocula (0.1 mL) were used to obtain fresh-cut vegetable samples with B. cereus at concentrations of 1-, 2-, 3-, 4-, and 5-log CFU/g, and the samples were massaged 20 times by hand. Samples were then left under laminar flow for 15 min to allow B. cereus attachment. Eighty milliliters and 90 mL TSB, each supplemented with 0.15% polymyxin B (Oxoid, Basingstoke, Hampshire, UK), were used for cabbage lettuce and baby leafy vegetables, respectively, and placed in filter bags.
Enrichment and quantification of B. cereus
Enrichment of B. cereus in the fresh-cut vegetable samples was performed by incubating the samples with 1-, 2-, 3-, 4-,
and 5-log CFU/g of B. cereus at 42
oC for 0, 2, 3, 4, 5, 6, and 7 h. One milliliter of the enriched media for each sample corresponding to a particular time-point was serially diluted with 0.1% buffered peptone water (BPW; Becton, Dickinson and Company), and plated on MYP (Becton, Dickinson and Company) agar. The plates were incubated at 30
oC for 24 h, and the characteristic pink-red colonies were manually counted.
DNA extraction
The 1 mL aliquots of the enriched samples were centrifuged at 14,000 rpm at 4
oC for 5 min, and the pellet washed with 30 µL of distilled water. The suspensions were boiled at 100
oC for 10 min and left at room temperature for 2 min. The supernatants were used as DNA templates after centrifugation at 14,000 rpm at 4
oC for 3 min.
B. cereus multiplex PCR
A multiplex PCR kit (Jinsung-UniTech Co., Goyang, Korea) was used to detect B. cereus in the enriched samples.
This kit was used to detect cry1 (138 bp), groEL (250 bp), and ces (405 bp) genes using specific primers. cry1 was detected only in B. thuringiensis, groEL was detected in both B. cereus and B. thuringiensis, and ces was detected only in emetic toxin-producing B. cereus
10). The detection limit for the B. cereus and B. thuringiensis multiplex PCR kit (Jinsung- UniTech Co.) was 5 log CFU/mL
11).
Determination of the number of sub-samples Several sub-samples from the package had to be examined to determine if a pack of fresh-cut vegetable samples was contaminated with B. cereus. Hence, the number of sub- samples was determined. Fresh-cut cabbage lettuce and baby leafy vegetables were dipped into B. cereus inocula for 2 min to obtain 3 log CFU/g, and the samples were drained for 15 min. The fresh-cut vegetable samples were placed in sample bags (3M). Five sub-samples of fresh-cut cabbage lettuce (20 g) and baby leafy vegetables (10 g) were withdrawn from a sample bag and placed in filter bags. TSB supplemented with 0.15% polymyxin B (90 mL) (Oxoid, UK) was placed into the sub-samples and incubated at 42
oC for 24 h. The bacterial cell counts were quantified by plating samples on MYP (Becton, Dickinson and Company) agar as described previously. DNA was extracted at 0, 2, 3, 4, 5, 6, and 7 h, and used for PCR analysis using the methods described above.
Results and Discussion
According to Lee et al.
10), the B. cereus detection limit of
the B. cereus multiplex PCR kit (Jinsung-UniTech Co.) was
approximately 5 log CFU/mL, and the enrichment temperature was determined to be 42
oC for detecting B.
cereus at 30
oC, 37
oC, and 42
oC. Hence, B. cereus in fresh- cut cabbage lettuces inoculated at 1, 2, 3, 4, and 5-log CFU/
g was enriched at 42
oC for 0 h, 2 h, 3 h, 4 h, 5 h, 6 h, and 7 h. Among the 5 samples in each enrichment time, the 1 log CFU/g inoculated samples became positive after 6 h of enrichment, and 3 samples became positive after 7 h of enrichment (Table 1). The cell counts of B. cereus in the fresh-cut cabbage lettuce samples after enrichment were 6.1 (6 h) and 7.3 log CFU/g (7 h). The fresh-cut cabbage lettuce samples inoculated with a B. cereus concentration of 2 log CFU/g became positive in 4 samples after 6 h enrichment and 3 out of 5 samples tested positive after 7 h-enrichment.
The cell counts of B. cereus after enrichment were 6.7 (6 h) and 7.7 log CFU/g (7 h). The samples inoculated with a B.
cereus concentration of 3 log CFU/g became positive in 2, 4, and 3 out of 5 samples after 5 h-, 6 h-, and 7 h- enrichment, respectively. The cell counts of B. cereus after enrichment were 7.0 (5 h), 7.8 (6 h), and 8.5 log CFU/g (7 h). Four of the 5 samples inoculated with a B. cereus concentration of 4-log CFU/g became positive after 4 h-, 5 h-, and 6 h-enrichment. The cell counts of B. cereus after enrichment were 7.3 (4 h), 7.7 (5 h), and 8.6 log CFU/g (6 h). In the case of samples inoculated with a B. cereus concentration of 5 log CFU/g, 2 out of 5 samples became positive after 0 h- and 2 h-enrichment, all samples became positive after 3 h- and 4 h-enrichment, and 4 samples became positive after 5 h- and 6 h-enrichment. The cell counts of B.
cereus after enrichment were 4.6 (0 h), 5.8 (2 h), 7.4 (3 h), 8.3 (4 h), 8.6 (5 h), and 8.6 log CFU/g (7 h) (Table 1). These results indicate that 3 h-, 4 h-, 5 h-, 6 h-, and 7 h-enrichment time is required to detect 5, 4, 3, 2, and 1 log CFU/g of B.
cereus in fresh-cut cabbage lettuce samples.
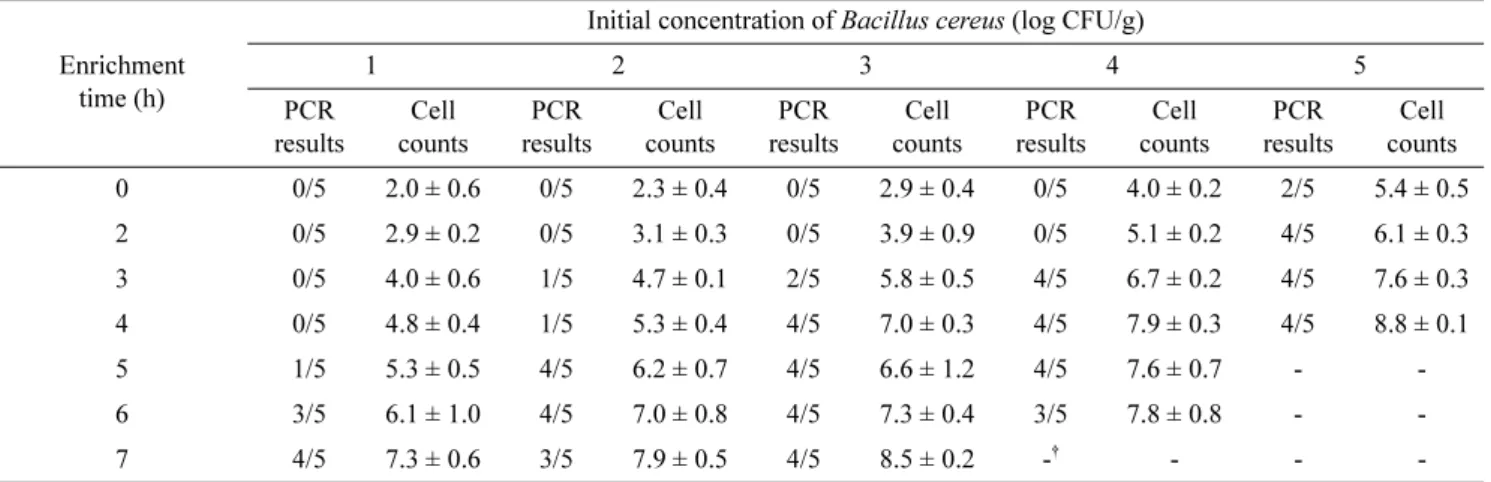
In the case of the fresh-cut baby leafy vegetables, out of the 1 log CFU/g of B. cereus inoculated samples, 1 sample became positive after 5 h enrichment, and 3 and 4 samples became positive after 6 h- and 7 h-enrichment respectively (Table 2). The B. cereus cell count in fresh-cut baby leafy vegetable samples after enrichment were 5.3 (5 h), 6.1 (6 h), and 7.3 log CFU/g (7 h). Only one sample inoculated with a B. cereus concentration of 2 log CFU/g became after 3-4 h-enrichment, and 4, 4, and 3 samples became positive after 5 h-, 6 h-, and 7 h-enrichment, respectively. The B. cereus cell count after enrichment was 4.7 (3 h), 5.3 (4 h), 6.2 (5 h), 7.0 (6 h), and 7.9 log CFU/g (7 h). The 3-log CFU/g inoculated samples became positive in 2 samples after 3 h- enrichment, and 4 of 5 samples became positive after 4 h-, 5 h-, 6 h-, and 7 h-enrichment. The B. cereus cell count after enrichment was 5.8 (3 h), 7.0 (4 h), 6.6 (5 h), 7.3 (6 h), and 8.5 log CFU/g (7 h), respectively. Out of the 4-log CFU/g inoculated samples, B. cereus was detected in 4, 4, 4, and 3 samples out of 5 samples after 3 h-, 4 h-, 5 h-, and 6 h- enrichment, respectively. B. cereus cell counts after enrichment were 6.7 (3 h), 7.9 (4 h), 7.6 (5 h), and 7.8 log CFU/g (6 h). In the samples inoculated with 5 log CFU/g, 2 samples were positive at 0 h enrichment and 4 of 5 samples were positive after 2 h-, 3 h-, and 4 h-enrichment.
The B. cereus cell counts after enrichment were 5.4 (0 h), 6.1 (2 h), 7.6 (3 h), and 8.8. log CFU/g (4 h) (Table 2). These results showed that lower inoculation levels needed longer enrichment times to be detected as positive by PCR. This implies that knowledge of the enrichment time required for positive detection would allow estimation of B. cereus contamination levels.
Although the detection limit of B. cereus with the Table 1. Results (the number of positive samples/the number of total samples) of polymerase chain reaction analysis by Bacillus cereus multiplex PCR kit and B. cereus cell counts (n=5; mean ± standard deviation, log CFU/g) after enrichment of B. cereus in the fresh-cut cabbage lettuces at 42°C for 0 h, 2 h, 3 h, 4 h, 5 h, 6 h, and 7 h
Enrichment time (h)
Initial concentration of Bacillus cereus (log CFU/g)
1 2 3 4 5
PCR results
Cell counts
PCR results
Cell counts
PCR results
Cell counts
PCR results
Cell counts
PCR results
Cell counts
0 0/5 0.9 ± 0.4 0/5 1.9 ± 0.3 0/5 2.9 ± 0.2 0/5 3.6 ± 0.2 2/5 4.6 ± 0.2
2 0/5 1.8 ± 0.5 0/5 2.7 ± 0.1 0/5 3.3 ± 0.5 0/5 4.7 ± 0.2 2/5 5.8 ± 0.3
3 0/5 3.0 ± 0.3 0/5 5.0 ± 0.2 0/5 5.1 ± 0.2 0/5 6.0 ± 0.2 5/5 7.4 ± 0.2
4 0/5 4.2 ± 0.4 0/5 5.3 ± 0.3 0/5 6.2 ± 0.4 4/5 7.3 ± 0.3 5/5 8.3 ± 0.3
5 0/5 5.4 ± 0.4 0/5 6.4 ± 0.5 2/5 7.0 ± 0.2 4/5 7.7 ± 0.9 4/5 8.6 ± 0.3
6 1/5 6.1 ± 0.7 4/5 6.7 ± 0.7 4/5 7.8 ± 0.6 4/5 8.6 ± 0.3 4/5 8.6 ± 0.0
7 3/5 7.3 ± 0.6 3/5 7.7 ± 0.3 3/5 8.5 ± 0.3 -
†- - -
†
Not analyzed.
multiplex PCR kit was ~5 log CFU/g, the B. cereus in the enriched fresh-cut cabbage lettuce and baby leafy vegetable samples in TSB supplemented with 0.15% polymyxin B was detected at 6.7 and 6.1 log CFU/g, respectively. In addition, the number of positive samples was occasionally lower, despite longer enrichment times. These challenges arise probably due to a food matrix extracted from food components or background bacteria with longer enrichment times and uneven contamination levels in the sample; we
used only 20- or 10-g portion of the sample for the enrichment. Maher et al.
12)and Hyeon et al.
13)proposed that substances may contain inhibitors that reduce the accuracy and sensitivity of the PCR analysis. Rossen et al.
14)also proposed that food components and media may also reduce the accuracy or sensitivity of the PCR reaction while Wilson
15)reported that organic or phenolic compounds are common inhibitors of PCR reactions. Kim et al.
16)concurred on the necessity of enrichment of foods to isolate bacteria Table 2. Results (the number of positive samples/the number of total samples) of polymerase chain reaction analysis by Bacillus cereus multiplex PCR kit and B. cereus cell counts (n=5; mean ± standard deviation, log CFU/g) after enrichment of B. cereus in the fresh-cut baby leafy vegetables at 42°C for 0 h, 2 h, 3 h, 4 h, 5 h, 6 h, and 7 h
Enrichment time (h)
Initial concentration of Bacillus cereus (log CFU/g)
1 2 3 4 5
PCR results
Cell counts
PCR results
Cell counts
PCR results
Cell counts
PCR results
Cell counts
PCR results
Cell counts
0 0/5 2.0 ± 0.6 0/5 2.3 ± 0.4 0/5 2.9 ± 0.4 0/5 4.0 ± 0.2 2/5 5.4 ± 0.5
2 0/5 2.9 ± 0.2 0/5 3.1 ± 0.3 0/5 3.9 ± 0.9 0/5 5.1 ± 0.2 4/5 6.1 ± 0.3
3 0/5 4.0 ± 0.6 1/5 4.7 ± 0.1 2/5 5.8 ± 0.5 4/5 6.7 ± 0.2 4/5 7.6 ± 0.3
4 0/5 4.8 ± 0.4 1/5 5.3 ± 0.4 4/5 7.0 ± 0.3 4/5 7.9 ± 0.3 4/5 8.8 ± 0.1
5 1/5 5.3 ± 0.5 4/5 6.2 ± 0.7 4/5 6.6 ± 1.2 4/5 7.6 ± 0.7 - -
6 3/5 6.1 ± 1.0 4/5 7.0 ± 0.8 4/5 7.3 ± 0.4 3/5 7.8 ± 0.8 - -
7 4/5 7.3 ± 0.6 3/5 7.9 ± 0.5 4/5 8.5 ± 0.2 -
†- - -
†
Not analyzed.
Table 3. Bacillus cereus cell counts (log CFU/g) in the fresh-cut cabbage lettuce samples and the fresh-cut baby leafy vegetable samples, and the results (the number of positive sub-samples/the number of total sub-samples) of B. cereus multiplex PCR kit after enrichment by tryptic soy broth (TSB) with 0.15% polymyxin at 42°C for 0 h, 2 h, 3 h, 4 h, 5 h, 6 h, and 7 h
Sample Enrichment time (h)
The cell counts of Bacillus cereus (log CFU/g) The number of positive sub-samples/
total sub-samples Sample
1
Sample 2
Sample 3
Sample 4
Sample 5
Mean
± standard deviation
Fresh- cut cabbage
lettuce
0 3.4 3.4 3.4 3.4 3.4 3.4 ± 0.0 0/5
2 4.1 4.2 4.2 4.3 4.3 4.6 ± 0.1 0/5
3 6.1 6.1 6.1 6.1 6.1 6.1 ± 0.1 4/5
4 7.3 7.0 7.0 7.0 7.0 7.1 ± 0.1 4/5
5 7.9 8.0 8.0 7.9 7.9 7.9 ± 0.1 5/5
6 9.2 8.9 9.0 9.0 9.1 9.1 ± 0.1 5/5
7 8.9 8.8 8.9 8.7 8.8 8.8 ± 0.1 4/5
Fresh- cut baby leafy
vegetable
0 3.3 3.5 3.4 3.4 3.3 3.4 ± 0.1 0/5
2 4.7 4.7 4.7 4.6 4.5 4.6 ± 0.1 0/5
3 6.0 5.9 5.9 5.9 5.7 5.9 ± 0.1 0/5
4 7.0 7.0 7.0 7.0 6.9 7.0 ± 0.0 4/5
5 8.1 8.0 8.2 8.1 8.0 8.0 ± 0.1 5/5
6 8.5 8.6 8.5 8.4 8.5 8.5 ± 0.1 5/5
7 8.5 8.2 8.9 8.2 8.7 8.5 ± 0.3 4/5
from the food matrix and background microflora for the application of PCR. Therefore, B. cereus can be detected in fresh-cut cabbage lettuce over the limit of detection after enrichment, and the number of positive samples was occasionally low even with longer enrichment times. Sub- samples for each sample should be analyzed to determine if the sample is B. cereus-positive and to address the above challenges.
To determine the minimum number of sub-samples to be analyzed in every pack of fresh-cut vegetables, 5 sub- samples were analyzed using PCR. Out of 5 sub-samples of B. cereus (3.4 log CFU/g) inoculated cabbage lettuce
samples, 0, 0, 4, 4, 5, and 4 samples were positive after 0 h-, 2 h-, 3 h-, 4 h-, 5 h-, 6 h-, and 7 h-enrichment, respectively (Table 3). In addition, out of 5 sub-samples of baby leafy vegetables, 0, 0, 0, 4, 5, 5, and 4 samples were positive after 0 h-, 2 h-, 3 h-, 4 h-, 5 h-, 6 h-, and 7 h- enrichment, respectively (Table 3). In both kinds of samples, 4 sub-samples were the minimum numbers for a positive result in PCR analysis. Therefore, 3 sub-samples might be sufficient for a positive result if at least 1 sub-sample tests positive among 3 sub-samples. Kim et al.
17)also used 3 sub- samples for microbiological examination of the vegetable seed sprouts used, and Odumeru et al.
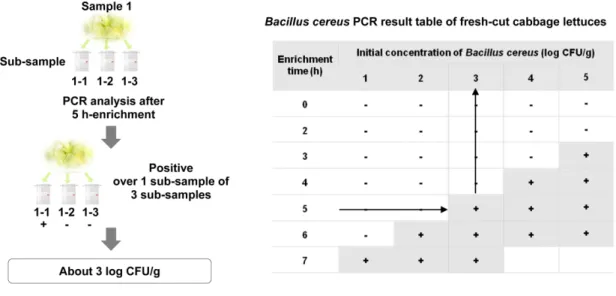
18)assessed the quality Fig. 1. Application of rapid detection methods for semi-quantification of Bacillus cereus in fresh-cut cabbage lettuce through combina- tion of enrichment and PCR detection.
Fig. 2. Application of rapid detection methods for semi-quantification of Bacillus cereus in fresh-cut baby leafy vegetables through com-
bination of enrichment and PCR detection.
of ready-to-use vegetables by analyzing 3 sub-samples. The number of sub-samples sufficient for analysis was determined to be 3 in this study as well.
Taken together, these results can lead to the development of a procedure for the semi-quantification of B. cereus in fresh-cut vegetables with a combination of enrichment and PCR analysis, as described in Fig 1-2. For instance, 3 sub- samples of fresh-cut cabbage lettuce samples were enriched, and 1 sub-sample was positive after 5-h enrichment. The sample then contained about 3 log CFU/g of B. cereus (Fig.
1). For fresh-cut baby leafy vegetables, if 1 sub-sample was positive after 4-h enrichment, the B. cereus cell counts were approximately 3 log CFU/g (Fig. 2).
Conclusion
Enrichment helps increase the B. cereus cell count, but the initial cell count after enrichment cannot be quantified. PCR analysis can identify B. cereus colonies on the plate, but it cannot be applied directly to the samples because its detection limit is too high. Therefore, the detection method developed in this study combines the advantages of both methods and can be used to rapidly semi-quantify B. cereus levels in fresh-cut vegetables.
Acknowledgement
This work was supported by the “Cooperative Research Program for Agriculture Science & Technology Development (Project No. PJ01193002)” Rural Development Administration, Republic of Korea.
국문요약