www.earticle.net
An Application of Support Vector Machines to Personal Credit Scoring: Focusing on Financial Institutions in China
Xuan-Ze Ding1, Young-Chan Lee2*
1Student, Dept. of Business Administration, Dongguk University
2Professor, Dept. of Business Administration, Dongguk University
Support Vector Machines을 이용한 개인신용평가 : 중국 금융기관을 중심으로
딩쉬엔저1, 이영찬2*
1동국대학교 대학원 석사과정, 2동국대학교 경영학부 교수
Abstract Personal credit scoring is an effective tool for banks to properly guide decision profitably on granting loans. Recently, many classification algorithms and models are used in personal credit scoring.
Personal credit scoring technology is usually divided into statistical method and non-statistical method.
Statistical method includes linear regression, discriminate analysis, logistic regression, and decision tree, etc.
Non-statistical method includes linear programming, neural network, genetic algorithm and support vector machine, etc. But for the development of the credit scoring model, there is no consistent conclusion to be drawn regarding which method is the best. In this paper, we will compare the performance of the most common scoring techniques such as logistic regression, neural network, and support vector machines using personal credit data of the financial institution in China. Specifically, we build three models respectively, classify the customers and compare analysis results. According to the results, support vector machine has better performance than logistic regression and neural networks.
Key Words : Personal Credit Scoring, Support Vector Machines, Artificial Neural Networks, Logistic Regression
요 약 개인신용평가는 은행이 대출을 승인할 때 수익성 있는 의사결정을 적절히 유도할 수 있는 효과적인 도구이다.
최근 많은 분류 알고리즘 및 모델이 개인신용평가에 사용되고 있다. 개인신용평가 기법은 대체로 통계적 방법과 비 통계 적 방법으로 구분된다. 통계적 방법에는 선형회귀분석, 판별분석, 로지스틱 회귀분석, 의사결정나무 등이 포함된다. 비 통 계적 방법에는 선형계획법, 신경망, 유전자 알고리즘 및 Support Vector Machines 등이 포함된다. 그러나 신용평가모형 개발을 위해 어떠한 방법이 최선인지에 관해서는 일관된 결론을 내리기는 어렵다. 본 논문에서는 중국 금융기관의 개인 신용 데이터를 사용하여 가장 대표적인 신용평가 기법인 로지스틱 회귀분석, 신경망 그리고 Support Vector Machines의 성능을 비교하고자 한다. 구체적으로, 세 가지 모형을 각각 구축하여 고객을 분류하고 분석 결과를 비교하였다. 분석결과 에 따르면, Support Vector Machines이 로지스틱 회귀분석과 신경망보다 더 나은 성능을 가지는 것으로 나타났다 .
키워드 : 개인신용평가, Support Vector Machines, 인공신경망, 로지스틱 회귀분석
*Corresponding Author : Young-Chan Lee ([email protected])
Received November 26, 2018 Revised December 7, 2018 Accepted December 14, 2018 Published December 31, 2018
1. Introduction
1.1 Research Backgroundwww.earticle.net
Credit scoring is the term used to describe formal statistical methods used for classifying applicants for credit into ‘good’ and ‘bad’ classes (Hand and Adams, 2000). The importance of such methods has increased with consumer credit growing dramatically in recent years. In 2016, the total amount of outstanding consumer credit was over 23.2 trillion dollars globally. For commercial banks credit consumption is an important part of the future development strategy, especially consumer credit service (credit card use, mobile credit payment like Alipay payment and Jingdong white bar). The development of consumer credit service can effectively retain customers of commercial banks, and it can also greatly promote the profit growth of commercial banks. Therefore, consumer credit service is one of the important strategic focus areas in commercial banks. However, due to the low level of risk management of personal credit assessment, the management methods are lagging, and the lack of an effective personal credit scoring method is one of the main reasons that hinder the development of personal consumption business.
Compared with traditional credit scoring, which is calculated by professional bank managers, automatic scoring has some obvious advantages. It saves costs and time for evaluating new credit applications; and it is consistent and objective [1].
Therefore, as the accuracy of scoring can greatly affect the interests of financial institutions, researchers have been continually striving to improve and enhance scoring accuracy rates in recent years. Credit scoring models using statistical techniques, Operational Research, and Artificial Intelligence (AI) technologies are being developed [2]. If these technologies are made accurately, more creditworthy applicants are granted credit, thereby increasing profits; non-creditworthy applicants are denied credit, thus decreasing losses [3]. In China, personal credit scores have just started in some places. In June 2014, the State Council of China
issued "Planning and Construction of Social Credit System (2014-2020)". By 2020, it is basically established to share credit information resources-based credit system covering the whole society. Based on this, it is particularly important to improve the personal credit scoring system.
Nowadays, many different credit scoring models have been developed by researchers and bank technical staff to evaluate credit applications. The most used of credit scoring models has Classification and Regression Tree (CART), Logistic Regression (LR), Support Vector Machine (SVM), Neural Network (NN), Expert system (ES) and Genetic Algorithm (GA). With rapid economic development, people do not just use cash or credit cards for consumption. A more convenient tool for consumption is important for us. But nowadays, we must accumulate money to get what we want. This situation will lower our quality of life. Consumer credit service will solve this problem while avoiding disadvantages. In consumer credit service, the level of consumption is important to applicants, and therefore, a good classification method is necessary.
To solve this problem, we use personal credit scoring with good classification methods. Support vector machine classification is currently an active research region and successfully resolves classification problems in many areas. Hence, this paper assesses the applicant’s credit level from the applicant’s input features. We focus on the artificial neural network, logistic regression and support vector machine, which has better performance and accuracy applicated to personal credit scoring.
2. Literature Review
2.1 Status of Consumer Credit Service
Consumer credit is a kind of credit that is defined as credit obtained (by private households) to finance any purchase other than property [4]. The
www.earticle.net
development of personal consumer credit service market is an irresistible economic system in any country. Large personal consumer credit service markets include the United States, England, and France and so on. For example, the balance of consumer credit is about two-thirds of GDP in the United States. The main participants are banks, financial service companies, insurance companies and retailers. Among them, banks play a dominant role. Today, every consumer that used to find different forms of financing has at least one or even three credit bureaus; more than 2 billion messages are added to these credit bureaus each month, and more than 2 million credit reports are sold daily to different requesters. These demanders obtain the required consumer credit report in real time, greatly reducing the time required to approve a loan, from the past few weeks to the resent few minutes or even seconds. Table 1 shows that consumer credit outstanding from 2012 to 2016.
<Table 1> Consumer Credit Outstanding Situation by Years Year (unit: billions of dollars)
M a j o r
holders 2012 2013 2014 2015 2016 Deposito
ryinstitutio ns
1,218.6 1,271.6 1,343.1 1,428.3 1,532.1 Finance
compani
es 679.8 679.1 684.1 561.3 547.9
C r e d i t
unions 243.6 265.6 302.8 342.3 380.3 Federal
governm
ent 622.2 735.5 846.2 949.7 1,049.3
Nonprofi t and educatio n a l institutio ns
58.0 51.8 47.6 44.9 41.9
Nonfina n c i a l
business 47.4 42.8 43.8 44.6 43.8 Pools of
securitiz
e d
assets
50.0 49.1 49.8 46.0 50.0
Source: The consumer credit report of federal reserve board, 2016
Table 2 shows American revolving credit and non-revolving credit situation from 2012 to 2016.
<Table 2> Revolving Credit and Non-Revolving Credit Situation
Year (unit: billions of dollars) Catego
ry 2012 2013 2014 2015 2016
Revolv
ing 845.2 857.1 891.1 909.6 969.6 Non-r
evolvi ng
2,074.5 2,238.5 2,426.4 2,507.6 2,675.6
Studen
t loans 1,054.6 1,145.5 1,236.3 1,320.1 1,407.9 Motor
vehicle loans
809.2 878.8 957.9 1,001.4 1,073.2
Source: The consumer credit report of federal reserve board,2016
According the table, we can find the consumer credit service increase by year. Consumer credit can promote economic development. Consumers who make use of credit to finance consumption purchases need to understand the financial cost of the credit they use [5]. For China, it still needs to learn from the experience of other countries to perfect the suitability of the consumer credit system. In order to promote the development of personal consumer credit service in China, we must clearly recognize the actual economic situation of China, and find the profit balance between consumers and the financial department, and we also need to improve the personal credit system of China and find a solution to other bad situations.
2.2 Status of Personal Credit Scoring
The personal credit assessment method is a method of dividing a population into different groups according to different characteristics. This idea of dividing the whole into groups into groups was first proposed by Fisher [6] in statistics. West [7] first recognized that the same method could be used to distinguish between "good" loans and "bad" loans, to evaluate the credit risk of the loan. The emergence
www.earticle.net
of credit card let the bank and their institutions understand the function and importance of credit scoring. In 1958, Bill and Earl found the first credit scoring system--FICO scoring. With the credit scoring system in the field of credit card to be successful, more credit assessment model also appears. The credit assessment model needs to be sufficiently high in predicting the ability to repay a loan, which would otherwise pose a significant risk to the banking industry. The current personal assessment method used by the financial sector is mainly to score cards. According to the applicant's n characteristics of the indicators, by the relevant professionals in the financial sector based on years of experience subjective given specific values.
Compared with traditional credit scoring, which is calculated by professional bank managers, automatic scoring has some obvious advantages: it saves cost and time for evaluating new credit applications; and it is consistent and objective [1]. According to [2]
credit scoring is “a set of decision models and their underlying techniques that aid credit lenders in the granting of credit”. A macro definition is considered in the modern work: credit scoring is a numerical deliverance based on a level analysis of applicant credit worthiness, a helpful instrument for assessment and provision of default risk, an important method in credit risk comment, and an active research area in financial risk management.
In China, all commercial banks have their own credit scoring models to calculate the credit level of an applicant. These models vary among banks, and banks have many models to calculate the credit level of an applicant. In 2013, the People’s Bank of China created a credit agency management approach. Since 2014, the People’s Bank of China has started a personal credit reporting business. But in the regional level, people can’t get their credit score in detail. So, when people has economic problems, they can’t get loans as quickly as they can, and sometimes, people can get a loan, but it
isn’t enough to solve the problems. Therefore, higher accuracy and quicker credit scoring are needed.
2.3 Logistic Regression
In statistics, logistic regression, or logit regression, or logit model is a regression model where the dependent variable (DV) is categorical. This article covers the case of a binary dependent variable—that is, where the output can take only two values, "0"
and "1", which represent outcomes such as pass/fail, win/lose, alive/dead or healthy/sick. Cases where the dependent variable has more than two outcome categories may be analyzed in multinomial logistic regression, or, if the multiple categories are ordered, in ordinal logistic regression. In the terminology of economics, logistic regression is an example of a qualitative response/discrete choice model.
Assuming that the loan is issued with y, the y
= 1 indicates that the borrower defaults (usually referred to as a "bad" loan), y = 0 indicates that the borrower does not default (usually referred to as a "good "The loan). Our goal is to use the existing sample data to establish the model, the borrower default (y = 1) probability p to predict. Logistic regression is a good way to deal with this binary classification problem. In the Logistic regression model, suppose:
P(Y=1│X=x)=exp(x'β)/(1+exp(x'β))
Pavlidis et al. [8] applied logistic regression to personal credit scoring and developed an adaptive online algorithm for logistic regression. Yap [9]
compared the logistic regression, decision tree and credit scorecard technology; the result shows that logistic regression has better performance than other two classification methods. In recent years, Cock et al. [10] used the three methods of logistic regression, support vector machine and decision tree to classify and predict seven datasets of UCI repository.
www.earticle.net
The basic settings of multinomial logistic regression is the same as in logistic regression, the only difference is the dependent variables are categorical rather than binary. Assume we have a set of training data with n observations {, }, where ∈ and ∈⋯ for ⋯. The probability that the i-th observation belongs to the j-th category apart from the last class is
∙
Since the sum of probabilities equals one, the last class has probability
Where is the set of regression coefficients associated with output j and is an m*(K-1) matrix. The negative multinomial log-likelihood is:
∙ ln
∙ ln
Where denotes the output variable that the i-th observation belongs to the j-th category.
2.4 Neural Network
Neural Network (NN) is an intelligent information processing technology that imitates the human brain information processing process. It has self-organization, self-adaptability and strong robustness. Representative neural network models are back propagation neural network, group method of data handling network, radial basis function (RBF) network, and multi-layer perceptron (MLP) network. Some of the accuracies as listed above are
average rates in a group of models and others are the best rates. A neural network [11] is a system based on input variables, also known as explanatory variables, combined by linear and non-linear interactions through one or more hidden layers, resulting in the output variables, also called response variables. Neural networks were created to imitate the human brain, since it is based on delivering electronic signals between neurons in huge numbers.
In some data-sets, the neural networks have the highest average correct classification rate when compared with other traditional techniques, such as discriminant analysis and logistic regression, because results were very close [12].
Marcano-Cedeno et al. [13] applied the artificial metaplasticity neural network to credit scoring, and used the UCI dataset (Australia and German dataset) to build a model. As a result, the accuracy of new neural network method (92.751.55, 84.67 2.29) surpassed that of Back Propagation (84.06), and Pang [14] established a credit evaluation model of listed companies based on the radial basis function network and got a high classification accuracy rate (98. 96%).In recent studies, Ayouche et al. [15] compared the multi-layer neural network and made a linear regression and discriminant analysis. The result shows that the multi-layer neural network has better performance applicable to credit scoring. Moreover, he combined the traditional statistic method and the neural network to build a new model applicable to credit scoring. Chi et al.
[16] compared the neural network classifier with stepwise logistic regression, decision tree and stepwise discriminant analysis to get a hybrid model.
2.5 Support Vector Machine
Support vector machine (SVM) use a linear model to implement non-linear class boundaries through non-linear mapping input vectors into a high-dimensional feature space. The linear model constructed in the new space can represent a
www.earticle.net
non-linear decision boundary in the original space. In the new space, an optimal separating hyperplane (OSH) is constructed. Thus, support vector machine is known as the algorithm that finds a special kind of linear model, the maximum margin hyperplane.
The maximum margin hyperplane gives the maximum separation between decision classes. The training examples that called support vectors. All other training examples are irrelevant for defining the binary class boundaries [17, 18, 19, 20].
A brief description of support vector machine algorithm is supposing as follow. Given a training set
of n observation with input vector,
⋯
∈ and output labels∈ , the support vector machine classifier according to Vapnik’s original formulation, satisfies the following conditions:
∅ ≥ i f ∅ ≥ i f (1) Which is equivalent to
∅
≥ ⋯ (2)Where w indicates the weight vector and b is the bias. Non-linear function ∅ ∙ → maps input or measurement space to a high-dimension, and possibly infinite-dimensional, feature space. Through Eq. (2) the construction of two parallel bounding hyperplanes at opposite sides of a separating hyperplane in the feature space with margin width between both hyperplanes is ∥∥
.
In original weight space, the classifier takes the decision function form (3):
∅
(3)The Figure 1 shows the basic binary classification
based on support vector machine.
[Fig. 1] Binary Classification on SVM
Support vector machines are simple enough to be analyzed considerably. Because it can be represented to a linear method in a high dimensional characteristic space non-linearly related to input space. In this situation, support vector machines may serve as a promising alternative combining the strengths of conventional statistical methods that are more theory-driven and easy to analyze, and more data-driven, distribution-free and robust machine learning methods [21].
Chen [22] established credit scoring models combined support vector machine, classification and regression tree and multivariate adaptive regression splines. Through the experiment, he got the best average accuracy (86.75%) with support vector machine + multivariate adaptive regression splines.
Zhou [23] proposed several SVM ensemble models for credit risk assessment. Even though reliability-based ensemble models cannot achieve the best percentage correctly classified performance for all the data-sets, they can achieve performance as good as the best, with 5% level of confidence. The best model is least-squares support vector machines with accuracy of 63.95%.
Similarly, Li et al. [24] used a semi-supervised support vector machine to improve the performance of the credit scoring model, compared to the industrial benchmark of logistic regression. The result shows that the semi-supervised support vector machine has better performance applied to credit
www.earticle.net
Applicant Source Defective customer Overdue Bad debts Loan balance Refund record Refuse record Mandatory stop
card record Card number Use frequency Census register Level of
urbanization
Gender Age Married
Education Job Monthly income
Monthly expenses House Family income Credit card
amount level
scoring with accuracy (91.4%). Shi and Xu [25]
presented a method for using fuzzy support vector machines to establish credit scoring models. The model overall yields the best performance among all the models when appropriately trained on two real-world credit data sets.
3. Research Method
3.1 Research Process
Our study will use the real data gathered from a commercial bank of china. In addition, because the number of sample data will affect the model build and the impact of precision. So, the amount of data will be as much as possible. Figure 2 shown us the experiment produce.
[Fig. 2] Research Process
4. Experimental Design and Analysis
Results
This part mainly introduces the situation of bank that provides the data and the experimental process.
At the beginning, our study introduced the applicant’s credit level with their basic information(features). Then, the experiment follows the research produce and analysis process follows the research framework with explanation. In this study, the experiments are conducted using MATLAB R2016a.
4.1 Data Description
In this study, the dataset is adopted by a commercial bank in china that is willing to provide their applicant’s credit card data. According the dataset, we get mainly features with their levels.
The mainly features of the personal basic information. The data record as follow in Table 3.
<Table 3> Data Record
First, pre-processed the applicant’s data by deleting the duplicated record and those with missing values or inaccurate values. After deleting the inaccurate values, 5500 applicants who have already prepared for products. According to the descriptive statistical analysis, the result shown in Table 9. We can clearly to understand that among 5500 applicants, male applicants were 2256, accounting for 41% of the total number. Female applicants were 3244, accounting for 59% of the total number. Among the 5500 applicants, the
www.earticle.net
KMO and Bartlett’s Test Kaiser-Meyer-Olkin Measure of Sampling Adequacy 0.896
B a r t l e t t ’ s
Test of
Sphericity
A p p r o x .
Chi-Square 83639.643
df 231
Sig 0.000
largest number of applicants aged 25 to 29 years old, a total of 876. Followed by 20 to 24 and 30 to 34 groups, a total of 868 and 862. These shows that the main applicant of credit card applicant is female.
The age of applicants is in middle-aged people and young people. All data is already divide the 4 classes of response variable. In this study, we use the real-dataset to build the multiple classification problems. we conducted factor analysis of the data with SPSS 19.0. The result shows the Table 4.
<Table 4> Factory Analysis
According the Table 4, we can see the KMO value is 0.896 and sig is 0.000. that indicate the dataset suitable to do the factory analysis and the variables has relationship.
4.2 Logistic Regression
First, our experiment uses multiple logistic regression to solve the classification problem. Before the experiment, we must check the multicollinearity problems between the variables. We use the SPSS 19.0 to check this problem, the Table 5 shows the model summary and Table 6 shows about the multicollinearity problem.
<Table 5> Model Summary
Model R R Square Adjusted R
Square Std. Error of
t h e
Estimate
1 0.904 0.817 0.816 0.458
<Table 6> Multicollinearity Problem
Variables Sig VIF
Applicant source 0.000 1.059 Defective customer 0.000 2.385
Overdue 0.000 18.133
Bad debts 0.000 14.547
Loan balance 0.000 29.360
Refund record 0.003 15.385 Refuse record 0.000 18.173 Mandatory stop
record 0.000 40.605
Card number 0.001 1.025
Frequency 0.000 1.035
Census register 0.399 1.024
Level of
urbanization 0.000 1.033
Gender 0.029 1.040
Age 0.016 1.026
Married 0.415 1.027
Education 0.005 1.033
Job 0.068 1.156
Income (monthly) 0.000 1.411 Expenses (monthly) 0.000 1.027
House 0.263 1.099
Family income
(monthly) 0.000 1.414
Credit card amount 0.231 1.152
We can find that the mandatory stop card record and loan balance VIF value are 40.605 and 29.360.
The data set has the multicollinearity problem. First, a bank officer suggested that the variables of overdue, bad debts, bank refund, refuse record and mandatory stop card record are to check a applicant’s credit card history. If one of the variables is yes, the applicant is highly likely to be rejected by the bank. In this situation, we just delete variables with a high VIF value (mandatory stop card record, loan balance, overdue). Table 7 shows the result of change.
www.earticle.net
<Table 7> Multicollinearity Problem (change)
Variables Sig VIF
A p p l i c a n t
source 0.000 1.050
D e f e c t i v e
customer 0.000 2.040
Bad debts 0.000 10.137
Refund record 0.000 8.888 Refuse record 0.000 9.845 Card number 0.001 1.017
Frequency 0.000 1.032
C e n s u s
register 0.400 1.020
Level of
urbanization 0.000 1.028
Gender 0.015 1.033
Age 0.016 1.021
Married 0.272 1.023
Education 0.014 1.032
Job 0.108 1.152
I n c o m e
(monthly) 0.000 1.400
E x p e n s e s
(monthly) 0.000 1.025
House 0.278 1.091
Family income
(monthly) 0.000 1.413
Credit card
amount 0.158 1.137
We can see the all variables VIF value are less than 10, expect the bad debts. All the rest variables will predict the level of applicants. We divide the 4 classifiers to solve the multiple classification problems. let each class to be the 1 in the whole set and rest of the data be the 0. each classifier can only identify that category. We exclude the multicollinearity problem variables and use the rest variables to do the experiment. Each classifier basic setting is 10-folds cross validation and PCA is 95%.
As the figure 3, we can clearly see the AUC value is 0.61 and accuracy is 81.9%. That situation indicates the classifier 1 has lower performance.
[Fig. 3] Level 1 Classifier Experiment
[Fig. 4] Level 2 Classifier Experiment
As the figure 4, the value of AUC is 0.88 and the accuracy value is 80.5%. that situation indicates the classifier 2 has certainly accuracy with performance.
[Fig. 5] Level 3 Classifier Experiment
As the figure 5, the accuracy value is 74.8% and AUC value is 0.71. that indicates the classifier 3 also has the certain accuracy with performance.
www.earticle.net
Level Accuracy AUC
1 81.9% 0.61
2 80.5% 0.88
3 74.8% 0.71
4 87.5% 0.94
[Fig. 6] Level 4 Classifier Experiment
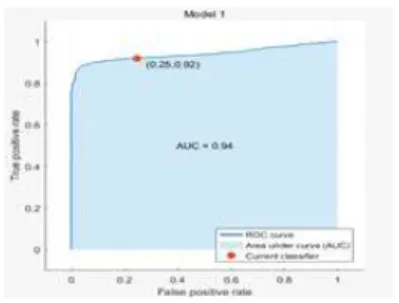
As the figure 6, the accuracy value is 87.3% and the AUC value is 0.94. That indicates the classifier 4 has the high accuracy with performance.
<Table 8> Accuracy of Logistic Regression
As the Table 8, we can see each classifier with their accuracy and AUC value. The best accuracy is 87.5% with AUC value is 0.94 when we classifier the level 4 experiment.
4.3 Neural Network Experiment
In the neural network experiment, our study varies the number of nodes in the hidden layer and stopping criteria for training. Use the back-propagation neural network to do experiment.
The algorithm will use the three algorithms, Levenberg-marquardt, Bayesian regularization and scaled conjugate gradient to training model. All sample set is split into three subsets: a training set of 70%(3850), a test set of 15%(825) and validation set of 15%(825). In this experiment, we random the data to be training data for select the best accuracy with model. And it can promise the credibility. The parameters we use the default set. Before the experiment, we must change the level (1,2,3,4)
became the computer order type
(1000,0100,0010,0001) for neural network, therefore, we can solve the avoid the different dimensions of the input data and output data cannot experimenting problems. The results of neural network are summarized in Table 9.
<Table 9> The Performance of Neural Network Learn
i n g epoch
Hidde n nodes
Traini ng data
Valida tion data
Test data All
1000
3 81.6% 78.0% 77.0% 78.9%
4 82.0% 78.8% 78.0% 79.6%
5 83.1% 80.2% 74.1% 79.1%
6 83.6% 81.4% 75.6% 80.2%
7 84.5% 82.5% 76.1% 81.3%
8 85.7% 83.5% 76.9% 82.0%
9 87.8% 85.6% 77.0% 83.5%
10 89.8% 87.9% 77.8% 85.2%
11 91.2% 88.5% 77.4% 85.7%
12 91.6% 89.1% 78.0% 86.2%
13 91.5% 89.4% 78.4% 86.4%
14 91.8% 89.6% 78.3% 86.6%
15 91.8% 89.7% 80.3% 87.3%
From the results of the experiment, we can conclude that the neural network shows better performance than logistic regression in personal credit scoring prediction while avoiding the overfitting problem.
4.4 Support Vector Machine Experiment In the support vector machine, all data set is split into two subsets: a training data set of 80%(4400) and a test data set of 20%(1100) of the total data (5500) respectively. This experiment will use the MATLAB language to build it. In the experiment, we set the four classifiers to classify each level.
Figure 7 show the main command of the experiment and the Table 10 shows the result of the support vector machine. In this experiment, we
www.earticle.net
also change the level (1,2,3,4) became the computer binary number (1000,0100,0010,0001).
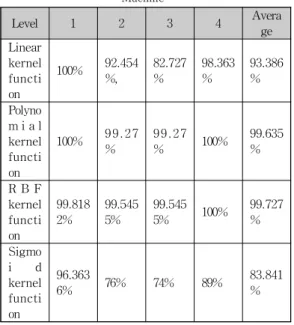
<Table 10> The Performance of Support Vector Machine
Level 1 2 3 4 Avera
ge Linear
kernel functi on
100% 92.454
%, 82.727
% 98.363
% 93.386
% Polyno
m i a l kernel functi on
100% 9 9 . 2 7
% 9 9 . 2 7
% 100% 99.635
%
R B F kernel functi on
99.818 2% 99.545
5% 99.545
5% 100% 99.727
% Sigmo
i d
kernel functi on
96.363
6% 76% 74% 89% 83.841
%
According the result, we can know that accuracy of each label. The average best one is 99.727% and the worst one is the 83.841%. the best one is C-SVC with polynomial kernel function classifier.
<Table 11> The Accuracy of Algorithms (%) S u p p o r t
v e c t o r machine
N e u r a l
network Lo gi s t i c regression
Accuracy 99.727 91.8 87.5
Table 11 shows the best accuracy of support vector machine, neural network and logistic regression. The support vector machine has the best performance with high accuracy than neural network and logistic regression.
5. Conclusion
5.1 Summary of Research Results
This study applied a support vector machine to corporate credit rating prediction problems, and showed its classification and prediction power compared to other main classification methods with personal credit scoring. Inputting the vectors into a high-dimensional feature space, the support vector machine transforms complex problems with complex decision surfaces into simpler problems that can use linear discriminant analysis functions, and it has been successfully introduced in several financial applications recently. In practical applications, support vector machines have achieved similar or better performance than neural network or logistic regression. Support vector machines can conduct classification learning with a small amount of data.
And in multiple classification problems, it also has better performance for classification and prediction.
In China, consumer credit service is not only concerned with banks, but also third payment applications and third credit departments. The latter accept the applicant’s demand and check their credit, and confirm with banks or national credit departments. In fact, they don’t have their own systems or predict models for their service.
Therefore, this study will give them some advice.
5.2 Implications
First and foremost, they can use a classification model to identify customers’ basic information.
Based on this information they can predict the credit level of an applicant, and then decide whether to give them a loan or not. With the accumulation of more applicant transaction data and change of national policy, it is necessary to develop a new classification model based on the new definition of the applicant. This cycle of collecting data, building models and using those for credit scoring should be continuous. Thus, improving people's consumption
www.earticle.net
patterns and bank development planning is the future development route. Change the traditional concept of consumption of Chinese consumers.
Secondly, for a commercial bank, a higher accuracy rate credit rating model can better improve the business level of bank employees to avoid unnecessary mistakes. Moreover, it can improve the profits of commercial banks. This type of credit consumption will be more convenient for the applicant. In the future, this consumption model will take the lead. There will be a better scoring model to promote the development of this model. As this model is gradually being formed, the global economy will gradually rise.
Finally, the development of personal consumer credit service must be the trend of the times.
Promoting development can increase domestic demand in the country. However, rapid development is bound to have an impact on China’s financial system. Building a suitable and perfect credit service system is necessary. Certainly, one of the most accurate and time-saving credit scoring systems is also indispensable.
5.3 Limitations and Future Research
First, focus on the construction of predictive models. Our computational results show that every model has its advantages and different models often lead to different results. Hence, the integrated prediction model, which combines different prediction models used in this study, will be a valuable research direction.
The second direction of future research is how to choose the most appropriate model based on the real-world situation.
Finally, during the experiment, we find that overfitting problems are common in the neural network, so in the future we will use the code to build a neural network model to fix this problem.
We think the parameters are important in the experiment. So, we use the other method to find the
best parameter, and then build the model for prediction.
REFERENCES
[1] Marqués, A. I., García, V., and Sánchez, J.
S. (2013), “On the suitability of resampling techniques for the class imbalance problem in credit scoring”, Journal of the Operational Research Society, 64(7), 1060-1070.
[2] Thomas, L. C., Edelman, D. B., and Crook, L. N. (2002), Credit Scoring and Its Applications, Philadelphia: Society for Industrial and Applied Mathematics.
[3] West, D. (2002), “Neural network credit scoring models”, Computers and Operations Research, 27(12), 1131-1152.
[4] Guardia, N. (2002), “Consumer credit in the European Union”, ECRI Research Report 1, 1-39.
[5] Richard, D., and John, G. (2013),
“Financial literacy and consumer credit portfolios”, Journal of Banking &
Finance, 37(7), 2246-2254.
[6] Fisher, R. A., “The Use of Multiple Measurements in Taxonomic Problems”, Annals of Eugenics, Vol. 7, No. 2, 1936, pp. 179-188.
[7] West, D. (2000), “Neural network credit scoring models”, Computers &
Operations Research, 27(12), 1131-1152.
[8] Pavlidis, N., Tasoulis, D., Adams, N., and Hand, D. (2012), “Adaptive consumer credit classification”, Journal of the Operational Research Society, 63(12), 1645-1654.
[9] Yap, B., Ong, S., and Husain, N. (2011),
“Using data mining to improve assessment of credit worthiness via credit
www.earticle.net
scoring models”, Expert Systems with Applications, 38(10), 13274-13283.
[10] Cock, M. D., Dowsley, R., Horst, C., Katti, R., Nascimento, A., & Poon, W. S.
(2017)., “Efficient and private scoring of decision trees, support vector machines and logistic regression models based on pre-computation”, IEEE Transactions on Dependable & Secure Computing, 16(2), 217-230.
[11] Ripley, B. D. (1996), Pattern Recognition and Neural Networks, Cambridge University Press.
[12] Abdou, H., Pointon, J., and El-Masry, A.
(2008), “Neural nets versus conventional techniques in credit scoring in egyptian banking”, Expert Systems with Applications, 35(3), 1275-1292.
[13] Marcano-Cedeno, A.,
Marin-De-La-Barcena, A., Jimenez-Trillo, J., Pinuela, J., and Andina, D. (2011),
“Artificial metaplasticity neural network applied to credit scoring”, International Journal of Neural Systems, 21(4), 311-317.
[14] Pang, S.-L. (2005), “Study on credit scoring model and forecasting based on probabilistic neural network”, System Engineering Theory and Practice, 25(5), 43-48.
[15] Ayouche, S., Aboulaich, R., & Ellaia, R.
(2017). “Partnership credit scoring classification problem: a neural network approach”, International Journal of Applied Engineering Research, 12(5), 693-704.
[16] Chi, G., Abedin, MZ., and Fahmida, E.M.
(2017), “Chinese Small Business Credit Scoring: Application of Multiple Hybrids Neural Network”, International Journal of Database Theory and Application, 10(2),
1-22.
[17] Cristianini, N., and Shawe-Taylor, J.
(2000), An introduction to support vector machines, Cambridge, England: Cambridge University Press.
[18] Gunn, S. R. (1998), “Support vector machines for classification and regression”, Technical Report, University of Southampton.
[19] Hearst, M. A., Dumais, S. T., Osman, E., Platt, J., and Scholkopf, B. (1998),
“Support vector machines”, IEEE Intelligent System, 13(4), 18-28.
[20] Vapnik, V. (1998), Statistical learning theory, New York: Springer.
[21] Lee, Y. C. (2006), “Application of support vector machines to corporate credit rating prediction”, Expert Systems with Applications, 33(1), 67–74.
[22] Chen, W., Ma, C., and Ma, L. (2009),
“Mining the customer credit using hybrid support vector machine technique”, Expert Systems with Applications, 36(4), 7611-7616.
[23] Zhou, L., Lai, K., Yu, L. (2010), “Least squares support vector machines ensemble models for credit scoring”, Expert Systems with Applications, 37(1), 127-133.
[24] Li, Z., Tian, Y., Li, K., Zhou, F., and Yang, W. (2017), “Reject inference in credit scoring using semi-supervised support vector machines”, Expert Systems with Applications, 74, 105-114.
[25] Shi, J., and Xu, B., “Credit scoring by fuzzy support vector machines with a novel membership function”, Journal of Risk and Financial Management, 9(4), 13-23.
www.earticle.net
딩쉬엔저(Xuan-Ze Ding) [학생회원]
․2018년 2월 : 동국대학교 글로 벌비즈니스(석사)
․관심분야 : 개인 및 기업신용평가, 데이터마이닝
․E-Mail : [email protected]
이영찬(Young-Chan Lee) [정회원]
․1993년 2월 : 서강대학교 (경영 학사)
․1995년 2월: 서강대학교(경영 학 석사)
․2003년 2월: 서강대학교(경영 학 박사)
․2004년 2월~ 현재: 동국대학 교 경주캠퍼스 경영학부 교수
․관심분야 : 기업성과측정, 데이터마이닝, 복잡계 이론, 다기준의사결정
․E-Mail : [email protected]