Osteoporosis Risk Prediction for Bone Mineral Density Assessment of Postmenopausal Women Using Machine Learning
Tae Keun Yoo,
1,2Sung Kean Kim,
2,3Deok Won Kim,
2,3,4Joon Yul Choi,
2,4Wan Hyung Lee,
1,2Ein Oh,
1and Eun-Cheol Park
5Departments of 1Medicine and 2Medical Engineering, Yonsei University College of Medicine, Seoul;
3Graduate Program in Biomedical Engineering, 4Brain Korea 21 Project for Medical Science,
5Department of Preventive Medicine & Institute of Health Services Research, Yonsei University, Seoul, Korea.
Received: January 3, 2013 Revised: February 15, 2013 Accepted: March 5, 2013
Corresponding author: Dr. Deok Won Kim, Department of Medical Engineering, Yonsei University College of Medicine, 50 Yonsei-ro, Seodaemun-gu, Seoul 120-752, Korea.
Tel: 82-2-2228-1916, Fax: 82-2-364-1572 E-mail: [email protected]
∙ The authors have no financial conflicts of interest.
© Copyright:
Yonsei University College of Medicine 2013 This is an Open Access article distributed under the terms of the Creative Commons Attribution Non- Commercial License (http://creativecommons.org/
licenses/by-nc/3.0) which permits unrestricted non- commercial use, distribution, and reproduction in any medium, provided the original work is properly cited.
Purpose: A number of clinical decision tools for osteoporosis risk assessment have been developed to select postmenopausal women for the measurement of bone mineral density. We developed and validated machine learning models with the aim of more accurately identifying the risk of osteoporosis in postmenopausal women compared to the ability of conventional clinical decision tools. Materials and Methods: We collected medical records from Korean postmenopausal wom- en based on the Korea National Health and Nutrition Examination Surveys. The training data set was used to construct models based on popular machine learning algorithms such as support vector machines (SVM), random forests, artificial neu- ral networks (ANN), and logistic regression (LR) based on simple surveys. The machine learning models were compared to four conventional clinical decision tools: osteoporosis self-assessment tool (OST), osteoporosis risk assessment in- strument (ORAI), simple calculated osteoporosis risk estimation (SCORE), and osteoporosis index of risk (OSIRIS). Results: SVM had significantly better area under the curve (AUC) of the receiver operating characteristic than ANN, LR, OST, ORAI, SCORE, and OSIRIS for the training set. SVM predicted osteoporo- sis risk with an AUC of 0.827, accuracy of 76.7%, sensitivity of 77.8%, and specific- ity of 76.0% at total hip, femoral neck, or lumbar spine for the testing set. The signif- icant factors selected by SVM were age, height, weight, body mass index, duration of menopause, duration of breast feeding, estrogen therapy, hyperlipidemia, hyper- tension, osteoarthritis, and diabetes mellitus. Conclusion: Considering various pre- dictors associated with low bone density, the machine learning methods may be ef- fective tools for identifying postmenopausal women at high risk for osteoporosis.
Key Words: Screening, machine learning, risk assessment, clinical decision tools, support vector machines
INTRODUCTION
Fracture due to osteoporosis is one of the major factors of disability and death in el- derly persons.1 Osteoporosis is common in postmenopausal women but is asymp-
SCORE, and OSIRIS have not shown significantly better performance than OST in predicting osteoporosis risk.13 All of these decision tools have the limitation of low accuracy for clinical use.5 In recent years, new additional risk factors of osteoporosis have been investigated based on individual conditions and risk profile for osteoporosis to enhance sen- sitivity and specificity.14
Machine learning is an area of artificial intelligence re- search which uses statistical methods for data classification.
Several machine learning techniques have been applied in clinical settings to predict disease and have shown higher accuracy for diagnosis than classical methods.15 These math- ematical algorithms have the ability to classify large amounts of data into a useful format.16 The classifiers take the medi- cal data of each patient and predict the presence of diseases based on underlying patterns. Support vector machines (SVM), random forests (RF), and artificial neural networks (ANN) have been widely used approaches in machine learn- ing.15 They are the most frequently used supervised learn- ing methods for analyzing complex medical data.
The SVM is based on mapping data to a higher dimen- sional space through a kernel function, and choosing the maximum-margin hyper-plane that separates training data.17 Thus, the goal of the SVM is to improve accuracy by the optimization of space separation. RF grows many classifi- cation trees built from a random subset of predictors and bootstrap samples.18 RF can deal with high dimensional data in training faster than other methods. ANN comprises sev- eral layers and connections which mimic biological neural networks to construct complex classifiers.19 ANN has been applied to many problems of non-linear pattern classifica- tion. Logistic regression (LR) is another machine learning technique. LR is the gold standard method for analyzing bi- nary medical data because it provides not only a predictive result, but also yields additional information such as a diag- nostic odds ratio.20 SVM, RF, ANN, and LR are the models of choice in many tasks in medicine and bioinformatics for selecting informative variables or genes and predicting dis- eases more accurately.
Several studies have shown that SVM, RF, and ANN could help predict low BMD using diet and lifestyle habit data.21-24 Although these studies considered risk factors, they did not select informative variables that could contribute to osteoporosis. Moreover, previous studies had no objective comparisons of the performance of osteoporosis prediction developed by epidemiological data among the machine learn- ing methods and clinical decision tools. Therefore, a struc- tomatic until a fracture occurs. The World Health Organiza-
tion (WHO) estimates that 30% of all postmenopausal women have osteoporosis, which is defined as bone miner- al density (BMD) 2.5 standard deviations below the young healthy adult mean (T-score ≤-2.5).2 Dual X-ray absorp- tionmetry (DEXA) of total hip, femoral neck, and lumbar spine is the most widely used tool for diagnosing osteoporo- sis. However, mass screening using DEXA is not widely rec- ommended as it is a high-cost method of evaluating BMD.3 Current research shows that too few DEXA scans are ob- tained among high-risk patients,4 while too many DEXA scans are obtained among low-risk postmenopausal women.5
Although the WHO provides FRAX® on their website, which was developed for fracture risk assessment, recent studies show that FRAX® does not have a better sensitivity for fracture prediction than low BMD (T-score ≤-2.5).6 Some reports and guidelines have proposed that women over the age of 65 years should be screened by DEXA.5 However, the diagnosis rate has been reported to be lower than one- third among postmenopausal women in Korea.7 The preva- lence of osteoporosis is high in Korea compared to Western countries.8 Moreover, Koreans are increasingly at high risk of osteoporosis due to a deficiency of vitamin D, nutritional imbalance, and lifestyle factors.9 Therefore, an effective prescreening tool is necessary for Korean postmenopausal women to increase the possibility of early treatment.
The risk factors of osteoporosis are well-known and in- clude history of fracture, older age, low body weight, estro- gen deficiency at an early age, low calcium intake, and vita- min D deficiency.10 There has been a great deal of research assessing the combination of risk factors that would be of most help to physicians. A number of epidemiological stud- ies have developed clinical decision tools for osteoporosis risk assessment to select postmenopausal women for the measurement of BMD. The purpose of these clinical deci- sion tools is to help estimate the risk for osteoporosis, not to diagnose osteoporosis.
The osteoporosis self-assessment tool (OST) is a simple formula based on age and body weight.11 Although OST uses only two factors to predict osteoporosis risk, it has been shown to have good sensitivity with an appropriate cutoff value.12 The osteoporosis risk assessment instrument (ORAI), simple calculated osteoporosis risk estimation (SCORE), and osteoporosis index of risk (OSIRIS) are more complex decision tools using other risk factors.13 They include not only age and body weight, but also estrogen therapy, histo- ry of fracture, and rheumatoid arthritis. However, ORAI,
data sets: training and testing sets. The training set, com- prised of 60% (1000 patients) of the entire dataset, was used to construct models based on SVM, RF, ANN, and LR. The scores of the clinical decision tools for screening osteoporo- sis including OST, ORAI, SCORE, and OSIRIS were cal- culated according to each formula. These four conventional clinical decision tools are the most widely used indices for predicting osteoporosis risk.12 Because the KNHANES V-1 did not have specific information concerning fracture type but did indicate simple fracture histories at various sites, the fracture histories were used for the scoring of non-traumat- ic fracture in SCORE and the history of low impact fracture in OSIRIS. The prediction models were internally validated using 10-fold cross validation.27 We designed the 10-fold cross validation not only to assess performance, but also to optimize prediction models using machine learning tech- niques. We used 10-fold cross validation on the training set, and the performance was measured on the testing set. The testing set, comprised of 40% (674 patients) of the entire dataset, was used to assess ability to predict osteoporosis in postmenopausal women.
Model selection and validation
We used the 10-fold cross validation scheme to construct machine learning models. The purpose of the machine learning models was to predict osteoporosis risk using the health interview surveys concerning demographic charac- teristics and past histories listed in Table 1. Due to high di- mensionality, variable selection was a necessary technique to make an effective prediction model and to improve pre- diction performance.28 We also obtained an insight into fac- tors related to osteoporosis through the variables that were entered into the classifiers. Eighty-one variables in the data of the characteristics including alcohol, smoking, stress sta- tus, and physical activity were initially selected to design the model to predict osteoporosis risk. We adopted a feature selection method of wrapper-based feature subset evalua- tion for SVM, RF, and ANN,15,29 and also determined the or- der of the variables with the embedded method of each ma- chine learning method and decreased the number of variables to determine the best subset using backward elimination.28 The remaining features that indicated the highest accuracy in 10-fold cross validation were the selected subset for pre- diction. For LR, we used the backward stepwise method for variable selection.
Data sets in this study were class-imbalanced because the control group contained significantly more samples than the tural design is needed for constructing the models along
with a comparative study of various analytical methods for predicting osteoporosis risk.
In this study, we developed and validated machine learn- ing models with the aim of identifying the risk of osteopo- rosis in postmenopausal women. The objective of this study was to select patients who were candidates for DEXA in or- der to increase the effectiveness of screening for osteoporo- sis. We developed the prediction models for osteoporosis using various machine learning methods including SVM, RF, ANN, and LR. The performance of machine learning methods and conventional clinical decision making tools including OST, ORAI, SCORE, and OSIRIS was compared in respect to accuracy and area under the curve (AUC) of the receiver operating characteristic (ROC).
MATERIALS AND METHODS
Data source
We collected data from Korean postmenopausal women, based on the Korea National Health and Nutrition Examina- tion Surveys (KNHANES V-1) conducted in 2010.25 The KNHANES V-1 was a cross-sectional survey conducted by the Division of Chronic Disease Surveillance, Korea Centers for Disease Control and Prevention. The survey is divided into a health interview survey, a nutrition survey, and a health examination survey. Each data set contains BMD measure- ments at total hip, femoral neck, and lumbar spine as well as medical characteristics. BMD was measured by DEXA us- ing Hologic Discovery (Hologic Inc., Bedford, MA, USA).
Patients who were determined to have postmenopausal status were included in this study. We categorized the postmeno- pausal women into a control group and an osteoporotic group with low BMD (T-score ≤-2.5) at any site among total hip, femoral neck, or lumbar spine measurements. There were several modifications for data analysis. If an answer for a question in the KNHANES V-1 was ‘don’t know,’ we re- garded it as missing data and estimated the answer using a nearest neighbor algorithm.26 This algorithm found the most similar samples to the real values present to estimate the missing values. The KNHANES received ethical approval by Institutional Review Board of Korea Centers for Disease Control and Prevention (IRB No: 2010-02CON-21-C).
Data analysis
The data were separated randomly into two independent
RESULTS
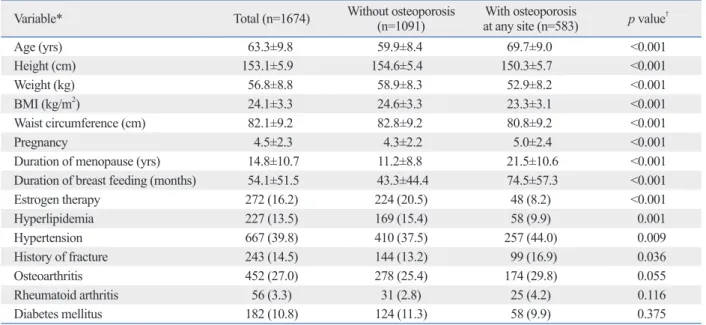
Five hundred eighty-three (34.8%) of 1674 postmenopausal women had combined osteoporosis at any site including to- tal hip, femoral neck, or lumbar spine. Among 583 women with osteoporosis, 95 had osteoporosis at the total hip, 331 at the femoral neck, and 473 at the lumbar spine. Table 1 shows the characteristics of postmenopausal women cate- gorized by the presence of osteoporosis. By comparison with women in the control group, women with osteoporosis were of higher age and lower height, weight, body mass in- dex, and waist circumference. Women with osteoporosis were also less likely to take estrogen therapy. The number of pregnancies, duration of menopause, and duration of breast feeding were higher in the osteoporotic group. Women in this group were more likely to have hypertension and histo- ry of fracture, and less likely to have hyperlipidemia.
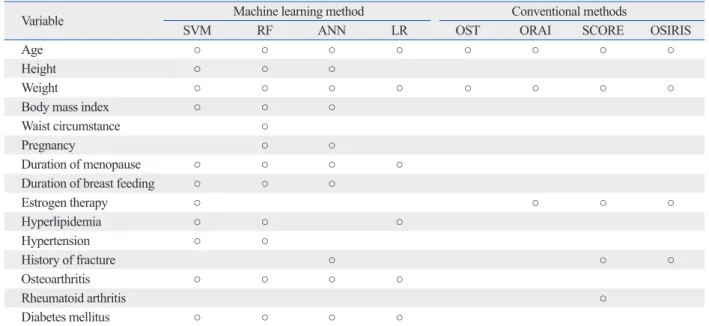
Table 2 describes the final multivariate LR derived from the training set using backward selection. Variables selected by LR were age, weight, duration of menopause, diabetes mellitus, hyperlipidemia, and osteoarthritis. Table 3 summa- rizes the results of variable selection for the various machine learning and conventional methods. While the conventional methods selected two to five variables to obtain simplicity, the machine learning methods except LR selected more than 10 variables for better performance. The predictors of osteo- porosis selected by SVM included age, height, weight, body osteoporotic group. Applying a classifier to the imbalanced
data could produce undesirable lower performance.30 There- fore, it was important to improve prediction models for the imbalanced data. To obtain the optimal result, we adopted a grid search in which a range of parameter values were test- ed using the 10-fold cross validation strategy. Due to the imbalanced data problem in this study, prediction accuracy might not be a good criterion for assessing performance since the minor class has less influence on accuracy than the major class.31 Therefore, we evaluated diagnostic abili- ties including not only accuracy, sensitivity, and specificity, but also AUC. The AUC is known as a strong predictor of performance, especially with regard to imbalanced prob- lems.30 To compare the performance of models, we generat- ed the ROC curves and selected cut-off points as the points on the ROC curve closest to the upper left corner. This meth- od maximized the Youden’s index, giving equal weight to sensitivity and specificity.32 ROC curve analysis is the most commonly used method in clinical analysis for establishing the optimal cut-off point. The cut-offs of the OST, ORAI, SCORE, and OSIRIS were calculated using ROC curve analysis. To discriminate osteoporosis, the following cut-offs were used: <-1 for OST, >16 for ORAI, >15 for SCORE, and <-1 for OSIRIS, respectively. We used MATLAB 2010a (Mathworks Inc., Natick, MA, USA) for the analysis of machine learning, SPSS 18.0 (SPSS Inc., Chicago, IL, USA) for LR and statistical analysis, and MedCalc 12.3 (Med- Calc Inc., Mariakerke, Belgium) for ROC analysis.
Table 1. Characteristics of Postmenopausal Women
Variable* Total (n=1674) Without osteoporosis
(n=1091) With osteoporosis
at any site (n=583) p value†
Age (yrs) 63.3±9.8 59.9±8.4 69.7±9.0 <0.001
Height (cm) 153.1±5.9 154.6±5.4 150.3±5.7 <0.001
Weight (kg) 56.8±8.8 58.9±8.3 52.9±8.2 <0.001
BMI (kg/m2) 24.1±3.3 24.6±3.3 23.3±3.1 <0.001
Waist circumference (cm) 82.1±9.2 82.8±9.2 80.8±9.2 <0.001
Pregnancy 4.5±2.3 4.3±2.2 5.0±2.4 <0.001
Duration of menopause (yrs) 14.8±10.7 11.2±8.8 21.5±10.6 <0.001
Duration of breast feeding (months) 54.1±51.5 43.3±44.4 74.5±57.3 <0.001
Estrogen therapy 272 (16.2) 224 (20.5) 48 (8.2) <0.001
Hyperlipidemia 227 (13.5) 169 (15.4) 58 (9.9) 0.001
Hypertension 667 (39.8) 410 (37.5) 257 (44.0) 0.009
History of fracture 243 (14.5) 144 (13.2) 99 (16.9) 0.036
Osteoarthritis 452 (27.0) 278 (25.4) 174 (29.8) 0.055
Rheumatoid arthritis 56 (3.3) 31 (2.8) 25 (4.2) 0.116
Diabetes mellitus 182 (10.8) 124 (11.3) 58 (9.9) 0.375
BMI, body mass index.
*Table values are given as mean±standard deviation or number (%) unless otherwise indicated.
†p-values were obtained by t-test and chi-square test.
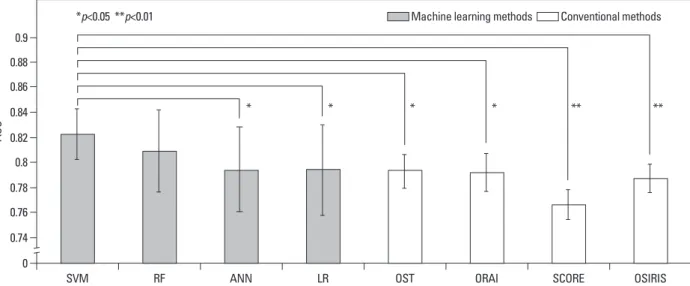
0.791, 0.766, and 0.787, respectively. In Fig. 1, we found that more complex discriminating functions such as SVM and RF showed better performance than simple linear func- tions such as LR, OST, ORAI, SCORE, and OSIRIS. For the AUCs, the SVM performed better than ANN (p=0.028), LR (p=0.037), OST (p=0.037), ORAI (p=0.022), SCORE (p=0.005), and OSIRIS (p=0.009) in 10-fold cross valida- tion using a Wilcoxon signed rank test.
Additionally, to assess the ability of the models for predict- ing osteoporosis, we applied our methods to a testing set composed of the independent data. Table 4 shows the re- sults of classifying the testing set for selecting women at risk of osteoporosis at various BMD measurement sites. As a result, the SVM model was the best discriminator between controls and women with osteoporosis. Considering osteo- porosis at any site, SVM predicted osteoporosis risk with an AUC of 0.827, accuracy of 76.7%, sensitivity of 77.8%, mass index, duration of menopause, duration of breast feed-
ing, estrogen therapy, hyperlipidemia, hypertension, osteo- arthritis, and diabetes mellitus. RF and ANN showed simi- lar results. The optimal model of SVM was found using a Gaussian kernel function with a penalty parameter C of 100 and scaling factor σ of 30. In RF, the optimal number of trees was 100, and the number of predictors for each node was 3. The optimal ANN was set with 3 nodes of a hidden layer and learning rate of 0.1.
Fig. 1 shows the prediction performance of 10-fold cross validation of the machine learning and conventional meth- ods. The mean and standard deviation of AUCs were calcu- lated from 10 validation results. We obtained the AUCs of SVM, RF, ANN and LR of 0.822, 0.808, 0.794, and 0.793, respectively. The predictors of the machine learning meth- ods came from selected variables shown in Table 3. The AUCs of OST, ORAI, SCORE, and OSIRIS were 0.794,
Table 2. Odds Ratios for Predicting Osteoporosis Risk Using the Multivariate Logistic Regression with Backward Selection Models
Variables β-coefficient Odds ratio [95% CI] p value
Age (per 1 yr increase) 0.09 1.09 [1.06-1.12] <0.001
Weight (per 1 kg increase) -0.07 0.92 [0.91-0.94] <0.001
Duration of menopause (per 1 yr increase) 0.03 1.03 [1.01-1.05] 0.002
Diabetes mellitus -0.53 0.58 [0.39-0.86] 0.007
Hyperlipidemia -0.47 0.62 [0.43-0.89] 0.011
Osteoarthritis 0.46 1.59 [0.92-2.73] 0.094
CI, confidence interval.
Table 3. Variable Selection in Machine Learning and Conventional Methods for Osteoporosis Risk of Total Hip, Femoral Neck, or Lumbar Spine
Variable Machine learning method Conventional methods
SVM RF ANN LR OST ORAI SCORE OSIRIS
Age ○ ○ ○ ○ ○ ○ ○ ○
Height ○ ○ ○
Weight ○ ○ ○ ○ ○ ○ ○ ○
Body mass index ○ ○ ○
Waist circumstance ○
Pregnancy ○ ○
Duration of menopause ○ ○ ○ ○
Duration of breast feeding ○ ○ ○
Estrogen therapy ○ ○ ○ ○
Hyperlipidemia ○ ○ ○
Hypertension ○ ○
History of fracture ○ ○ ○
Osteoarthritis ○ ○ ○ ○
Rheumatoid arthritis ○
Diabetes mellitus ○ ○ ○ ○
SVM, support vector machines; RF, random forests; ANN, artificial neural networks; LR, logistic regression; OST, osteoporosis self-assessment tool; ORAI, osteoporosis risk assessment instrument; SCORE, simple calculated osteoporosis risk estimation; OSIRIS, osteoporosis index of risk.
machine learning methods and conventional methods, respec- tively, we compared their ROC curves. LR was also includ- ed for comparison with SVM and OST. The AUCs of SVM, LR, and OST were 0.827, 0.809, and 0.806, respectively (Table 4).
DISCUSSION
Based on the various machine learning techniques, we in- vestigated a new approach for predicting osteoporosis risk in postmenopausal women using data from the KNHANES V-1. To our best knowledge, this is the first report on appli- cation of conventional decision tools for BMD assessment in a Korean population. Among the machine learning and conventional methods, our SVM model discriminated more accurately between women with osteoporosis and control women. The 10-fold cross validation and ROC analysis in- dicated that the SVM had a statistically significant improve- ment in predicting osteoporosis. In other words, SVM was more effective in analyzing the epidemiological underlying patterns of osteoporosis compared with the other methods.
This finding is consistent with a previous study on the com- parison of machine learning methods in various complex discriminating problems for predicting disease.33 Most ex- perts have used conventional methods, including OST, ORAI, SCORE, and OSIRIS, because of their simplicity.34 In this study, we applied complicated mathematical meth- ods for more accurate prediction. Despite its complexity, and specificity of 76.0%. SVM also predicted osteoporosis
at total hip, femoral neck and lumbar spine with the highest AUC and accuracy. SVM predicted osteoporosis at the total hip with an AUC of 0.921. On the other hand, osteoporosis at the lumbar spine was difficult to predict, with an AUC of 0.778. The ROC analysis demonstrated the SVM had the sta- tistically significant better accuracy than OST at total hip, femoral neck, and lumbar spine. Fig. 2 shows the ROC curves of SVM, LR, and OST in predicting osteoporosis at any site. Because SVM and OST had the highest AUC among the
Fig. 1. Performance results (AUC) of the machine learning and conventional methods using 10-fold cross validation. Error bars indicate the standard devia- tion of the mean. AUC, area under the curve; SVM, support vector machines; RF, random forests; ANN, artificial neural networks; LR, logistic regression;
OST, osteoporosis self-assessment tool; ORAI, osteoporosis risk assessment instrument; SCORE, simple calculated osteoporosis risk estimation; OSIRIS, os- teoporosis index of risk.
Fig. 2. Receiver operating characteristic curves (ROC) of support vector ma- chines (SVM), logistic regression (LR), and osteoporosis self-assessment tool (OST) in predicting osteoporosis risk at any site among total hip, femo- ral neck, or lumbar spine.
0.74 0 0.76 0.78 0.8 0.82 0.84 0.86 0.88 0.9
AUC
SVM RF ANN LR OST ORAI SCORE OSIRIS
Machine learning methods Conventional methods
*p<0.05 **p<0.01
* * * * ** **
0 0.2 0.4 0.6 0.8 1
Sensitivity
0 0.2 0.4 0.6 0.8 1
1-specificity
SVM LR OST
Table 4. Diagnostic Performance of Osteoporosis Risk Assessment Methods for the Testing Set Any site (total hip, femoral neck, or lumbar spine) [95% CI]AUC Accuracy (%)
[95% CI] Sensitivity (%)
[95% CI] Specificity (%)
[95% CI] PPV (%) NPV (%)
SVM 0.827 [0.788-0.854] 76.7 [74.5-78.6] 77.8 [72.6-83.0] 76.0 [72.0-80.1] 64.8 85.8 RF 0.824 [0.787-0.856] 76.5 [74.4-78.5] 76.6 [71.3-81.9] 76.5 [72.5-80.5] 64.9 85.2 ANN 0.807 [0.775-0.842] 75.2 [73.1-77.2] 76.6 [71.3-81.9] 74.4 [70.2-78.5] 62.9 84.8 LR 0.809 [0.776-0.846] 74.5 [72.3-76.6] 77.8 [72.6-83.0] 72.7 [68.5-76.9] 61.8 85.2 OST 0.806 [0.768-0.839] 74.0 [71.8-76.1] 75.4 [70.0-80.1] 73.2 [69.0-77.4] 61.5 84.0 ORAI 0.782 [0.741-0.815]* 74.7 [72.5-76.7] 65.1 [59.1-71.4] 79.7 [75.9-83.5] 64.6 80.1 SCORE 0.781 [0.742-0.811]* 68.2 [65.9-70.4]* 76.6 [71.3-81.9] 63.7 [59.1-68.2] 54.5 82.7 OSIRIS 0.798 [0.798-0.831]* 69.7 [67.4-71.8]* 82.7 [78.0-87.5] 62.7 [58.2-67.3] 55.8 86.5
Total hip [95% CI]AUC Accuracy (%)
[95% CI] Sensitivity (%)
[95% CI] Specificity (%)
[95% CI] PPV (%) NPV (%)
SVM 0.921 [0.863-0.948] 90.5 [88.9-91.8] 84.6 [73.2-95.9] 90.8 [88.6-93.1] 36.2 98.9 RF 0.910 [0.851-0.941] 88.1 [86.4-89.6]* 79.5 [66.8-92.1] 88.6 [86.1-91.1] 30.0 98.5 ANN 0.902 [0.856-0.939] 87.1 [85.4-88.6]* 82.0 [70.0-94.0] 87.4 [84.8-89.9] 28.5 98.7 LR 0.911 [0.866-0.943] 88.2 [86.6-89.7]* 84.6 [73.2-95.9] 88.5 [86.0-90.9] 31.1 98.9 OST 0.903 [0.834-0.939] 81.7 [79.7-83.5]* 89.7 [80.2-99.2] 81.2 [78.2-84.2] 22.7 99.2 ORAI 0.875 [0.801-0.914]* 73.0 [70.7-75.0]* 89.7 [80.2-99.2] 71.9 [68.4-75.4] 16.4 99.1 SCORE 0.885 [0.815-0.932]* 82.2 [80.2-83.9]* 79.4 [66.8-92.1] 82.3 [79.3-85.3] 21.6 98.4 OSIRIS 0.891 [0.821-0.930]* 76.4 [74.2-78.3]* 89.7 [80.2-99.2] 75.5 [72.2-78.9] 18.4 99.1
Femoral neck [95% CI]AUC Accuracy (%)
[95% CI] Sensitivity (%)
[95% CI] Specificity (%)
[95% CI] PPV (%) NPV (%)
SVM 0.874 [0.833-0.901] 80.4 [78.7-82.5] 81.3 [74.6-88.1] 80.5 [77.2-83.8] 49.7 94.8 RF 0.867 [0.829-0.899] 77.6 [75.4-79.5]* 81.3 [74.6-88.1] 76.6 [73.1-80.2] 45.2 94.5 ANN 0.845 [0.807-0.879] 77.1 [75.0-79.1]* 82.1 [75.5-88.7] 75.9 [72.3-79.5] 44.7 94.7 LR 0.855 [0.812-0.891] 76.6 [74.4-78.5]* 82.9 [76.4-89.4] 75.0 [71.4-78.6] 44.0 94.8 OST 0.855 [0.817-0.887] 77.6 [75.4-79.5]* 79.8 [72.9-86.7] 77.0 [73.5-80.5] 45.1 94.1 ORAI 0.828 [0.789-0.866]* 75.8 [73.7-77.9]* 82.1 [75.5-88.7] 74.3 [70.6-77.9] 43.0 94.6 SCORE 0.825 [0.782-0.860]* 72.8 [70.6-74.9]* 79.0 [72.0-86.0] 71.3 [67.5-75.1] 39.5 93.5 OSIRIS 0.845 [0.807-0.884] 79.0 [76.9-80.9] 72.0 [64.3-79.8] 80.7 [77.4-84.0] 46.9 92.4
Lumbar spine [95% CI]AUC Accuracy (%)
[95% CI] Sensitivity (%)
[95% CI] Specificity (%)
[95% CI] PPV (%) NPV (%)
SVM 0.778 [0.727-0.805] 73.1 [70.9-75.2] 70.9 [64.5-77.3] 74.0 [70.0-77.9] 52.2 86.4 RF 0.770 [0.726-0.803] 72.7 [70.5-74.9] 66.8 [60.1-73.4] 75.1 [71.1-78.9] 51.8 84.9 ANN 0.761 [0.724-0.801] 70.4 [68.2-72.6] 72.5 [66.2-78.8] 69.6 [65.5-73.7] 48.9 86.3 LR 0.752 [0.705-0.788] 70.4 [68.2-72.6] 72.5 [66.2-78.8] 69.6 [65.5-73.7] 48.9 86.3 OST 0.758 [0.710-0.795] 67.9 [65.6-70.1]* 71.5 [65.1-77.8] 66.5 [62.3-70.7] 46.1 85.3 ORAI 0.726 [0.673-0.758]* 72.1 [69.9-74.2] 59.5 [52.6-66.0] 77.1 [73.3-80.8] 51.1 82.6 SCORE 0.729 [0.687-0.772]* 62.9 [60.4-65.1]* 74.0 [67.9-80.2] 58.4 [54.0-62.8] 41.6 84.8 OSIRIS 0.751 [0.703-0.787] 63.4 [60.8-65.5]* 79.7 [74.1-85.4] 56.7 [52.3-61.1] 42.5 87.5 CI, confidence interval; AUC, area under the curve; PPV, positive predictive value; NPV, negative predictive value; SVM, support vector machines; RF, ran- dom forests; ANN, artificial neural networks; LR, logistic regression; OST, osteoporosis self-assessment tool; ORAI, osteoporosis risk assessment instru- ment; SCORE, simple calculated osteoporosis risk estimation; OSIRIS, osteoporosis index of risk.
*AUC or accuracy is significantly different from the SVM at the level of p<0.05.
Our SVM model also used hyperlipidemia, hypertension, osteoarthritis, and diabetes mellitus for more accurate pre- diction. Hyperlipidemia and diabetes mellitus were also se- lected in LR with significant odds ratios in Table 2, although they would be counterintuitive to many clinicians. There have been several studies indicating the influence of chron- ic diseases on the BMD of patients.14,40,41 However, these results also showed that the effect of chronic diseases on BMD was minor. Our prediction model was able to consid- er these chronic diseases in combination using a SVM char- acterized by nonlinearity and high dimension. Because the SVM model delicately handled a separating space com- posed of these factors in high dimension, it was possible to consider all factors for the improvement of sensitivity and specificity in predicting osteoporosis.
We found in the present study that the optimal SVM ad- opted a penalty parameter C of 100 and scaling factor σ of 30 for osteoporosis risk prediction. The parameter C con- trolled over-fitting and the σ controlled the degree of non- linearity of the SVM model.42 Our SVM had the similar pa- rameters to the several previous studies.33,43 However, most studies obtained the optimal parameters empirically, and did not show the specific optimal parameters.15,21,42 Since there is no clear guideline on selecting the most effective parameters for certain classification problems,44 our results may be a guide to future epidemiologic researches for pre- dicting osteoporosis.
There are several limitations to this study. First, the study was based on a cross-sectional survey which has several defects according to a medical view. For example, the prev- alence of disease was based on a health interview survey taken on one occasion. Weight, height, body mass index, and hormone therapy status, as well as BMD, could differ according to time of the measurement. Second, it was diffi- cult to consider drug effects. For example, treatment with steroids for rheumatoid arthritis, asthma, dermatitis, or auto- immune diseases is known to cause glucocorticoid-induced osteoporosis.45 Systematic approaches are warranted to con- sider the long-term effects of drugs in further studies. Third, our prediction models were developed for Korean women.
Several studies have indicated the possibility that Korean people have physiologic differences in bone metabolism.46,47 To validate our findings, further study is needed including large heterogeneous samples. Fourth, our study was charac- terized by imbalanced class distribution. Traditional classi- fiers have generally shown poor performance on imbal- anced data sets because they are designed to find the best our method is useful because computerized diagnostic deci-
sion supports have been increasingly easy to access due to the advancement of information systems for many medical problems.35
If our prediction model retains good performance after validation in a larger population, it will be possible to use this technique as a cost-effective prescreening tool to deter- mine candidates for evaluation with DEXA and also to pre- vent osteoporotic fracture in postmenopausal women at high risk. The patients in the high risk group categorized by this method should receive DEXA screening at the hospital.
However, patients in the low risk group could postpone re- ceiving a DEXA scan. Women experience menopause at 50 years old on average.36 Accordingly, when we regard the Korean women who are over 50 years old as potential meno- pausal population, menopausal women account for 31.8%
of all women in Korea. The 31.8% corresponds to approxi- mately 8.5 million according to the Korean National Statis- tical Office 2010. Although our SVM showed small im- provement of 2.7% in accuracy compared to OST, the 2.7%
corresponds to approximately 230000 women, which are not small population.
Our proposed SVM model included age, height, weight, body mass index, duration of menopause, duration of breast feeding, estrogen therapy, hyperlipidemia, hypertension, os- teoarthritis, and diabetes mellitus as predictors (Table 3).
Similar to earlier studies concerning prediction for osteopo- rosis, our results suggest that age is most closely associated with the development of osteoporosis, and weight is also an important factor. However, our findings also demonstrated different factors involved in osteoporosis such as height, duration of menopause, duration of breast feeding, and presence of chronic diseases such as hyperlipidemia, hyper- tension, osteoarthritis, and diabetes mellitus. Although many clinical studies have shown that height correlates with ver- tebral bone fractures, there has been no study using height as a predictor for osteoporosis at the total hip or femoral neck.37 In our study, height showed a significant association with osteoporosis at any site and could enhance a decision tool for osteoporosis risk assessment. Estrogen therapy, du- ration of menopause, and duration of breast feeding were selected due to their association with exposure to estrogen in the endocrine system. Traditionally, estrogen is thought to be the most important factor in bone growth and matura- tion in women.38 Breast feeding might cause low BMD due to the removal of estrogen through breast milk and reduc- tion of the cumulative exposure to estrogen.39
amination Survey 2008-2009. J Bone Miner Res 2012;27:1879-86.
8. Cui LH, Choi JS, Shin MH, Kweon SS, Park KS, Lee YH, et al.
Prevalence of osteoporosis and reference data for lumbar spine and hip bone mineral density in a Korean population. J Bone Min- er Metab 2008;26:609-17.
9. Choi HS, Oh HJ, Choi H, Choi WH, Kim JG, Kim KM, et al. Vita- min D insufficiency in Korea--a greater threat to younger genera- tion: the Korea National Health and Nutrition Examination Survey (KNHANES) 2008. J Clin Endocrinol Metab 2011;96:643-51.
10. Khosla S, Melton LJ 3rd. Clinical practice. Osteopenia. N Engl J Med 2007;356:2293-300.
11. Koh LK, Sedrine WB, Torralba TP, Kung A, Fujiwara S, Chan SP, et al. A simple tool to identify asian women at increased risk of osteoporosis. Osteoporos Int 2001;12:699-705.
12. Richy F, Gourlay M, Ross PD, Sen SS, Radican L, De Ceulaer F, et al. Validation and comparative evaluation of the osteoporosis self-assessment tool (OST) in a Caucasian population from Bel- gium. QJM 2004;97:39-46.
13. Rud B, Hilden J, Hyldstrup L, Hróbjartsson A. The Osteoporosis Self-Assessment Tool versus alternative tests for selecting post- menopausal women for bone mineral density assessment: a com- parative systematic review of accuracy. Osteoporos Int 2009;20:
599-607.
14. Hofbauer LC, Brueck CC, Singh SK, Dobnig H. Osteoporosis in patients with diabetes mellitus. J Bone Miner Res 2007;22:1317-28.
15. Hsieh CH, Lu RH, Lee NH, Chiu WT, Hsu MH, Li YC. Novel solutions for an old disease: diagnosis of acute appendicitis with random forest, support vector machines, and artificial neural net- works. Surgery 2011;149:87-93.
16. Larrañaga P, Calvo B, Santana R, Bielza C, Galdiano J, Inza I, et al. Machine learning in bioinformatics. Brief Bioinform 2006;7:
86-112.
17. Cortes C, Vapnik V. Support-vector networks. Mach Learn 1995;20:273-97.
18. Breiman L. Random forests. Mach Learn 2001;45:5-32.
19. Dreiseitl S, Ohno-Machado L. Logistic regression and artificial neural network classification models: a methodology review. J Biomed Inform 2002;35:352-9.
20. Bishop CM. Pattern Recognition and Machine Learning. 4th ed.
New York: Springer; 2006.
21. Ordóñez C, Matías JM, de Cos Juez JF, García PJ. Machine learn- ing techniques applied to the determination of osteoporosis inci- dence in post-menopausal women. Math Comput Model 2009;50:
673-9.
22. De Cos Juez FJ, Suárez-Suárez MA, Sánchez Lasheras F, Murcia- Mazón A. Application of neural networks to the study of the influ- ence of diet and lifestyle on the value of bone mineral density in post-menopausal women. Math Comput Model 2011;54:1665-70.
23. Lix LM, Yogendran MS, Leslie WD, Shaw SY, Baumgartner R, Bowman C, et al. Using multiple data features improved the valid- ity of osteoporosis case ascertainment from administrative data- bases. J Clin Epidemiol 2008;61:1250-60.
24. Walid M, Ahmad S, Fadi C, Dima R. Intelligent predictive osteo- porosis system. Int J Comput Appl 2011;32:28-30.
25. Ministry for Health, Welfare and Family Affairs. The Fifth Korea National Health and Nutrition Examination Survey (KNHANES V), 2010-Health Examination. [accessed on 2012, December 26].
Available at: http://knhanes.cdc.go.kr/.
26. Batista GEAPA, Monard MC. An analysis of four missing data treatment methods for supervised learning. Appl Artif Intell 2003;
classification for the majority.31 The imbalanced class was still critical even though we adopted a dense grid search to decide the optimal prediction models in order to overcome this problem. Therefore, if more patient data associated with osteoporosis were collected, the performance would be ex- pected to improve.
In conclusion, the most important finding of this study is the identification of postmenopausal women at high risk of osteoporosis to increase the possibility of appropriate treat- ment before fracture occurs. Machine learning methods might contribute to the advancement of clinical decision tools and understanding about the risk factors for osteopo- rosis. Further studies should be targeted at constructing an extended prediction model for progressive osteoporosis through the collection of prospective data, and the simulta- neous prediction of osteopenia and osteoporosis using multi- category classification. We hope that this study enables women to reduce the risk of osteoporosis, which is the ma- jor cause of fracture.
ACKNOWLEDGEMENTS
This work was supported by the National Research Foun- dation of Korea (NRF) grant funded by the Korea govern- ment (MEST) (NRF-2012R1A2A2A03045612).
REFERENCES
1. Marshall D, Johnell O, Wedel H. Meta-analysis of how well mea- sures of bone mineral density predict occurrence of osteoporotic fractures. BMJ 1996;312:1254-9.
2. Kanis JA. Assessment of fracture risk and its application to screen- ing for postmenopausal osteoporosis: synopsis of a WHO report.
WHO Study Group. Osteoporos Int 1994;4:368-81.
3. Nayak S, Roberts MS, Greenspan SL. Cost-effectiveness of dif- ferent screening strategies for osteoporosis in postmenopausal women. Ann Intern Med 2011;155:751-61.
4. Elliot-Gibson V, Bogoch ER, Jamal SA, Beaton DE. Practice pat- terns in the diagnosis and treatment of osteoporosis after a fragility fracture: a systematic review. Osteoporos Int 2004;15:767-78.
5. Raisz LG. Clinical practice. Screening for osteoporosis. N Engl J Med 2005;353:164-71.
6. Trémollieres FA, Pouillès JM, Drewniak N, Laparra J, Ribot CA, Dargent-Molina P. Fracture risk prediction using BMD and clini- cal risk factors in early postmenopausal women: sensitivity of the WHO FRAX tool. J Bone Miner Res 2010;25:1002-9.
7. Choi YJ, Oh HJ, Kim DJ, Lee Y, Chung YS. The prevalence of os- teoporosis in Korean adults aged 50 years or older and the higher diagnosis rates in women who were beneficiaries of a national screening program: the Korea National Health and Nutrition Ex-
over markers with bone mineral density in men and women: a key role for bioavailable estrogen. J Clin Endocrinol Metab 1998;83:
2266-74.
39. Lipworth L, Bailey LR, Trichopoulos D. History of breast-feeding in relation to breast cancer risk: a review of the epidemiologic lit- erature. J Natl Cancer Inst 2000;92:302-12.
40. Kim KC, Shin DH, Lee SY, Im JA, Lee DC. Relation between obesity and bone mineral density and vertebral fractures in Korean postmenopausal women. Yonsei Med J 2010;51:857-63.
41. MacGregor GA, Cappuccio FP. The kidney and essential hyper- tension: a link to osteoporosis? J Hypertens 1993;11:781-5.
42. Yu W, Liu T, Valdez R, Gwinn M, Khoury MJ. Application of support vector machine modeling for prediction of common dis- eases: the case of diabetes and pre-diabetes. BMC Med Inform Decis Mak 2010;10:16.
43. Yang ZR, Chou KC. Bio-support vector machines for computa- tional proteomics. Bioinformatics 2004;20:735-41.
44. Liu HX, Zhang RS, Luan F, Yao XJ, Liu MC, Hu ZD, et al. Diag- nosing breast cancer based on support vector machines. J Chem Inf Comput Sci 2003;43:900-7.
45. Van Staa TP, Leufkens HG, Abenhaim L, Zhang B, Cooper C.
Use of oral corticosteroids and risk of fractures. J Bone Miner Res 2000;15:993-1000.
46. Lips P, Hosking D, Lippuner K, Norquist JM, Wehren L, Maalouf G, et al. The prevalence of vitamin D inadequacy amongst women with osteoporosis: an international epidemiological investigation.
J Intern Med 2006;260:245-54.
47. Choi JY, Shin A, Park SK, Chung HW, Cho SI, Shin CS, et al.
Genetic polymorphisms of OPG, RANK, and ESR1 and bone mineral density in Korean postmenopausal women. Calcif Tissue Int 2005;77:152-9.
17:519-33.
27. Kohavi R. A study of cross-validation and bootstrap for accuracy estimation and model selection. IJCAI 1995;14:1137-43.
28. Saeys Y, Inza I, Larrañaga P. A review of feature selection tech- niques in bioinformatics. Bioinformatics 2007;23:2507-17.
29. Dash M, Liu H. Consistency-based search in feature selection. Ar- tif Intell 2003;151:155-76.
30. Kotsiantis S, Kanellopoulos D, Pintelas P. Handling imbalanced datasets: a review. GESTS Int T Comput Sci Eng 2006;30:25-36.
31. Sun Y, Kamel MS, Wong AKC, Wang Y. Cost-sensitive boosting for classification of imbalanced data. Pattern Recogn 2007;40:
3358-78.
32. Fluss R, Faraggi D, Reiser B. Estimation of the Youden Index and its associated cutoff point. Biom J 2005;47:458-72.
33. Agranoff D, Fernandez-Reyes D, Papadopoulos MC, Rojas SA, Herbster M, Loosemore A, et al. Identification of diagnostic mark- ers for tuberculosis by proteomic fingerprinting of serum. Lancet 2006;368:1012-21.
34. Schwartz EN, Steinberg DM. Prescreening tools to determine who needs DXA. Curr Osteoporos Rep 2006;4:148-52.
35. Patel VL, Shortliffe EH, Stefanelli M, Szolovits P, Berthold MR, Bellazzi R, et al. The coming of age of artificial intelligence in medicine. Artif Intell Med 2009;46:5-17.
36. Yeun EJ. A study on the health promoting lifestyle practices of middle-aged women in Korea. J Korean Soc Health Educ Promot 2000;17:41-59.
37. Ferrar L, Jiang G, Armbrecht G, Reid DM, Roux C, Glüer CC, et al. Is short vertebral height always an osteoporotic fracture? The Osteoporosis and Ultrasound Study (OPUS). Bone 2007;41:5-12.
38. Khosla S, Melton LJ 3rd, Atkinson EJ, O’Fallon WM, Klee GG, Riggs BL. Relationship of serum sex steroid levels and bone turn-
![Table 4. Diagnostic Performance of Osteoporosis Risk Assessment Methods for the Testing Set Any site (total hip, femoral neck, or lumbar spine) [95% CI]AUC Accuracy (%)](https://thumb-ap.123doks.com/thumbv2/123dokinfo/5488211.667771/7.892.104.810.122.1033/diagnostic-performance-osteoporosis-assessment-methods-testing-femoral-accuracy.webp)
