Original Article
Anterior Chamber Configuration Changes after Cataract Surgery in Eyes with Glaucoma
Martha Kim
1, Ki Ho Park
2, Tae-Woo Kim 1, Dong Myung Kim
2
1
Department of Ophthalmology, Seoul National University Bundang Hospital, Seongnam, Korea
2
Department of Ophthalmology, Seoul National University Hospital, Seoul National University College of Medicine, Seoul, Korea
Angle-closure glaucoma (ACG) and open-angle glau- coma (OAG) are thought to arise from different pathogen- eses. ACG typically results from abnormal anatomy of the anterior segment of the eye, such as a narrow anterior chamber angle, a shallow anterior chamber depth, a thicker lens, a more anterior lens position, a small corneal diam- eter or a shorter axial length [1-4]. Lens position and size play a pivotal role in angle closure; therefore, lens extrac-
tion is a novel, efficient treatment protocol of acute and chronic ACG [5-9]. On the other hand, those with OAG ap- pear to have a normal iridocorneal angle but the aqueous outflow is low. To better understand the pathophysiology of glaucoma and to apply such knowledge to clinical treat- ment, precise visualization and quantitative evaluation of angle configurations is essential.
Recently, anterior segment optical coherence tomogra- phy (AS-OCT) has been used for quantitative evaluation of anterior segment configurations. A number of studies that used AS-OCT have reported adequate angle configuration change after cataract extraction in normal eyes [10-12].
In this study, we compared changes in anterior chamber configurations in ACG- and OAG-eyes after phacoemulsi- fication and posterior chamber intraocular lens (IOL) im-
© 2012 The Korean Ophthalmological Society
This is an Open Access article distributed under the terms of the Creative Commons Attribution Non-Commercial License (http://creativecommons.org/licenses /by-nc/3.0/) which permits unrestricted non-commercial use, distribution, and reproduction in any medium, provided the original work is properly cited.
Received: September 28, 2010 Accepted: March 7, 2011
Corresponding Author: Ki Ho Park, MD. Department of Ophthalmology, Seoul National University College of Medicine, #101 Daehak-ro, Jongno- gu, Seoul 100-799, Korea. Tel: 82-2-2072-2438, Fax: 82-2-741-3187, E-mail: [email protected]
Purpose: To evaluate changes in anterior chamber depth (ACD) and angle width induced by phacoemulsifica- tion and intraocular lens (IOL) implantation in eyes with glaucoma, using anterior segment optical coherence tomography (AS-OCT).
Methods: Eleven eyes of 11 patients with angle-closure glaucoma (ACG) and 12 eyes of 12 patients with open- angle glaucoma (OAG) underwent phacoemulsification and IOL implantation. Using AS-OCT, ACD and angle parameters were measured before and 2 days after surgery. Change in intraocular pressure (IOP) and num- ber of ocular hypotensive drugs were evaluated.
Results: After surgery, central ACD and angle parameters increased significantly in eyes with glaucoma (p <
0.05). Prior to surgery, mean central ACD in the ACG group was approximately 1.0 mm smaller than that in the OAG group (p < 0.001). Post surgery, mean ACD of the ACG group was still significantly smaller than that of the OAG group. No significant differences were found in angle parameters between the ACG and OAG groups. In the ACG group, postoperative IOP at the final visit was significantly lower than preoperative IOP (p
= 0.018) and there was no significant change in the number of ocular hypotensive medications used, although clinically, patients required fewer medications. In the OAG group, the IOP and number of ocular hypotensive drugs were almost unchanged after surgery.
Conclusions: The ACD and angle width in eyes with glaucoma increased significantly after phacoemulsification and IOL implantation. Postoperative ACD significantly differed between the ACG and OAG groups, whereas angle parameters did not differ.
Key Words: Angle-closure glaucoma, Anterior chamber, Anterior eye segment, Cataract extraction,
Open-angle glaucoma
plantation. For a quantitative analysis of the anterior cham- ber configurations, we used AS-OCT. We also evaluated the influence of cataract surgery in controlling intraocular pressure (IOP) and the number of required ocular hypoten- sive medications in patients with ACG and OAG both pre- and post-surgery.
Materials and Methods
Twenty-three eyes of 23 patients participated in this study (11 eyes affected by ACG and 12 eyes affected by OAG). A total of 23 eyes underwent phacoemulsification and foldable IOL implantation from March 2008 to July 2009. Informed consent was obtained from all patients in compliance with the World Medical Association Declara- tion of Helsinki. The local institutional review board ap- proved the protocol.
All patients completed an ophthalmologic examination including best-corrected visual acuity and manifest re- fraction, slit-lamp biomicroscopy, Goldmann applanation tonometry, gonioscopy, and indirect ophthalmoscopy. The number of ocular hypotensive medications being taken by each patient was assessed prior to surgery.
Axial lengths were obtained using the Humphrey 820 model A-scan ultrasound unit (Humphrey Systems, Dub- lin, CA, USA). ACG and OAG patients were categorized based on recent diagnostic classifications of glaucoma [13]. In brief, ACG is defined as an eye with an occlud- able drainage angle and features indicating that trabecular obstruction by the peripheral iris has occurred, such as peripheral anterior synechia, elevated IOP, iris whirl- ing, ‘glaucomfleken’ lens opacities or excessive pigment deposition on the trabecular surface, accompanied with glaucomatous optic disc changes. Eyes with a history of angle-closure attack and/or previous laser iridotomy were also included in the ACG group. The OAG was defined as an eye with an open angle, elevated IOP and glaucomatous optic neuropathy such as optic nerve head excavation or thinning of the neuroretinal rim and corresponding visual field defects.
One surgeon (PKH) performed all operations under topical anesthesia. In all but two eyes, a 2.75 mm clear corneal incision through a temporal approach was created;
in two eyes, a 2.2 mm clear corneal incision was made.
Through this incision, the continuous curvilinear capsulor- rhexis measuring approximately 5.5 mm in the diameter was formed. The hydrodissection was followed by phaco- emulsification of the nucleus and cortex aspiration. The lens capsule was inflated with an ophthalmic viscosurgical device (OVD) and the foldable IOL was placed in the cap- sular bag. The corneal wound was not sutured. There were no intraoperative or postoperative complications for any patients.
We performed AS-OCT (Visante; Carl Zeiss Meditec,
Dublin, CA, USA) on the eyes of both patient groups before surgery and 2 days after. One examiner obtained all images under identical lighting conditions. For the measurement, the pupil was undilated and the patient was asked to sit and fixate on an indicator in the AS-OCT. Im- ages of the nasal and temporal angle quadrants (0° and 180° meridians) were captured until the centration and quality were enough to analyze (Fig. 1). IOP measurement using a Goldmann applanation tonometer and an assess- ment of the number of ocular hypotensive medications were performed every visit after surgery.
We selected the best images and analyzed them using custom software (Iridocorneal module, Carl Zeiss Med- itec). Central anterior chamber depth (ACD), defined as the distance from the endothelium at the center of the cornea to the anterior pole of the lens or IOL, was an important parameter in the analysis. We calculated anterior chamber angle width in two ways: 1) anterior chamber angle (ACA) - the angle between the iris tangential line and that of the posterior corneal surface with its apex in the angle recess and 2) trabecular-iris angle (TIA) - the angle between the arms passing through a point on the trabecular meshwork 500 μm from the scleral spur and the point perpendicu- larly opposite on the iris. Anterior chamber angle width was also analyzed using standardized angle parameters after manual identification of the scleral spur: 1) angle- opening distance at 500 μm (AOD
500) and AOD at 750 μm (AOD
750) – distance of a perpendicular from the trabecular meshwork on the iris at a point 500 or 750 μm from the sclera spur and 2) trabecular-iris space area up to 500 μm
Fig. 1. Anterior segment optical coherence tomography showed changes in the anterior chamber configuration induced by phaco- emulsification and posterior chamber intraocular lens implanta- tion in eyes with angle-closure glaucoma (ACG) and open-angle glaucoma (OAG). Preoperatively, the anterior chamber depth and angle width in eyes with ACG (left) were smaller than in the eyes with OAG (right). However, the anterior chamber depth and angle width were almost identical in eyes with ACG and OAG after cataract surgery.
Angle-closure glaucoma
Preoperative
Postoperative
Open-angle glaucoma
(TISA
500) or 750 μm (TISA
750) – the area bounded by the corneal endothelium, trabecular meshwork and anterior iris surface out to a distance of 500 or 750 μm from the scleral spur.
All statistical analyses were performed using a chi- Square test, Mann-Whitney U-test or Wilcoxon’s rank sum test. Age and axial length were adjusted for using the gen- eral linear model. All results were considered significant at p < 0.05, two-tailed.
Results
The mean age of patients was 69.4 ± 6.6 years. The mean follow-up period was 3.82 ± 4.51 months (range, 1 to 16 months) in the ACG group and 5.33 ± 2.93 months (range, 1 to 9 months) in the OAG group. Patient characteristics are listed in Tables 1 and 2. Three types of IOLs were used.
No significant differences were found between the two groups with regard to age, gender, laterality, visual acuity,
Table 2. Comparison of baseline characteristics between patients with open-angle glaucoma and angle-closure glaucoma ACG group (n = 11) OAG group (n = 12) p-value
Age (year ± mean deviation) 69.5 ± 5.8 69.3 ± 7.5 0.880
*Gender (M : F) 2 : 9 8 : 4 0.532
†Laterality (R : L) 6 : 5 6 : 6 0.835
†Refractive error (diopters) -2.6 ± 3.2 0.1 ± 2.1 0.113
*Axial length (mm) 22.4 ± 0.9 23.6 ± 1.1 0.013
*Visual acuity (logMAR) -0.7 ± 0.4 -0.6 ± 0.6 0.449
*Intraocular pressure (mmHg) 16.9 ± 7.1 13.3 ± 3.4 0.091
*Follow-up periods (mon) 3.8 ± 4.5 5.3 ± 1.9 0.104
*ACG = angle-closure glaucoma; OAG = open-angle glaucoma; logMAR = logarithm of the minimal angle of resolution.
*
Mann-Whitney U-test;
†Chi-square test.
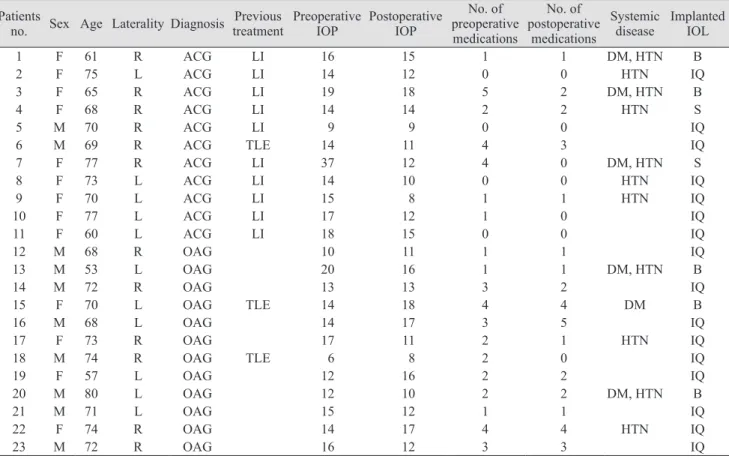
Table 1. Characteristics of patients Patients
no. Sex Age Laterality Diagnosis Previous treatment Preoperative
IOP Postoperative IOP
No. of preoperative medications
No. of postoperative
medications
Systemic
disease Implanted IOL
1 F 61 R ACG LI 16 15 1 1 DM, HTN B
2 F 75 L ACG LI 14 12 0 0 HTN IQ
3 F 65 R ACG LI 19 18 5 2 DM, HTN B
4 F 68 R ACG LI 14 14 2 2 HTN S
5 M 70 R ACG LI 9 9 0 0 IQ
6 M 69 R ACG TLE 14 11 4 3 IQ
7 F 77 R ACG LI 37 12 4 0 DM, HTN S
8 F 73 L ACG LI 14 10 0 0 HTN IQ
9 F 70 L ACG LI 15 8 1 1 HTN IQ
10 F 77 L ACG LI 17 12 1 0 IQ
11 F 60 L ACG LI 18 15 0 0 IQ
12 M 68 R OAG 10 11 1 1 IQ
13 M 53 L OAG 20 16 1 1 DM, HTN B
14 M 72 R OAG 13 13 3 2 IQ
15 F 70 L OAG TLE 14 18 4 4 DM B
16 M 68 L OAG 14 17 3 5 IQ
17 F 73 R OAG 17 11 2 1 HTN IQ
18 M 74 R OAG TLE 6 8 2 0 IQ
19 F 57 L OAG 12 16 2 2 IQ
20 M 80 L OAG 12 10 2 2 DM, HTN B
21 M 71 L OAG 15 12 1 1 IQ
22 F 74 R OAG 14 17 4 4 HTN IQ
23 M 72 R OAG 16 12 3 3 IQ
IOP = intraocular pressure; IOL = intraocular lens; ACG = angle-closure glaucoma; LI = laser iridotomy; DM = diabetes mellitus; HTN =
hypertension; TLE = trabeculectomy; OAG = open-angle glaucoma; B = Biovue IOL (Oii, Ontario, CA, USA); IQ = Acrysof IQ IOL (Alcon,
Fort Worth, TX, USA); S = Acrysof SA60AT IOL (Alcon).
refractive errors, follow-up periods and preoperative IOP.
Axial length was significantly longer in eyes with OAG than with ACG (p = 0.013).
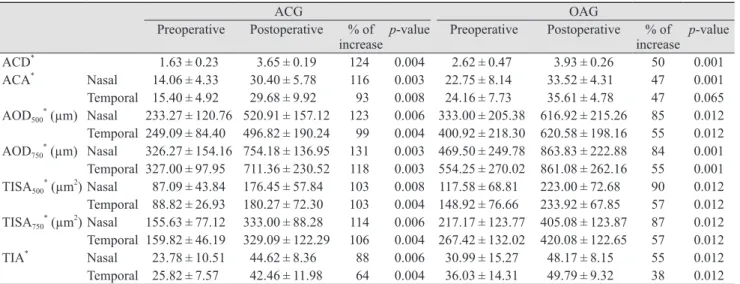
Table 3 shows the anterior chamber parameters before and after cataract surgery, and percentage change for each parameter after surgery of the two groups. Preoperative mean ACD of the ACG group was significantly less than that of the OAG group (p < 0.001). After surgery, ACD in- creased significantly after cataract surgery in both groups ( p < 0.01) and the difference was greater in the ACG group (p < 0.001). The differences in ACD, between the two groups remained statistically significant after surgery, and postoperative ACD was smaller in the ACG group (p
< 0.01). However, postoperative ACD did not remain sig- nificant after adjusting for age and axial length (p = 0.85), whereas preoperative ACD and changes in ACD remained significant (p < 0.001 and p = 0.002, respectively).
The ACA in the nasal and temporal quadrants in both the ACG and OAG groups increased significantly after surgery (p < 0.05). The ACA of the ACG group was signif- icantly smaller than that of the OAG group before surgery.
Postoperative ACA and the differences associated with the surgery, did not statistically differ between groups. After adjusting for age and axial length, preoperative ACA of both angles did not significantly differ between groups (p
= 0.062 and p = 0.077, respectively). Other angle param- eters that used the scleral spur as a reference point showed similar results. All angle parameters in the ACG and OAG patients increased significantly after the surgery (p < 0.01) (Table 3). Each of the angle parameters showed no signifi- cant differences between the ACG and OAG groups before and after surgery, except for preoperative AOD
750in the
temporal quadrant (p = 0.037). After adjusting for age and axial length, all angle parameter changes did not signifi- cantly differ by group. Finally, there were no significant differences on any parameters in the nasal and temporal quadrants after surgery.
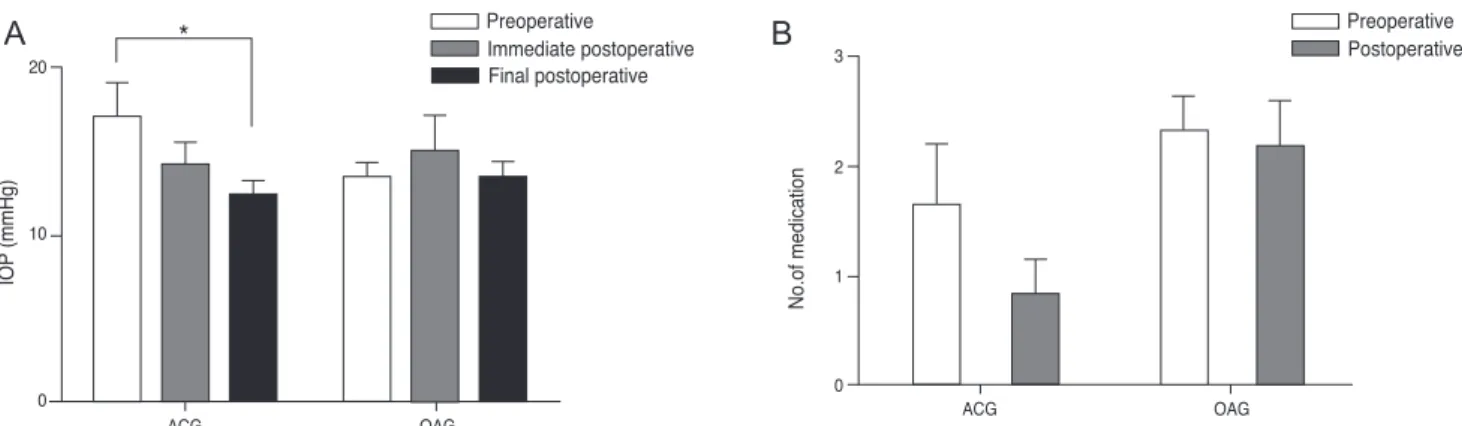
Preoperative and postoperative IOP and the number of ocular hypotensive medications needed to maintain a stable IOP were also assessed. In the ACG group, preoperative IOP was 17.00 ± 7.14 mmHg and postoperative IOP at two days after surgery decreased to 14.09 ± 4.81 mmHg. The IOP at one month postoperatively and the IOP at the final visit were 12.36 ± 2.94 mmHg and 12.18 ± 4.38 mmHg, respectively, which were significantly decreased compared to the preoperative IOP (p = 0.014 and p = 0.018, respec- tively). The IOP in the OAG group increased from 13.33 ± 3.37 mmHg to 15.00 ± 7.62 mmHg from pre-surgery to im- mediately post-surgery. However, the IOP after one month and the final IOP were 13.42 ± 3.26 mmHg and 13.42 ± 3.23 mmHg in OAG group, which were almost identical to the mean value prior to surgery (Fig. 2A). The number of ocu- lar hypotensive medications needed decreased from 1.64
± 1.86 to 0.82 ± 1.08, one month after surgery in the ACG group and was maintained at the final visit. The number of medications needed in the OAG group was 2.33 ± 1.07 pre- operatively and 2.17 ± 1.53 at one month postoperatively, which was maintained at the final visit (Fig. 2B). These differences were not statistically significant.
Discussion
In this study, we analyzed the change in anterior seg- ment configuration after cataract extraction and posterior Table 3. Anterior chamber depth and angle parameters before and after cataract surgery in eyes with glaucoma
ACG OAG
Preoperative Postoperative % of
increase p-value Preoperative Postoperative % of
increase p-value ACD
*1.63 ± 0.23 3.65 ± 0.19 124 0.004 2.62 ± 0.47 3.93 ± 0.26 50 0.001 ACA
*Nasal 14.06 ± 4.33 30.40 ± 5.78 116 0.003 22.75 ± 8.14 33.52 ± 4.31 47 0.001 Temporal 15.40 ± 4.92 29.68 ± 9.92 93 0.008 24.16 ± 7.73 35.61 ± 4.78 47 0.065 AOD
500*(µm) Nasal 233.27 ± 120.76 520.91 ± 157.12 123 0.006 333.00 ± 205.38 616.92 ± 215.26 85 0.012 Temporal 249.09 ± 84.40 496.82 ± 190.24 99 0.004 400.92 ± 218.30 620.58 ± 198.16 55 0.012 AOD
750*(µm) Nasal 326.27 ± 154.16 754.18 ± 136.95 131 0.003 469.50 ± 249.78 863.83 ± 222.88 84 0.001 Temporal 327.00 ± 97.95 711.36 ± 230.52 118 0.003 554.25 ± 270.02 861.08 ± 262.16 55 0.001 TISA
500*(µm
2) Nasal 87.09 ± 43.84 176.45 ± 57.84 103 0.008 117.58 ± 68.81 223.00 ± 72.68 90 0.012 Temporal 88.82 ± 26.93 180.27 ± 72.30 103 0.004 148.92 ± 76.66 233.92 ± 67.85 57 0.012 TISA
750*(µm
2) Nasal 155.63 ± 77.12 333.00 ± 88.28 114 0.006 217.17 ± 123.77 405.08 ± 123.87 87 0.012 Temporal 159.82 ± 46.19 329.09 ± 122.29 106 0.004 267.42 ± 132.02 420.08 ± 122.65 57 0.012 TIA
*Nasal 23.78 ± 10.51 44.62 ± 8.36 88 0.006 30.99 ± 15.27 48.17 ± 8.15 55 0.012 Temporal 25.82 ± 7.57 42.46 ± 11.98 64 0.004 36.03 ± 14.31 49.79 ± 9.32 38 0.012 ACG = angle-closure glaucoma; OAG = open-angle glaucoma; ACD = anterior chamber depth; ACA = anterior chamber angle; AOD = angle opening distance; TISA = trabecular-iris space area; TIA = trabecular-iris angle.
*
Wilcoxon signed ranks test.
chamber IOL implantation in eyes with ACG and OAG using anterior segment OCT to quantitatively measure parameters. Our results showed that the ACD and ACA parameters significantly differed from pre- to post-surgery, which is consistent with findings from previous studies [5,10-12,14]. Compared to the OAG group, the ACG group had a smaller ACD before and after surgery. Preoperative ACD was 1.63 ± 0.23 mm in the ACG group and 2.62 ± 0.47 mm in the OAG group. Differences in ACD between the two groups were also consistent with findings of an earlier study [5].
The differences in the changes of the ACA between the ACG and OAG groups were 8.69˚ at the nasal and 8.76˚ at the temporal (mean 8.73˚) quadrants before cataract sur- gery, and 3.12˚ at the nasal and 5.93˚ at the temporal (mean 4.53˚) quadrants after surgery. Preoperative ACA was sig- nificantly smaller in the ACG group compared to the OAG group, whereas postoperative ACA did not differ between the two groups. Additionally, the change caused by cata- ract extraction did not significantly differ between the two groups. This result suggests that the lens factor may be an important pathological parameter in ACG. Although there are likely other factors that are also important. However, after adjusting for age and axial length, other parameters did not significantly differ between groups except for pre- operative ACD and changes in ACD, suggesting that axial length may also be an important factor which influence to the anterior chamber configuration.
All angle parameters including the AOD, TISA and TIA significantly increased after surgery in both groups (p
< 0.01). Percent change on these parameters was always smaller in the OAG versus ACG group. In the OAG group, the AOD and TISA increased by about 85% at the nasal quadrant and by 55% at the temporal quadrant. This result was consistent with the findings of a previous study [10].
Nolan et al. [10] studied 21 normal subjects using the AS-
OCT before and after cataract extraction surgery. After the surgery, the AOD
500and TISA
750increased by about 80% at the nasal quadrant and about 55% at the temporal quadrant. Collectively, these results suggest that individu- als with OAG likely have similar angle anatomy compared to normal subjects and that the effect of cataract surgery on angle anatomy was similar to that done in normal eyes [12]. In contrast, the AOD and TISA in the ACG group increased 112% (from 99% to 131%) after cataract surgery and showed no differences by quadrant in the present study. The percent increase did differ by quadrant in the OAG group, whereas it was identical in the ACG group.
These differences may have been due to the small number of patients in the present study; however, other factors could have influenced these results. One other possible explanation is that the goniosynechiolysis of the angle, during surgery, in conjunction with the OVD and fluids via the temporal clear cornea, might have had differential quadrant effects.
In the ACG group, the IOP was reduced by 17% (2.91 mmHg) after surgery, whereas the IOP increased by 13%
(1.67 mmHg) in the OAG group immediately postopera- tively. There were two patients that had peak IOP in the OAG group and one of them was a steroid responder. The final IOP measured at the final visit decreased by 27% (4.64 mmHg) in ACG group and there were no changes in the OAG group. The final IOP was similar in the two study groups; however, the percent change was significantly dif- ferent (p < 0.05). Furthermore, the change in the number of ocular hypotensive medications needed differed in the two groups (50% reduction in ACG group vs. 7% reduc- tion in OAG group). Collectively, these results indicate that cataract surgery might cause more changes in terms of lowering the IOP and reducing the number of medications needed for treatment in those with ACG than those with OAG.
ACG OAG
No.of medication
0 1 2 3
Preoperative Postoperative
2010
0
ACG
*
OAG